Reports

- Global Locations -

Headquarters

Future Market Insights, Inc.

Christiana Corporate, 200
Continental Drive, Suite 401,
Newark, Delaware - 19713,
United States

T: +1-845-579-5705

Americas

Future Market Insights, Inc.

616 Corporate Way, Suite 2-9018,
Valley Cottage, NY 10989, United States

T: +1-347-918-3531

MEA

Future Market Insights

1602-6 Jumeirah Bay X2 Tower, Plot No: JLT-PH2-X2A,
Jumeirah Lakes Towers, Dubai,
United Arab Emirates

Europe

Future Market Insights

3rd Floor, 207 Regent Street,
W1B 3HH London
United Kingdom

T: + 44 (0) 20 8123 9659
D: +44 (0) 20 3287 4268

Asia Pacific

Future Market Insights

IndiaLand Global Tech Park, Unit UG-1, Behind Grand HighStreet, Phase 1, Hinjawadi, MH, Pune – 411057, India

Thailand Tourism Industry Snapshot

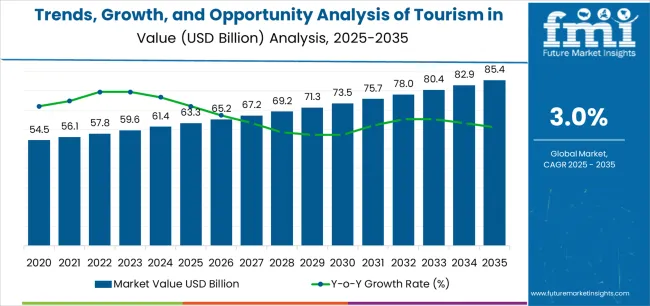
Demand for tourism in Thailand is valued at US$ 61,323.00 million in 2024. As affordable travel costs make Thailand a budget-friendly destination, the industry holds the potential to exceed US$ 84,027.30 million by 2034. With high investment in tourism infrastructure, the industry is set to record a CAGR of 3.2% over the forecast period.

Industry Outlook

Key Industry Attributes Details
Industry Size, 2023 US$ 59,536.90 million
Industry Size, 2024 US$ 61,323.00 million
Industry Size, 2034 US$ 84,027.30 million
Value CAGR (2024 to 2034) 3.2%

Don't pay for what you don't need

Customize your report by selecting specific countries or regions and save 30%!

Thailand Tourism Industry Outlook

Thailand’s numerous religious destinations, not only of the dominant Buddhist kind but also Hindu and Muslim, are seeing a greater number of spiritual and family tourists abound in the country.

Efforts by tourism providers to provide a comprehensive temple or Wat experience, i.e., a guided tour of the major religious destinations in a location, are attracting tourists. For example, boat tours in Bangkok not only cover the important Wats in the city but also provide a scenic experience to tourists.

From the spiritual to the luxurious, Thailand has a plethora of experiences for tourists with loose purses. Tourism industry stakeholders in Thailand are concentrating on premium experiences to increase earnings.

Private rooms in clubs, fine dining experiences, and other assorted luxuries, such as access to the roof of the King Power Mahanakhon, are seeing a higher grade of tourists make the journey to Thailand’s hotspots.

The enormous volume of tourists visiting Thailand is necessitating tour companies in the country to provide consumers with better facilities and guidance. Bangkok is reputed as the most visited city in the world, while other popular areas like Pattaya and Phuket are also teeming with tourists.

To help tourists navigate the country better, tourist companies are providing facilities like online booking, AI tools for planning trips, virtual experiences, and more. The street food of Thailand is another selling point that is being utilized by stakeholders.

Street tours in Thailand incorporate indulging in various Thai delicacies, while the cheap nature of the street food also enamors tourists. These street food excursions are complemented by shopping stops, where again the relatively cheap nature of the goods comes into play.

Opportunities for Vendors to Capitalize on Thailand Tourism Trends

Thailand’s happening nightlife draws a significant number of tourists to the country who want to take part in the club culture. Whether sports bars, pubs, or racier establishments, tourist companies have the opportunity to go beyond traditional tourist routes and offer a freer and more pleasurable experience to tourists.

Tour companies in Thailand are thus seeing bachelors and trendy couples emerge as a significant part of the consumer base. Chinatown in Bangkok and Walking Street in Pattaya are popular destinations for these kinds of experiences.

The vibrant nature of the nightlife in Thailand is aided by the wide availability of alcohol, in all price ranges, as well as fewer restrictions on cannabis use as compared to other Asian countries.

International tourists in Thailand are also finding navigating the country to be an easy experience due to the proliferation of convenience stores in the country. For example, Thailand boasts the second-highest number of 7-Eleven stores in the world.

The beaches in Thailand are one of the primary selling points for tourism in the country. Tour companies, to save time and give more bang for the buck to tourists, are selling island-hopping packages. These island-hopping packages incorporate a variety of beaches into the tour’s itinerary, with the islands in southern Thailand, near Phuket and Krabi, prominent hubs for these packages.

The availability of different boating experiences, such as kayaking, speed boats, cruises, and more is also making these packages attractive to consumers. Thus, vendors have the opportunity to enhance demand by offering convenient and varied island-hopping packages.

While hotspots like Bangkok, Chiang Mai, and Phuket see a high concentration of tourists, social media influencers are opening people’s eyes to other untapped corners of the country.

Spots like Wat Pa Maha Chedi Kaew, a Buddhist temple constructed by monks from leftover beer bottles, are receiving renewed attention due to social media. Thus, tour operators in Thailand have the opportunity to make use of social media to widen the scope of the tourist sector.

Thailand is associated with Muay Thai. As the number of Muay Thai fights increases, the sport is becoming more accessible to tourists. Muay Thai promoters are also offering schemes like free beers and snacks on the purchase of tickets to tempt more consumers. Thus, Muay Thai getting more recognition is a promising avenue of growth for players in the Thai tourist industry.

Ronak Shah
Ronak Shah

Principal Consultant

Talk to Analyst

Find your sweet spots for generating winning opportunities in this market.

Overview of Restrictive Factors for Tourism in Thailand

Negative connotations associated with trips to Thailand make consumers hesitant about undertaking trips to the country. These negative connotations arise as a result of the presence of hustlers, frauds, thieves, etc. littering the country.

The language barrier also acts as a restraining factor, with a considerable number of small-scale service providers struggling to communicate with outsiders. Tourist companies are concentrating on providing a safe experience to tourists as well as making available online and offline guides to counter these drawbacks.

Comparative View of Adjacent Industries

In addition to the Thailand tourism industry, analysis has been done on two other related industries. The industries by name are the Asia Pacific tourism industry and the United States outbound tourism industry.

Development of countries such as Laos, Sri Lanka, and Bhutan from niche destinations to prime tourist hotspots is encouraging the growth of tourism in the Asia Pacific.

The diverse population of the United States traveling abroad to learn about the places of their ancestors is inducing growth in the United States outbound tourism industry.

Thailand Tourism Industry:

Attributes Thailand Tourism Industry
Value-based CAGR (2024 to 2034) 3.2%
Projected Value (2034) US$ 84,027.30 million
Trends
  • Surge in experiential and adventure tourism
  • Nightlife experiences in Thailand getting more fanciful
Restraint Political instability and security concerns
Growth Factors
  • Affordable travel costs and accommodations
  • Spiritually-focused tours

Asia Pacific Tourism Industry:

Attributes Asia Pacific Tourism Industry
Value-based CAGR (2024 to 2034) 11.6%
Trend Expansion of niche tourism sectors like adventure and eco-tourism
Restraint Concerns over hygiene and non-compatibility of certain Western consumers with Asian food
Growth Factor Increasing connectivity through air travel and infrastructure development

United States Outbound Tourism Industry:

Attributes United States Outbound Tourism Industry
Value-based CAGR (2024 to 2034) 14.2%
Trend Emergence of digital nomad and remote work tourism
Restraint Economic downturns impacting travel budgets
Growth Factor Rise in numbers of individuals looking for medical and wellness tourism

Get the data you need at a Fraction of the cost

Personalize your report by choosing insights you need
and save 40%!

Category-wise Insights

Domestic Travelers Make Up the Overwhelming Number of Tourists in Thailand

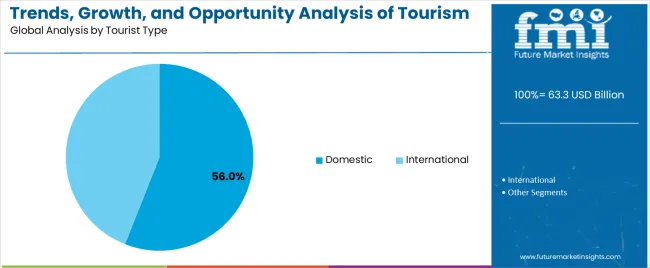
Domestic tourists are anticipated to account for 56.0% of the industry share in 2024. With upgrades in lifestyles observed across the country, more percentage of the Thai population is putting aside time for leisure, which is positively impacting traveling activities in the country. The spiritual bent of a considerable portion of the Thai population also increases tourist activities related to temples.

Foreign tourists represent a significant avenue for growth for industry players. Thailand’s climbing reputation as a party hotspot ensures foreign tourists keep streaming into the country.

Attributes Details
Top Tourist Type Domestic
Industry Share (2024) 56.0%

Online Booking Books the Top Spot in the Booking Channel Segment

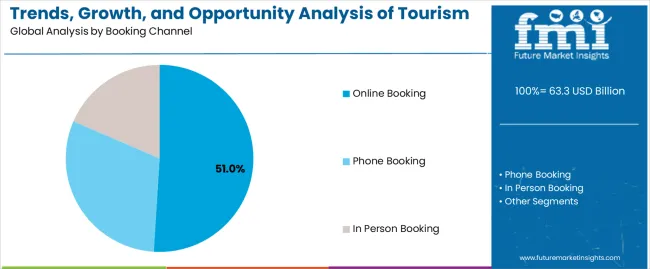
In 2024, online booking is expected to account for 51.0% of the industry share by booking channel. To get ahead of the pack and ensure a seamless tour, consumers are booking online tours.

The determination of tour operators to preview a captivating experience to travelers is also enticing tourists to come to Thailand in increasing measure. Online booking is also helping domestic tourists on brief trips to have a more convenient experience.

Attributes Details
Top Booking Channel Online Booking
Industry Share (2024) 51.0%

Competitive Landscape

Tourist companies in Thailand are undertaking regulatory formalities for foreign tourists to offer a more attractive package to consumers. With individuals from more than 60 nations allowed in Thailand without visas, tour operators are targeting tourists from these countries.

Bangkok Travel Agency is concentrating on providing attractive temple tours, with tours involving the Bangkok nightlife also sprinkled in. Another significant industry player, NS Travels & Tours, has honed in on specific cultural experiences like Thai cuisine cooking classes and history-focused tours.

Recent Developments

  • In January 2024, it was announced by the Department of Tourism that foreign film productions in Thailand would receive a 20% rebate, provided they spend over US$ 4 million. The move was intended to boost tourism, with the full 20% rebate requiring the promotion of Thailand tourism.
  • In November 2023, it was announced that Indian citizens would be granted visa-free entry to Thailand, for a period till May 2024.

Key Coverage in Thailand Tourism Industry Report

  • Tourism in Thailand Industry Analysis
  • Northern Thailand Tourism Growth Assessment
  • Thailand Tourism Packages Demand Report
  • Thailand Travel Industry Report
  • Tourism Industry in Thailand Coverage
  • Thailand Sustainable Tourism Industry Analysis

Scope of the Report

Attribute Details
Forecast Period 2024 to 2034
Historical Data Available for 2019 to 2023
Industry Analysis US$ million for Value
Key Segments Covered Booking Channel, Consumer Orientation, Tour Type, Tourist Type, and Age Group
Key Companies Profiled
  • Bangkok Travel Agency Thailand
  • NS Travels & Tours
  • Elite Holiday & Agency
  • Sun Leisure World
  • Holiday Tours and Travel
  • Bike Tours Thailand
  • Thailand Holiday Group
  • Thai Travel Plus Co. Ltd.
  • TIC Holidays Company Limited
  • Thrilling Thai Tours Ltd.
  • Discover Thailand Co. Ltd.
  • Exodus Travels
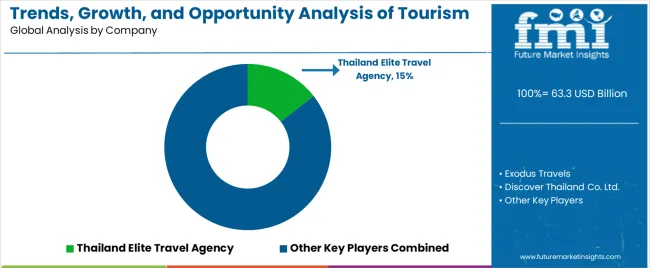
  • Thailand Elite Travel Agency
Report Coverage Growth Forecast, Competition Intelligence, DROT Analysis, Industry Dynamics and Challenges, Strategic Growth Initiatives
Customization & Pricing Available upon Request

Thailand Tourism Industry by Category

By Booking Channel:

  • Phone Booking
  • Online Booking
  • In Person Booking

By Tour Type:

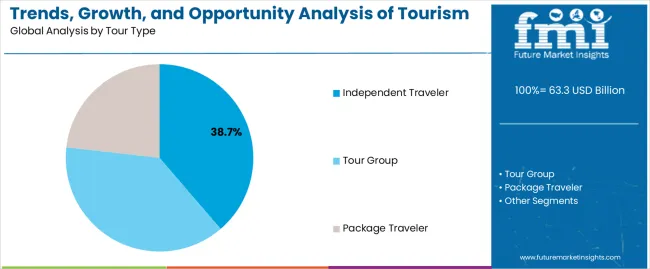
  • Independent Traveler
  • Tour Group
  • Package Traveler

By Tourist Type:

  • Domestic
  • International

By Age Group:

  • 15-25 Years
  • 26-35 Years
  • 36-45 Years
  • 46-55 Years
  • 66-75 Years

By Consumer Orientation:

  • Men
  • Women
  • Children

Frequently Asked Questions

What is the 2024 Tourism Industry Value for Thailand?

Thailand’s tourism industry value is estimated at US$ 61,323.00 million for 2024.

What is the Demand Forecast for Tourism through 2034 in Thailand?

Tourism demand is expected to reach US$ 84,027.30 million by 2034 in Thailand.

What is Thailand’s Future Outlook for Tourism?

Thailand’s tourism industry is expected to record a CAGR of 3.2% over the forecast period.

What are the Opportunities for Tourism in Thailand?

Thailand’s infamous nightlife and island-hopping packages are two of the significant opportunities for tourism industry expansion.

What are the Prominent Companies for Tourism in Thailand?

Bangkok Travel Agency Thailand, NS Travels & Tours, Elite Holiday & Agency, and Sun Leisure World are some of the prominent tourism companies operating in Thailand.

Table of Content

1. Executive Summary

    1.1. Thailand Market Outlook

    1.2. Demand-side Trends

    1.3. Supply-side Trends

    1.4. Technology Roadmap Analysis

    1.5. Analysis and Recommendations

2. Market Overview

    2.1. Market Coverage / Taxonomy

    2.2. Market Definition / Scope / Limitations

3. Market Background

    3.1. Market Dynamics

        3.1.1. Drivers

        3.1.2. Restraints

        3.1.3. Opportunity

        3.1.4. Trends

    3.2. Scenario Forecast

        3.2.1. Demand in Optimistic Scenario

        3.2.2. Demand in Likely Scenario

        3.2.3. Demand in Conservative Scenario

    3.3. Opportunity Map Analysis

    3.4. Investment Feasibility Matrix

    3.5. PESTLE and Porter’s Analysis

    3.6. Regulatory Landscape

        3.6.1. By Key Regions

        3.6.2. By Key Countries

    3.7. Regional Parent Market Outlook

4. Market Analysis 2019 to 2023 and Forecast, 2024 to 2034

    4.1. Historical Market Size Value (US$ Million) Analysis, 2019 to 2023

    4.2. Current and Future Market Size Value (US$ Million) Projections, 2024 to 2034

        4.2.1. Y-o-Y Growth Trend Analysis

        4.2.2. Absolute $ Opportunity Analysis

5. Market Analysis 2019 to 2023 and Forecast 2024 to 2034, By Booking Channel

    5.1. Introduction / Key Findings

    5.2. Historical Market Size Value (US$ Million) Analysis By Booking Channel, 2019 to 2023

    5.3. Current and Future Market Size Value (US$ Million) Analysis and Forecast By Booking Channel, 2024 to 2034

        5.3.1. Phone Booking

        5.3.2. Online Booking

        5.3.3. In-Person Booking

    5.4. Y-o-Y Growth Trend Analysis By Booking Channel, 2019 to 2023

    5.5. Absolute $ Opportunity Analysis By Booking Channel, 2024 to 2034

6. Market Analysis 2019 to 2023 and Forecast 2024 to 2034, By Consumer Orientation

    6.1. Introduction / Key Findings

    6.2. Historical Market Size Value (US$ Million) Analysis By Consumer Orientation, 2019 to 2023

    6.3. Current and Future Market Size Value (US$ Million) Analysis and Forecast By Consumer Orientation, 2024 to 2034

        6.3.1. Men

        6.3.2. Women

        6.3.3. Children

    6.4. Y-o-Y Growth Trend Analysis By Consumer Orientation, 2019 to 2023

    6.5. Absolute $ Opportunity Analysis By Consumer Orientation, 2024 to 2034

7. Market Analysis 2019 to 2023 and Forecast 2024 to 2034, By Age group

    7.1. Introduction / Key Findings

    7.2. Historical Market Size Value (US$ Million) Analysis By Age group, 2019 to 2023

    7.3. Current and Future Market Size Value (US$ Million) Analysis and Forecast By Age group, 2024 to 2034

        7.3.1. 15-25 years

        7.3.2. 26-35 years

        7.3.3. 36-45 years

        7.3.4. 46-55 years

        7.3.5. 56-65 years

        7.3.6. 66-75 years

    7.4. Y-o-Y Growth Trend Analysis By Age group, 2019 to 2023

    7.5. Absolute $ Opportunity Analysis By Age group, 2024 to 2034

8. Market Analysis 2019 to 2023 and Forecast 2024 to 2034, By Tour type

    8.1. Introduction / Key Findings

    8.2. Historical Market Size Value (US$ Million) Analysis By Tour type, 2019 to 2023

    8.3. Current and Future Market Size Value (US$ Million) Analysis and Forecast By Tour type, 2024 to 2034

        8.3.1. Independent traveller

        8.3.2. Tour Group

        8.3.3. Package Traveller

    8.4. Y-o-Y Growth Trend Analysis By Tour type, 2019 to 2023

    8.5. Absolute $ Opportunity Analysis By Tour type, 2024 to 2034

9. Market Analysis 2019 to 2023 and Forecast 2024 to 2034, By Tourist Type

    9.1. Introduction / Key Findings

    9.2. Historical Market Size Value (US$ Million) Analysis By Tourist Type, 2019 to 2023

    9.3. Current and Future Market Size Value (US$ Million) Analysis and Forecast By Tourist Type, 2024 to 2034

        9.3.1. Domestic Tourist

        9.3.2. International Tourist

    9.4. Y-o-Y Growth Trend Analysis By Tourist Type, 2019 to 2023

    9.5. Absolute $ Opportunity Analysis By Tourist Type, 2024 to 2034

10. Market Analysis 2019 to 2023 and Forecast 2024 to 2034, By Region

    10.1. Introduction

    10.2. Historical Market Size Value (US$ Million) Analysis By Region, 2019 to 2023

    10.3. Current Market Size Value (US$ Million) Analysis and Forecast By Region, 2024 to 2034

        10.3.1. Northern Thailand

        10.3.2. Northeastern Thailand

        10.3.3. Western Thailand

        10.3.4. Central Thailand

        10.3.5. Eastern Thailand

        10.3.6. Southern Thailand

    10.4. Market Attractiveness Analysis By Region

11. Northern Market Analysis 2019 to 2023 and Forecast 2024 to 2034

    11.1. Historical Market Size Value (US$ Million) Trend Analysis By Market Taxonomy, 2019 to 2023

    11.2. Market Size Value (US$ Million) Forecast By Market Taxonomy, 2024 to 2034

        11.2.1. By Booking Channel

        11.2.2. By Consumer Orientation

        11.2.3. By Age group

        11.2.4. By Tour type

        11.2.5. By Tourist Type

    11.3. Market Attractiveness Analysis

        11.3.1. By Booking Channel

        11.3.2. By Consumer Orientation

        11.3.3. By Age group

        11.3.4. By Tour type

        11.3.5. By Tourist Type

    11.4. Key Takeaways

12. Northeastern Market Analysis 2019 to 2023 and Forecast 2024 to 2034

    12.1. Historical Market Size Value (US$ Million) Trend Analysis By Market Taxonomy, 2019 to 2023

    12.2. Market Size Value (US$ Million) Forecast By Market Taxonomy, 2024 to 2034

        12.2.1. By Booking Channel

        12.2.2. By Consumer Orientation

        12.2.3. By Age group

        12.2.4. By Tour type

        12.2.5. By Tourist Type

    12.3. Market Attractiveness Analysis

        12.3.1. By Booking Channel

        12.3.2. By Consumer Orientation

        12.3.3. By Age group

        12.3.4. By Tour type

        12.3.5. By Tourist Type

    12.4. Key Takeaways

13. Western Market Analysis 2019 to 2023 and Forecast 2024 to 2034

    13.1. Historical Market Size Value (US$ Million) Trend Analysis By Market Taxonomy, 2019 to 2023

    13.2. Market Size Value (US$ Million) Forecast By Market Taxonomy, 2024 to 2034

        13.2.1. By Booking Channel

        13.2.2. By Consumer Orientation

        13.2.3. By Age group

        13.2.4. By Tour type

        13.2.5. By Tourist Type

    13.3. Market Attractiveness Analysis

        13.3.1. By Booking Channel

        13.3.2. By Consumer Orientation

        13.3.3. By Age group

        13.3.4. By Tour type

        13.3.5. By Tourist Type

    13.4. Key Takeaways

14. Central Market Analysis 2019 to 2023 and Forecast 2024 to 2034

    14.1. Historical Market Size Value (US$ Million) Trend Analysis By Market Taxonomy, 2019 to 2023

    14.2. Market Size Value (US$ Million) Forecast By Market Taxonomy, 2024 to 2034

        14.2.1. By Booking Channel

        14.2.2. By Consumer Orientation

        14.2.3. By Age group

        14.2.4. By Tour type

        14.2.5. By Tourist Type

    14.3. Market Attractiveness Analysis

        14.3.1. By Booking Channel

        14.3.2. By Consumer Orientation

        14.3.3. By Age group

        14.3.4. By Tour type

        14.3.5. By Tourist Type

    14.4. Key Takeaways

15. Eastern Market Analysis 2019 to 2023 and Forecast 2024 to 2034

    15.1. Historical Market Size Value (US$ Million) Trend Analysis By Market Taxonomy, 2019 to 2023

    15.2. Market Size Value (US$ Million) Forecast By Market Taxonomy, 2024 to 2034

        15.2.1. By Booking Channel

        15.2.2. By Consumer Orientation

        15.2.3. By Age group

        15.2.4. By Tour type

        15.2.5. By Tourist Type

    15.3. Market Attractiveness Analysis

        15.3.1. By Booking Channel

        15.3.2. By Consumer Orientation

        15.3.3. By Age group

        15.3.4. By Tour type

        15.3.5. By Tourist Type

    15.4. Key Takeaways

16. Southern Market Analysis 2019 to 2023 and Forecast 2024 to 2034

    16.1. Historical Market Size Value (US$ Million) Trend Analysis By Market Taxonomy, 2019 to 2023

    16.2. Market Size Value (US$ Million) Forecast By Market Taxonomy, 2024 to 2034

        16.2.1. By Booking Channel

        16.2.2. By Consumer Orientation

        16.2.3. By Age group

        16.2.4. By Tour type

        16.2.5. By Tourist Type

    16.3. Market Attractiveness Analysis

        16.3.1. By Booking Channel

        16.3.2. By Consumer Orientation

        16.3.3. By Age group

        16.3.4. By Tour type

        16.3.5. By Tourist Type

    16.4. Key Takeaways

17. Market Structure Analysis

    17.1. Competition Dashboard

    17.2. Competition Benchmarking

    17.3. Market Share Analysis of Top Players

        17.3.1. By Regional

        17.3.2. By Booking Channel

        17.3.3. By Consumer Orientation

        17.3.4. By Age group

        17.3.5. By Tour type

        17.3.6. By Tourist Type

18. Competition Analysis

    18.1. Competition Deep Dive

        18.1.1. Bangkok Travel Agency Thailand

            18.1.1.1. Overview

            18.1.1.2. Product Portfolio

            18.1.1.3. Profitability by Market Segments

            18.1.1.4. Sales Footprint

            18.1.1.5. Strategy Overview

                18.1.1.5.1. Marketing Strategy

        18.1.2. NS Travels & Tours

            18.1.2.1. Overview

            18.1.2.2. Product Portfolio

            18.1.2.3. Profitability by Market Segments

            18.1.2.4. Sales Footprint

            18.1.2.5. Strategy Overview

                18.1.2.5.1. Marketing Strategy

        18.1.3. Elite Holiday & Agency

            18.1.3.1. Overview

            18.1.3.2. Product Portfolio

            18.1.3.3. Profitability by Market Segments

            18.1.3.4. Sales Footprint

            18.1.3.5. Strategy Overview

                18.1.3.5.1. Marketing Strategy

        18.1.4. Sun Leisure World

            18.1.4.1. Overview

            18.1.4.2. Product Portfolio

            18.1.4.3. Profitability by Market Segments

            18.1.4.4. Sales Footprint

            18.1.4.5. Strategy Overview

                18.1.4.5.1. Marketing Strategy

        18.1.5. Holiday Tours and Travel

            18.1.5.1. Overview

            18.1.5.2. Product Portfolio

            18.1.5.3. Profitability by Market Segments

            18.1.5.4. Sales Footprint

            18.1.5.5. Strategy Overview

                18.1.5.5.1. Marketing Strategy

        18.1.6. Bike Tours Thailand

            18.1.6.1. Overview

            18.1.6.2. Product Portfolio

            18.1.6.3. Profitability by Market Segments

            18.1.6.4. Sales Footprint

            18.1.6.5. Strategy Overview

                18.1.6.5.1. Marketing Strategy

        18.1.7. Thailand Holiday Group

            18.1.7.1. Overview

            18.1.7.2. Product Portfolio

            18.1.7.3. Profitability by Market Segments

            18.1.7.4. Sales Footprint

            18.1.7.5. Strategy Overview

                18.1.7.5.1. Marketing Strategy

        18.1.8. Thai Travel Plus Co. Ltd.

            18.1.8.1. Overview

            18.1.8.2. Product Portfolio

            18.1.8.3. Profitability by Market Segments

            18.1.8.4. Sales Footprint

            18.1.8.5. Strategy Overview

                18.1.8.5.1. Marketing Strategy

        18.1.9. TIC Holidays Company Limited

            18.1.9.1. Overview

            18.1.9.2. Product Portfolio

            18.1.9.3. Profitability by Market Segments

            18.1.9.4. Sales Footprint

            18.1.9.5. Strategy Overview

                18.1.9.5.1. Marketing Strategy

        18.1.10. Thrilling Thai tours ltd.

            18.1.10.1. Overview

            18.1.10.2. Product Portfolio

            18.1.10.3. Profitability by Market Segments

            18.1.10.4. Sales Footprint

            18.1.10.5. Strategy Overview

                18.1.10.5.1. Marketing Strategy

        18.1.11. Discover Thailand Co. Ltd.

            18.1.11.1. Overview

            18.1.11.2. Product Portfolio

            18.1.11.3. Profitability by Market Segments

            18.1.11.4. Sales Footprint

            18.1.11.5. Strategy Overview

                18.1.11.5.1. Marketing Strategy

19. Assumptions & Acronyms Used

20. Research Methodology

Don't pay for what you don't need

Customize your report by selecting specific countries or regions and save 30%!

List of Tables

Table 1: Market Value (US$ Million) Forecast by Region, 2019 to 2034

Table 2: Market Value (US$ Million) Forecast by Booking Channel, 2019 to 2034

Table 3: Market Value (US$ Million) Forecast by Consumer Orientation, 2019 to 2034

Table 4: Market Value (US$ Million) Forecast by Age group, 2019 to 2034

Table 5: Market Value (US$ Million) Forecast by Tour type, 2019 to 2034

Table 6: Market Value (US$ Million) Forecast by Tourist Type, 2019 to 2034

Table 7: Northern Market Value (US$ Million) Forecast by Booking Channel, 2019 to 2034

Table 8: Northern Market Value (US$ Million) Forecast by Consumer Orientation, 2019 to 2034

Table 9: Northern Market Value (US$ Million) Forecast by Age group, 2019 to 2034

Table 10: Northern Market Value (US$ Million) Forecast by Tour type, 2019 to 2034

Table 11: Northern Market Value (US$ Million) Forecast by Tourist Type, 2019 to 2034

Table 12: Northeastern Market Value (US$ Million) Forecast by Booking Channel, 2019 to 2034

Table 13: Northeastern Market Value (US$ Million) Forecast by Consumer Orientation, 2019 to 2034

Table 14: Northeastern Market Value (US$ Million) Forecast by Age group, 2019 to 2034

Table 15: Northeastern Market Value (US$ Million) Forecast by Tour type, 2019 to 2034

Table 16: Northeastern Market Value (US$ Million) Forecast by Tourist Type, 2019 to 2034

Table 17: Western Market Value (US$ Million) Forecast by Booking Channel, 2019 to 2034

Table 18: Western Market Value (US$ Million) Forecast by Consumer Orientation, 2019 to 2034

Table 19: Western Market Value (US$ Million) Forecast by Age group, 2019 to 2034

Table 20: Western Market Value (US$ Million) Forecast by Tour type, 2019 to 2034

Table 21: Western Market Value (US$ Million) Forecast by Tourist Type, 2019 to 2034

Table 22: Central Market Value (US$ Million) Forecast by Booking Channel, 2019 to 2034

Table 23: Central Market Value (US$ Million) Forecast by Consumer Orientation, 2019 to 2034

Table 24: Central Market Value (US$ Million) Forecast by Age group, 2019 to 2034

Table 25: Central Market Value (US$ Million) Forecast by Tour type, 2019 to 2034

Table 26: Central Market Value (US$ Million) Forecast by Tourist Type, 2019 to 2034

Table 27: Eastern Market Value (US$ Million) Forecast by Booking Channel, 2019 to 2034

Table 28: Eastern Market Value (US$ Million) Forecast by Consumer Orientation, 2019 to 2034

Table 29: Eastern Market Value (US$ Million) Forecast by Age group, 2019 to 2034

Table 30: Eastern Market Value (US$ Million) Forecast by Tour type, 2019 to 2034

Table 31: Eastern Market Value (US$ Million) Forecast by Tourist Type, 2019 to 2034

Table 32: Southern Market Value (US$ Million) Forecast by Booking Channel, 2019 to 2034

Table 33: Southern Market Value (US$ Million) Forecast by Consumer Orientation, 2019 to 2034

Table 34: Southern Market Value (US$ Million) Forecast by Age group, 2019 to 2034

Table 35: Southern Market Value (US$ Million) Forecast by Tour type, 2019 to 2034

Table 36: Southern Market Value (US$ Million) Forecast by Tourist Type, 2019 to 2034
Ronak Shah
Ronak Shah

Principal Consultant

Talk to Analyst

Find your sweet spots for generating winning opportunities in this market.

List of Charts

Figure 1: Market Value (US$ Million) by Booking Channel, 2024 to 2034

Figure 2: Market Value (US$ Million) by Consumer Orientation, 2024 to 2034

Figure 3: Market Value (US$ Million) by Age group, 2024 to 2034

Figure 4: Market Value (US$ Million) by Tour type, 2024 to 2034

Figure 5: Market Value (US$ Million) by Tourist Type, 2024 to 2034

Figure 6: Market Value (US$ Million) by Region, 2024 to 2034

Figure 7: Market Value (US$ Million) Analysis by Region, 2019 to 2034

Figure 8: Market Value Share (%) and BPS Analysis by Region, 2024 to 2034

Figure 9: Market Y-o-Y Growth (%) Projections by Region, 2024 to 2034

Figure 10: Market Value (US$ Million) Analysis by Booking Channel, 2019 to 2034

Figure 11: Market Value Share (%) and BPS Analysis by Booking Channel, 2024 to 2034

Figure 12: Market Y-o-Y Growth (%) Projections by Booking Channel, 2024 to 2034

Figure 13: Market Value (US$ Million) Analysis by Consumer Orientation, 2019 to 2034

Figure 14: Market Value Share (%) and BPS Analysis by Consumer Orientation, 2024 to 2034

Figure 15: Market Y-o-Y Growth (%) Projections by Consumer Orientation, 2024 to 2034

Figure 16: Market Value (US$ Million) Analysis by Age group, 2019 to 2034

Figure 17: Market Value Share (%) and BPS Analysis by Age group, 2024 to 2034

Figure 18: Market Y-o-Y Growth (%) Projections by Age group, 2024 to 2034

Figure 19: Market Value (US$ Million) Analysis by Tour type, 2019 to 2034

Figure 20: Market Value Share (%) and BPS Analysis by Tour type, 2024 to 2034

Figure 21: Market Y-o-Y Growth (%) Projections by Tour type, 2024 to 2034

Figure 22: Market Value (US$ Million) Analysis by Tourist Type, 2019 to 2034

Figure 23: Market Value Share (%) and BPS Analysis by Tourist Type, 2024 to 2034

Figure 24: Market Y-o-Y Growth (%) Projections by Tourist Type, 2024 to 2034

Figure 25: Market Attractiveness by Booking Channel, 2024 to 2034

Figure 26: Market Attractiveness by Consumer Orientation, 2024 to 2034

Figure 27: Market Attractiveness by Age group, 2024 to 2034

Figure 28: Market Attractiveness by Tour type, 2024 to 2034

Figure 29: Market Attractiveness by Tourist Type, 2024 to 2034

Figure 30: Market Attractiveness by Region, 2024 to 2034

Figure 31: Northern Market Value (US$ Million) by Booking Channel, 2024 to 2034

Figure 32: Northern Market Value (US$ Million) by Consumer Orientation, 2024 to 2034

Figure 33: Northern Market Value (US$ Million) by Age group, 2024 to 2034

Figure 34: Northern Market Value (US$ Million) by Tour type, 2024 to 2034

Figure 35: Northern Market Value (US$ Million) by Tourist Type, 2024 to 2034

Figure 36: Northern Market Value (US$ Million) Analysis by Booking Channel, 2019 to 2034

Figure 37: Northern Market Value Share (%) and BPS Analysis by Booking Channel, 2024 to 2034

Figure 38: Northern Market Y-o-Y Growth (%) Projections by Booking Channel, 2024 to 2034

Figure 39: Northern Market Value (US$ Million) Analysis by Consumer Orientation, 2019 to 2034

Figure 40: Northern Market Value Share (%) and BPS Analysis by Consumer Orientation, 2024 to 2034

Figure 41: Northern Market Y-o-Y Growth (%) Projections by Consumer Orientation, 2024 to 2034

Figure 42: Northern Market Value (US$ Million) Analysis by Age group, 2019 to 2034

Figure 43: Northern Market Value Share (%) and BPS Analysis by Age group, 2024 to 2034

Figure 44: Northern Market Y-o-Y Growth (%) Projections by Age group, 2024 to 2034

Figure 45: Northern Market Value (US$ Million) Analysis by Tour type, 2019 to 2034

Figure 46: Northern Market Value Share (%) and BPS Analysis by Tour type, 2024 to 2034

Figure 47: Northern Market Y-o-Y Growth (%) Projections by Tour type, 2024 to 2034

Figure 48: Northern Market Value (US$ Million) Analysis by Tourist Type, 2019 to 2034

Figure 49: Northern Market Value Share (%) and BPS Analysis by Tourist Type, 2024 to 2034

Figure 50: Northern Market Y-o-Y Growth (%) Projections by Tourist Type, 2024 to 2034

Figure 51: Northern Market Attractiveness by Booking Channel, 2024 to 2034

Figure 52: Northern Market Attractiveness by Consumer Orientation, 2024 to 2034

Figure 53: Northern Market Attractiveness by Age group, 2024 to 2034

Figure 54: Northern Market Attractiveness by Tour type, 2024 to 2034

Figure 55: Northern Market Attractiveness by Tourist Type, 2024 to 2034

Figure 56: Northeastern Market Value (US$ Million) by Booking Channel, 2024 to 2034

Figure 57: Northeastern Market Value (US$ Million) by Consumer Orientation, 2024 to 2034

Figure 58: Northeastern Market Value (US$ Million) by Age group, 2024 to 2034

Figure 59: Northeastern Market Value (US$ Million) by Tour type, 2024 to 2034

Figure 60: Northeastern Market Value (US$ Million) by Tourist Type, 2024 to 2034

Figure 61: Northeastern Market Value (US$ Million) Analysis by Booking Channel, 2019 to 2034

Figure 62: Northeastern Market Value Share (%) and BPS Analysis by Booking Channel, 2024 to 2034

Figure 63: Northeastern Market Y-o-Y Growth (%) Projections by Booking Channel, 2024 to 2034

Figure 64: Northeastern Market Value (US$ Million) Analysis by Consumer Orientation, 2019 to 2034

Figure 65: Northeastern Market Value Share (%) and BPS Analysis by Consumer Orientation, 2024 to 2034

Figure 66: Northeastern Market Y-o-Y Growth (%) Projections by Consumer Orientation, 2024 to 2034

Figure 67: Northeastern Market Value (US$ Million) Analysis by Age group, 2019 to 2034

Figure 68: Northeastern Market Value Share (%) and BPS Analysis by Age group, 2024 to 2034

Figure 69: Northeastern Market Y-o-Y Growth (%) Projections by Age group, 2024 to 2034

Figure 70: Northeastern Market Value (US$ Million) Analysis by Tour type, 2019 to 2034

Figure 71: Northeastern Market Value Share (%) and BPS Analysis by Tour type, 2024 to 2034

Figure 72: Northeastern Market Y-o-Y Growth (%) Projections by Tour type, 2024 to 2034

Figure 73: Northeastern Market Value (US$ Million) Analysis by Tourist Type, 2019 to 2034

Figure 74: Northeastern Market Value Share (%) and BPS Analysis by Tourist Type, 2024 to 2034

Figure 75: Northeastern Market Y-o-Y Growth (%) Projections by Tourist Type, 2024 to 2034

Figure 76: Northeastern Market Attractiveness by Booking Channel, 2024 to 2034

Figure 77: Northeastern Market Attractiveness by Consumer Orientation, 2024 to 2034

Figure 78: Northeastern Market Attractiveness by Age group, 2024 to 2034

Figure 79: Northeastern Market Attractiveness by Tour type, 2024 to 2034

Figure 80: Northeastern Market Attractiveness by Tourist Type, 2024 to 2034

Figure 81: Western Market Value (US$ Million) by Booking Channel, 2024 to 2034

Figure 82: Western Market Value (US$ Million) by Consumer Orientation, 2024 to 2034

Figure 83: Western Market Value (US$ Million) by Age group, 2024 to 2034

Figure 84: Western Market Value (US$ Million) by Tour type, 2024 to 2034

Figure 85: Western Market Value (US$ Million) by Tourist Type, 2024 to 2034

Figure 86: Western Market Value (US$ Million) Analysis by Booking Channel, 2019 to 2034

Figure 87: Western Market Value Share (%) and BPS Analysis by Booking Channel, 2024 to 2034

Figure 88: Western Market Y-o-Y Growth (%) Projections by Booking Channel, 2024 to 2034

Figure 89: Western Market Value (US$ Million) Analysis by Consumer Orientation, 2019 to 2034

Figure 90: Western Market Value Share (%) and BPS Analysis by Consumer Orientation, 2024 to 2034

Figure 91: Western Market Y-o-Y Growth (%) Projections by Consumer Orientation, 2024 to 2034

Figure 92: Western Market Value (US$ Million) Analysis by Age group, 2019 to 2034

Figure 93: Western Market Value Share (%) and BPS Analysis by Age group, 2024 to 2034

Figure 94: Western Market Y-o-Y Growth (%) Projections by Age group, 2024 to 2034

Figure 95: Western Market Value (US$ Million) Analysis by Tour type, 2019 to 2034

Figure 96: Western Market Value Share (%) and BPS Analysis by Tour type, 2024 to 2034

Figure 97: Western Market Y-o-Y Growth (%) Projections by Tour type, 2024 to 2034

Figure 98: Western Market Value (US$ Million) Analysis by Tourist Type, 2019 to 2034

Figure 99: Western Market Value Share (%) and BPS Analysis by Tourist Type, 2024 to 2034

Figure 100: Western Market Y-o-Y Growth (%) Projections by Tourist Type, 2024 to 2034

Figure 101: Western Market Attractiveness by Booking Channel, 2024 to 2034

Figure 102: Western Market Attractiveness by Consumer Orientation, 2024 to 2034

Figure 103: Western Market Attractiveness by Age group, 2024 to 2034

Figure 104: Western Market Attractiveness by Tour type, 2024 to 2034

Figure 105: Western Market Attractiveness by Tourist Type, 2024 to 2034

Figure 106: Central Market Value (US$ Million) by Booking Channel, 2024 to 2034

Figure 107: Central Market Value (US$ Million) by Consumer Orientation, 2024 to 2034

Figure 108: Central Market Value (US$ Million) by Age group, 2024 to 2034

Figure 109: Central Market Value (US$ Million) by Tour type, 2024 to 2034

Figure 110: Central Market Value (US$ Million) by Tourist Type, 2024 to 2034

Figure 111: Central Market Value (US$ Million) Analysis by Booking Channel, 2019 to 2034

Figure 112: Central Market Value Share (%) and BPS Analysis by Booking Channel, 2024 to 2034

Figure 113: Central Market Y-o-Y Growth (%) Projections by Booking Channel, 2024 to 2034

Figure 114: Central Market Value (US$ Million) Analysis by Consumer Orientation, 2019 to 2034

Figure 115: Central Market Value Share (%) and BPS Analysis by Consumer Orientation, 2024 to 2034

Figure 116: Central Market Y-o-Y Growth (%) Projections by Consumer Orientation, 2024 to 2034

Figure 117: Central Market Value (US$ Million) Analysis by Age group, 2019 to 2034

Figure 118: Central Market Value Share (%) and BPS Analysis by Age group, 2024 to 2034

Figure 119: Central Market Y-o-Y Growth (%) Projections by Age group, 2024 to 2034

Figure 120: Central Market Value (US$ Million) Analysis by Tour type, 2019 to 2034

Figure 121: Central Market Value Share (%) and BPS Analysis by Tour type, 2024 to 2034

Figure 122: Central Market Y-o-Y Growth (%) Projections by Tour type, 2024 to 2034

Figure 123: Central Market Value (US$ Million) Analysis by Tourist Type, 2019 to 2034

Figure 124: Central Market Value Share (%) and BPS Analysis by Tourist Type, 2024 to 2034

Figure 125: Central Market Y-o-Y Growth (%) Projections by Tourist Type, 2024 to 2034

Figure 126: Central Market Attractiveness by Booking Channel, 2024 to 2034

Figure 127: Central Market Attractiveness by Consumer Orientation, 2024 to 2034

Figure 128: Central Market Attractiveness by Age group, 2024 to 2034

Figure 129: Central Market Attractiveness by Tour type, 2024 to 2034

Figure 130: Central Market Attractiveness by Tourist Type, 2024 to 2034

Figure 131: Eastern Market Value (US$ Million) by Booking Channel, 2024 to 2034

Figure 132: Eastern Market Value (US$ Million) by Consumer Orientation, 2024 to 2034

Figure 133: Eastern Market Value (US$ Million) by Age group, 2024 to 2034

Figure 134: Eastern Market Value (US$ Million) by Tour type, 2024 to 2034

Figure 135: Eastern Market Value (US$ Million) by Tourist Type, 2024 to 2034

Figure 136: Eastern Market Value (US$ Million) Analysis by Booking Channel, 2019 to 2034

Figure 137: Eastern Market Value Share (%) and BPS Analysis by Booking Channel, 2024 to 2034

Figure 138: Eastern Market Y-o-Y Growth (%) Projections by Booking Channel, 2024 to 2034

Figure 139: Eastern Market Value (US$ Million) Analysis by Consumer Orientation, 2019 to 2034

Figure 140: Eastern Market Value Share (%) and BPS Analysis by Consumer Orientation, 2024 to 2034

Figure 141: Eastern Market Y-o-Y Growth (%) Projections by Consumer Orientation, 2024 to 2034

Figure 142: Eastern Market Value (US$ Million) Analysis by Age group, 2019 to 2034

Figure 143: Eastern Market Value Share (%) and BPS Analysis by Age group, 2024 to 2034

Figure 144: Eastern Market Y-o-Y Growth (%) Projections by Age group, 2024 to 2034

Figure 145: Eastern Market Value (US$ Million) Analysis by Tour type, 2019 to 2034

Figure 146: Eastern Market Value Share (%) and BPS Analysis by Tour type, 2024 to 2034

Figure 147: Eastern Market Y-o-Y Growth (%) Projections by Tour type, 2024 to 2034

Figure 148: Eastern Market Value (US$ Million) Analysis by Tourist Type, 2019 to 2034

Figure 149: Eastern Market Value Share (%) and BPS Analysis by Tourist Type, 2024 to 2034

Figure 150: Eastern Market Y-o-Y Growth (%) Projections by Tourist Type, 2024 to 2034

Figure 151: Eastern Market Attractiveness by Booking Channel, 2024 to 2034

Figure 152: Eastern Market Attractiveness by Consumer Orientation, 2024 to 2034

Figure 153: Eastern Market Attractiveness by Age group, 2024 to 2034

Figure 154: Eastern Market Attractiveness by Tour type, 2024 to 2034

Figure 155: Eastern Market Attractiveness by Tourist Type, 2024 to 2034

Figure 156: Southern Market Value (US$ Million) by Booking Channel, 2024 to 2034

Figure 157: Southern Market Value (US$ Million) by Consumer Orientation, 2024 to 2034

Figure 158: Southern Market Value (US$ Million) by Age group, 2024 to 2034

Figure 159: Southern Market Value (US$ Million) by Tour type, 2024 to 2034

Figure 160: Southern Market Value (US$ Million) by Tourist Type, 2024 to 2034

Figure 161: Southern Market Value (US$ Million) Analysis by Booking Channel, 2019 to 2034

Figure 162: Southern Market Value Share (%) and BPS Analysis by Booking Channel, 2024 to 2034

Figure 163: Southern Market Y-o-Y Growth (%) Projections by Booking Channel, 2024 to 2034

Figure 164: Southern Market Value (US$ Million) Analysis by Consumer Orientation, 2019 to 2034

Figure 165: Southern Market Value Share (%) and BPS Analysis by Consumer Orientation, 2024 to 2034

Figure 166: Southern Market Y-o-Y Growth (%) Projections by Consumer Orientation, 2024 to 2034

Figure 167: Southern Market Value (US$ Million) Analysis by Age group, 2019 to 2034

Figure 168: Southern Market Value Share (%) and BPS Analysis by Age group, 2024 to 2034

Figure 169: Southern Market Y-o-Y Growth (%) Projections by Age group, 2024 to 2034

Figure 170: Southern Market Value (US$ Million) Analysis by Tour type, 2019 to 2034

Figure 171: Southern Market Value Share (%) and BPS Analysis by Tour type, 2024 to 2034

Figure 172: Southern Market Y-o-Y Growth (%) Projections by Tour type, 2024 to 2034

Figure 173: Southern Market Value (US$ Million) Analysis by Tourist Type, 2019 to 2034

Figure 174: Southern Market Value Share (%) and BPS Analysis by Tourist Type, 2024 to 2034

Figure 175: Southern Market Y-o-Y Growth (%) Projections by Tourist Type, 2024 to 2034

Figure 176: Southern Market Attractiveness by Booking Channel, 2024 to 2034

Figure 177: Southern Market Attractiveness by Consumer Orientation, 2024 to 2034

Figure 178: Southern Market Attractiveness by Age group, 2024 to 2034

Figure 179: Southern Market Attractiveness by Tour type, 2024 to 2034

Figure 180: Southern Market Attractiveness by Tourist Type, 2024 to 2034

Recommendations

Travel and Tourism

Asia-Pacific Tourism Market

Published : February 2023

Travel and Tourism

Thailand Culinary Tourism Market

Published : July 2022

Explore Travel and Tourism Insights

View Reports

Trends, Growth, and Opportunity Analysis of Tourism in Thailand Tourist Type for 2024 to 2034