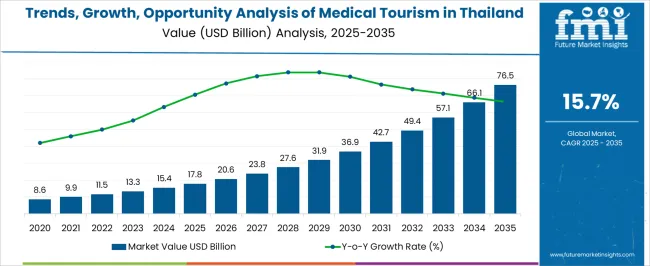
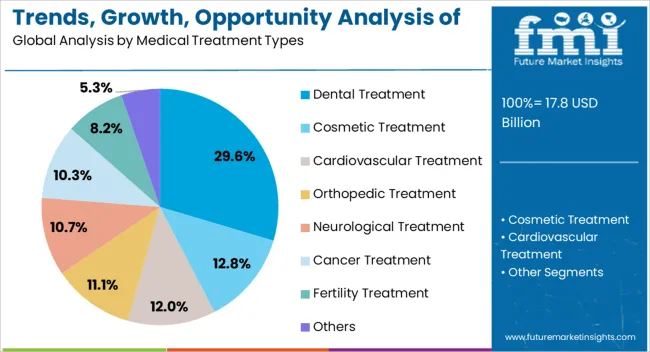
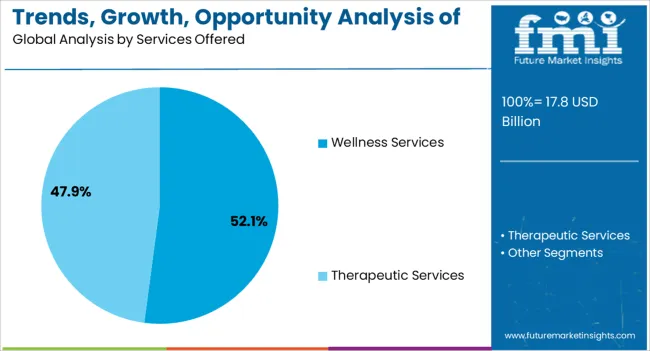
In the updated research report, FMI analyzed the demand for medical tourism in Thailand to be USD 15,378.00 million in 2024. Factors like high standards for medical care, reasonable fees, quality treatments, and affordable cost of living for long-stayers make Thailand a popular choice for medical tourists.
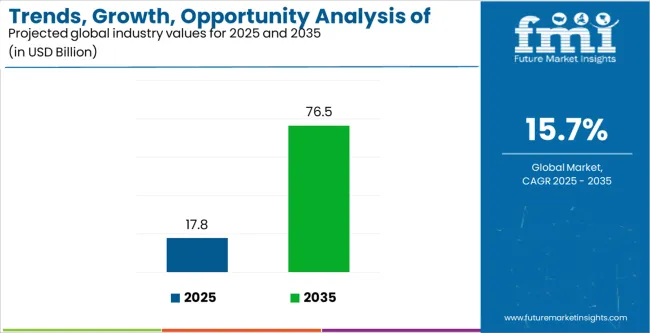
With favorable medical visa and constant government support, key players can anticipate sales from medical tourism in Thailand to exceed USD 66,104.90 million figure by 2034.
Attributes | Key Insights |
---|---|
Thailand Medical Tourism Industry Size (2024E) | USD 15,378.00 million |
Industry Valuation (2034F) | USD 66,104.90 million |
Value-based CAGR (2024 to 2034) | 15.7% |
Leading Tourist Type | International |
---|---|
Value Share (2024) | 63.0% |
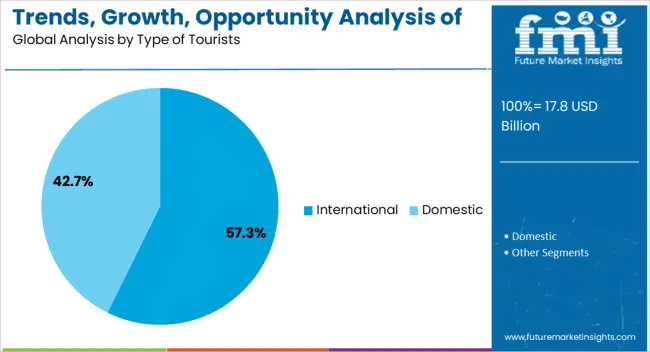
International tourists account for 63% value share in 2024. International travelers are flocking to Thailand to enjoy affordable treatment options. Visiting medical tourists from developed countries also benefit from the favorable currency exchange rates.
Medical tourists are also choosing Thailand for its exceptional hospitality services. The climate of Thailand offers a relaxing stay after a surgical procedure. The top-notch facilities and highly qualified experts in Thailand make it a popular choice among international tourists, thus influencing the adoption trends
Leading Age Group Segment | 46-55 Years |
---|---|
Value Share (2024) | 62.0% |
Geriatric popular are susceptible to various diseases, chronic pain, or illnesses. This population base is more likely to pursue medical treatments for their illnesses, diseases, or joint problems. In case, the treatment costs in their homeland are out of their pocket, people prefer to travel abroad to get treated.
Key players can work on branding the medical tourism of Thailand in the global industry by highlighting the expertise of Thailand’ healthcare industry in certain treatments. Other than that, competitors are using soft power to induce interest among foreigners to visit Thailand for affordable and high-quality medical treatments.
Principal players are forming alliances with players in different business sectors like hotels, airlines, rehabilitation centers, insurance companies, spas, and tour operators, to provide comprehensive medical tourism packages to their customers. A key benefit of this strategy is that players can reach more tourists by promoting their value-for-money packages.
The healthcare sector in Thailand is constantly upgrading its service quality and advancing its treatment procedures to maintain its position in the global industry. Players can emphasize this aspect while selling packages.
Another such progress is the use of HealthTech in the medical center, as it leads to convenience and efficiency in providing medical services. This aspect of the medical sector in Thailand is acting as a selling point for industry participants.
News Coverage
Table 1: Market Value (US$ Million) Forecast by Region, 2019 to 2034
Table 2: Market Value (US$ Million) Forecast by Treatment Type, 2019 to 2034
Table 3: Market Value (US$ Million) Forecast by Services, 2019 to 2034
Table 4: Market Value (US$ Million) Forecast by Tourist Type, 2019 to 2034
Table 5: Market Value (US$ Million) Forecast by Tour Type, 2019 to 2034
Table 6: Market Value (US$ Million) Forecast by Consumer Orientation, 2019 to 2034
Table 7: Market Value (US$ Million) Forecast by Age Group, 2019 to 2034
Table 8: Market Value (US$ Million) Forecast by Booking Channel, 2019 to 2034
Table 9: Northern Market Value (US$ Million) Forecast by Treatment Type, 2019 to 2034
Table 10: Northern Market Value (US$ Million) Forecast by Services, 2019 to 2034
Table 11: Northern Market Value (US$ Million) Forecast by Tourist Type, 2019 to 2034
Table 12: Northern Market Value (US$ Million) Forecast by Tour Type, 2019 to 2034
Table 13: Northern Market Value (US$ Million) Forecast by Consumer Orientation, 2019 to 2034
Table 14: Northern Market Value (US$ Million) Forecast by Age Group, 2019 to 2034
Table 15: Northern Market Value (US$ Million) Forecast by Booking Channel, 2019 to 2034
Table 16: Northeastern Market Value (US$ Million) Forecast by Treatment Type, 2019 to 2034
Table 17: Northeastern Market Value (US$ Million) Forecast by Services, 2019 to 2034
Table 18: Northeastern Market Value (US$ Million) Forecast by Tourist Type, 2019 to 2034
Table 19: Northeastern Market Value (US$ Million) Forecast by Tour Type, 2019 to 2034
Table 20: Northeastern Market Value (US$ Million) Forecast by Consumer Orientation, 2019 to 2034
Table 21: Northeastern Market Value (US$ Million) Forecast by Age Group, 2019 to 2034
Table 22: Northeastern Market Value (US$ Million) Forecast by Booking Channel, 2019 to 2034
Table 23: Western Market Value (US$ Million) Forecast by Treatment Type, 2019 to 2034
Table 24: Western Market Value (US$ Million) Forecast by Services, 2019 to 2034
Table 25: Western Market Value (US$ Million) Forecast by Tourist Type, 2019 to 2034
Table 26: Western Market Value (US$ Million) Forecast by Tour Type, 2019 to 2034
Table 27: Western Market Value (US$ Million) Forecast by Consumer Orientation, 2019 to 2034
Table 28: Western Market Value (US$ Million) Forecast by Age Group, 2019 to 2034
Table 29: Western Market Value (US$ Million) Forecast by Booking Channel, 2019 to 2034
Table 30: Central Market Value (US$ Million) Forecast by Treatment Type, 2019 to 2034
Table 31: Central Market Value (US$ Million) Forecast by Services, 2019 to 2034
Table 32: Central Market Value (US$ Million) Forecast by Tourist Type, 2019 to 2034
Table 33: Central Market Value (US$ Million) Forecast by Tour Type, 2019 to 2034
Table 34: Central Market Value (US$ Million) Forecast by Consumer Orientation, 2019 to 2034
Table 35: Central Market Value (US$ Million) Forecast by Age Group, 2019 to 2034
Table 36: Central Market Value (US$ Million) Forecast by Booking Channel, 2019 to 2034
Table 37: Eastern Market Value (US$ Million) Forecast by Treatment Type, 2019 to 2034
Table 38: Eastern Market Value (US$ Million) Forecast by Services, 2019 to 2034
Table 39: Eastern Market Value (US$ Million) Forecast by Tourist Type, 2019 to 2034
Table 40: Eastern Market Value (US$ Million) Forecast by Tour Type, 2019 to 2034
Table 41: Eastern Market Value (US$ Million) Forecast by Consumer Orientation, 2019 to 2034
Table 42: Eastern Market Value (US$ Million) Forecast by Age Group, 2019 to 2034
Table 43: Eastern Market Value (US$ Million) Forecast by Booking Channel, 2019 to 2034
Table 44: Southern Market Value (US$ Million) Forecast by Treatment Type, 2019 to 2034
Table 45: Southern Market Value (US$ Million) Forecast by Services, 2019 to 2034
Table 46: Southern Market Value (US$ Million) Forecast by Tourist Type, 2019 to 2034
Table 47: Southern Market Value (US$ Million) Forecast by Tour Type, 2019 to 2034
Table 48: Southern Market Value (US$ Million) Forecast by Consumer Orientation, 2019 to 2034
Table 49: Southern Market Value (US$ Million) Forecast by Age Group, 2019 to 2034
Table 50: Southern Market Value (US$ Million) Forecast by Booking Channel, 2019 to 2034
Figure 1: Market Value (US$ Million) by Treatment Type, 2024 to 2034
Figure 2: Market Value (US$ Million) by Services, 2024 to 2034
Figure 3: Market Value (US$ Million) by Tourist Type, 2024 to 2034
Figure 4: Market Value (US$ Million) by Tour Type, 2024 to 2034
Figure 5: Market Value (US$ Million) by Consumer Orientation, 2024 to 2034
Figure 6: Market Value (US$ Million) by Age Group, 2024 to 2034
Figure 7: Market Value (US$ Million) by Booking Channel, 2024 to 2034
Figure 8: Market Value (US$ Million) by Region, 2024 to 2034
Figure 9: Market Value (US$ Million) Analysis by Region, 2019 to 2034
Figure 10: Market Value Share (%) and BPS Analysis by Region, 2024 to 2034
Figure 11: Market Y-o-Y Growth (%) Projections by Region, 2024 to 2034
Figure 12: Market Value (US$ Million) Analysis by Treatment Type, 2019 to 2034
Figure 13: Market Value Share (%) and BPS Analysis by Treatment Type, 2024 to 2034
Figure 14: Market Y-o-Y Growth (%) Projections by Treatment Type, 2024 to 2034
Figure 15: Market Value (US$ Million) Analysis by Services, 2019 to 2034
Figure 16: Market Value Share (%) and BPS Analysis by Services, 2024 to 2034
Figure 17: Market Y-o-Y Growth (%) Projections by Services, 2024 to 2034
Figure 18: Market Value (US$ Million) Analysis by Tourist Type, 2019 to 2034
Figure 19: Market Value Share (%) and BPS Analysis by Tourist Type, 2024 to 2034
Figure 20: Market Y-o-Y Growth (%) Projections by Tourist Type, 2024 to 2034
Figure 21: Market Value (US$ Million) Analysis by Tour Type, 2019 to 2034
Figure 22: Market Value Share (%) and BPS Analysis by Tour Type, 2024 to 2034
Figure 23: Market Y-o-Y Growth (%) Projections by Tour Type, 2024 to 2034
Figure 24: Market Value (US$ Million) Analysis by Consumer Orientation, 2019 to 2034
Figure 25: Market Value Share (%) and BPS Analysis by Consumer Orientation, 2024 to 2034
Figure 26: Market Y-o-Y Growth (%) Projections by Consumer Orientation, 2024 to 2034
Figure 27: Market Value (US$ Million) Analysis by Age Group, 2019 to 2034
Figure 28: Market Value Share (%) and BPS Analysis by Age Group, 2024 to 2034
Figure 29: Market Y-o-Y Growth (%) Projections by Age Group, 2024 to 2034
Figure 30: Market Value (US$ Million) Analysis by Booking Channel, 2019 to 2034
Figure 31: Market Value Share (%) and BPS Analysis by Booking Channel, 2024 to 2034
Figure 32: Market Y-o-Y Growth (%) Projections by Booking Channel, 2024 to 2034
Figure 33: Market Attractiveness by Treatment Type, 2024 to 2034
Figure 34: Market Attractiveness by Services, 2024 to 2034
Figure 35: Market Attractiveness by Tourist Type, 2024 to 2034
Figure 36: Market Attractiveness by Tour Type, 2024 to 2034
Figure 37: Market Attractiveness by Consumer Orientation, 2024 to 2034
Figure 38: Market Attractiveness by Age Group, 2024 to 2034
Figure 39: Market Attractiveness by Booking Channel, 2024 to 2034
Figure 40: Market Attractiveness by Region, 2024 to 2034
Figure 41: Northern Market Value (US$ Million) by Treatment Type, 2024 to 2034
Figure 42: Northern Market Value (US$ Million) by Services, 2024 to 2034
Figure 43: Northern Market Value (US$ Million) by Tourist Type, 2024 to 2034
Figure 44: Northern Market Value (US$ Million) by Tour Type, 2024 to 2034
Figure 45: Northern Market Value (US$ Million) by Consumer Orientation, 2024 to 2034
Figure 46: Northern Market Value (US$ Million) by Age Group, 2024 to 2034
Figure 47: Northern Market Value (US$ Million) by Booking Channel, 2024 to 2034
Figure 48: Northern Market Value (US$ Million) Analysis by Treatment Type, 2019 to 2034
Figure 49: Northern Market Value Share (%) and BPS Analysis by Treatment Type, 2024 to 2034
Figure 50: Northern Market Y-o-Y Growth (%) Projections by Treatment Type, 2024 to 2034
Figure 51: Northern Market Value (US$ Million) Analysis by Services, 2019 to 2034
Figure 52: Northern Market Value Share (%) and BPS Analysis by Services, 2024 to 2034
Figure 53: Northern Market Y-o-Y Growth (%) Projections by Services, 2024 to 2034
Figure 54: Northern Market Value (US$ Million) Analysis by Tourist Type, 2019 to 2034
Figure 55: Northern Market Value Share (%) and BPS Analysis by Tourist Type, 2024 to 2034
Figure 56: Northern Market Y-o-Y Growth (%) Projections by Tourist Type, 2024 to 2034
Figure 57: Northern Market Value (US$ Million) Analysis by Tour Type, 2019 to 2034
Figure 58: Northern Market Value Share (%) and BPS Analysis by Tour Type, 2024 to 2034
Figure 59: Northern Market Y-o-Y Growth (%) Projections by Tour Type, 2024 to 2034
Figure 60: Northern Market Value (US$ Million) Analysis by Consumer Orientation, 2019 to 2034
Figure 61: Northern Market Value Share (%) and BPS Analysis by Consumer Orientation, 2024 to 2034
Figure 62: Northern Market Y-o-Y Growth (%) Projections by Consumer Orientation, 2024 to 2034
Figure 63: Northern Market Value (US$ Million) Analysis by Age Group, 2019 to 2034
Figure 64: Northern Market Value Share (%) and BPS Analysis by Age Group, 2024 to 2034
Figure 65: Northern Market Y-o-Y Growth (%) Projections by Age Group, 2024 to 2034
Figure 66: Northern Market Value (US$ Million) Analysis by Booking Channel, 2019 to 2034
Figure 67: Northern Market Value Share (%) and BPS Analysis by Booking Channel, 2024 to 2034
Figure 68: Northern Market Y-o-Y Growth (%) Projections by Booking Channel, 2024 to 2034
Figure 69: Northern Market Attractiveness by Treatment Type, 2024 to 2034
Figure 70: Northern Market Attractiveness by Services, 2024 to 2034
Figure 71: Northern Market Attractiveness by Tourist Type, 2024 to 2034
Figure 72: Northern Market Attractiveness by Tour Type, 2024 to 2034
Figure 73: Northern Market Attractiveness by Consumer Orientation, 2024 to 2034
Figure 74: Northern Market Attractiveness by Age Group, 2024 to 2034
Figure 75: Northern Market Attractiveness by Booking Channel, 2024 to 2034
Figure 76: Northeastern Market Value (US$ Million) by Treatment Type, 2024 to 2034
Figure 77: Northeastern Market Value (US$ Million) by Services, 2024 to 2034
Figure 78: Northeastern Market Value (US$ Million) by Tourist Type, 2024 to 2034
Figure 79: Northeastern Market Value (US$ Million) by Tour Type, 2024 to 2034
Figure 80: Northeastern Market Value (US$ Million) by Consumer Orientation, 2024 to 2034
Figure 81: Northeastern Market Value (US$ Million) by Age Group, 2024 to 2034
Figure 82: Northeastern Market Value (US$ Million) by Booking Channel, 2024 to 2034
Figure 83: Northeastern Market Value (US$ Million) Analysis by Treatment Type, 2019 to 2034
Figure 84: Northeastern Market Value Share (%) and BPS Analysis by Treatment Type, 2024 to 2034
Figure 85: Northeastern Market Y-o-Y Growth (%) Projections by Treatment Type, 2024 to 2034
Figure 86: Northeastern Market Value (US$ Million) Analysis by Services, 2019 to 2034
Figure 87: Northeastern Market Value Share (%) and BPS Analysis by Services, 2024 to 2034
Figure 88: Northeastern Market Y-o-Y Growth (%) Projections by Services, 2024 to 2034
Figure 89: Northeastern Market Value (US$ Million) Analysis by Tourist Type, 2019 to 2034
Figure 90: Northeastern Market Value Share (%) and BPS Analysis by Tourist Type, 2024 to 2034
Figure 91: Northeastern Market Y-o-Y Growth (%) Projections by Tourist Type, 2024 to 2034
Figure 92: Northeastern Market Value (US$ Million) Analysis by Tour Type, 2019 to 2034
Figure 93: Northeastern Market Value Share (%) and BPS Analysis by Tour Type, 2024 to 2034
Figure 94: Northeastern Market Y-o-Y Growth (%) Projections by Tour Type, 2024 to 2034
Figure 95: Northeastern Market Value (US$ Million) Analysis by Consumer Orientation, 2019 to 2034
Figure 96: Northeastern Market Value Share (%) and BPS Analysis by Consumer Orientation, 2024 to 2034
Figure 97: Northeastern Market Y-o-Y Growth (%) Projections by Consumer Orientation, 2024 to 2034
Figure 98: Northeastern Market Value (US$ Million) Analysis by Age Group, 2019 to 2034
Figure 99: Northeastern Market Value Share (%) and BPS Analysis by Age Group, 2024 to 2034
Figure 100: Northeastern Market Y-o-Y Growth (%) Projections by Age Group, 2024 to 2034
Figure 101: Northeastern Market Value (US$ Million) Analysis by Booking Channel, 2019 to 2034
Figure 102: Northeastern Market Value Share (%) and BPS Analysis by Booking Channel, 2024 to 2034
Figure 103: Northeastern Market Y-o-Y Growth (%) Projections by Booking Channel, 2024 to 2034
Figure 104: Northeastern Market Attractiveness by Treatment Type, 2024 to 2034
Figure 105: Northeastern Market Attractiveness by Services, 2024 to 2034
Figure 106: Northeastern Market Attractiveness by Tourist Type, 2024 to 2034
Figure 107: Northeastern Market Attractiveness by Tour Type, 2024 to 2034
Figure 108: Northeastern Market Attractiveness by Consumer Orientation, 2024 to 2034
Figure 109: Northeastern Market Attractiveness by Age Group, 2024 to 2034
Figure 110: Northeastern Market Attractiveness by Booking Channel, 2024 to 2034
Figure 111: Western Market Value (US$ Million) by Treatment Type, 2024 to 2034
Figure 112: Western Market Value (US$ Million) by Services, 2024 to 2034
Figure 113: Western Market Value (US$ Million) by Tourist Type, 2024 to 2034
Figure 114: Western Market Value (US$ Million) by Tour Type, 2024 to 2034
Figure 115: Western Market Value (US$ Million) by Consumer Orientation, 2024 to 2034
Figure 116: Western Market Value (US$ Million) by Age Group, 2024 to 2034
Figure 117: Western Market Value (US$ Million) by Booking Channel, 2024 to 2034
Figure 118: Western Market Value (US$ Million) Analysis by Treatment Type, 2019 to 2034
Figure 119: Western Market Value Share (%) and BPS Analysis by Treatment Type, 2024 to 2034
Figure 120: Western Market Y-o-Y Growth (%) Projections by Treatment Type, 2024 to 2034
Figure 121: Western Market Value (US$ Million) Analysis by Services, 2019 to 2034
Figure 122: Western Market Value Share (%) and BPS Analysis by Services, 2024 to 2034
Figure 123: Western Market Y-o-Y Growth (%) Projections by Services, 2024 to 2034
Figure 124: Western Market Value (US$ Million) Analysis by Tourist Type, 2019 to 2034
Figure 125: Western Market Value Share (%) and BPS Analysis by Tourist Type, 2024 to 2034
Figure 126: Western Market Y-o-Y Growth (%) Projections by Tourist Type, 2024 to 2034
Figure 127: Western Market Value (US$ Million) Analysis by Tour Type, 2019 to 2034
Figure 128: Western Market Value Share (%) and BPS Analysis by Tour Type, 2024 to 2034
Figure 129: Western Market Y-o-Y Growth (%) Projections by Tour Type, 2024 to 2034
Figure 130: Western Market Value (US$ Million) Analysis by Consumer Orientation, 2019 to 2034
Figure 131: Western Market Value Share (%) and BPS Analysis by Consumer Orientation, 2024 to 2034
Figure 132: Western Market Y-o-Y Growth (%) Projections by Consumer Orientation, 2024 to 2034
Figure 133: Western Market Value (US$ Million) Analysis by Age Group, 2019 to 2034
Figure 134: Western Market Value Share (%) and BPS Analysis by Age Group, 2024 to 2034
Figure 135: Western Market Y-o-Y Growth (%) Projections by Age Group, 2024 to 2034
Figure 136: Western Market Value (US$ Million) Analysis by Booking Channel, 2019 to 2034
Figure 137: Western Market Value Share (%) and BPS Analysis by Booking Channel, 2024 to 2034
Figure 138: Western Market Y-o-Y Growth (%) Projections by Booking Channel, 2024 to 2034
Figure 139: Western Market Attractiveness by Treatment Type, 2024 to 2034
Figure 140: Western Market Attractiveness by Services, 2024 to 2034
Figure 141: Western Market Attractiveness by Tourist Type, 2024 to 2034
Figure 142: Western Market Attractiveness by Tour Type, 2024 to 2034
Figure 143: Western Market Attractiveness by Consumer Orientation, 2024 to 2034
Figure 144: Western Market Attractiveness by Age Group, 2024 to 2034
Figure 145: Western Market Attractiveness by Booking Channel, 2024 to 2034
Figure 146: Central Market Value (US$ Million) by Treatment Type, 2024 to 2034
Figure 147: Central Market Value (US$ Million) by Services, 2024 to 2034
Figure 148: Central Market Value (US$ Million) by Tourist Type, 2024 to 2034
Figure 149: Central Market Value (US$ Million) by Tour Type, 2024 to 2034
Figure 150: Central Market Value (US$ Million) by Consumer Orientation, 2024 to 2034
Figure 151: Central Market Value (US$ Million) by Age Group, 2024 to 2034
Figure 152: Central Market Value (US$ Million) by Booking Channel, 2024 to 2034
Figure 153: Central Market Value (US$ Million) Analysis by Treatment Type, 2019 to 2034
Figure 154: Central Market Value Share (%) and BPS Analysis by Treatment Type, 2024 to 2034
Figure 155: Central Market Y-o-Y Growth (%) Projections by Treatment Type, 2024 to 2034
Figure 156: Central Market Value (US$ Million) Analysis by Services, 2019 to 2034
Figure 157: Central Market Value Share (%) and BPS Analysis by Services, 2024 to 2034
Figure 158: Central Market Y-o-Y Growth (%) Projections by Services, 2024 to 2034
Figure 159: Central Market Value (US$ Million) Analysis by Tourist Type, 2019 to 2034
Figure 160: Central Market Value Share (%) and BPS Analysis by Tourist Type, 2024 to 2034
Figure 161: Central Market Y-o-Y Growth (%) Projections by Tourist Type, 2024 to 2034
Figure 162: Central Market Value (US$ Million) Analysis by Tour Type, 2019 to 2034
Figure 163: Central Market Value Share (%) and BPS Analysis by Tour Type, 2024 to 2034
Figure 164: Central Market Y-o-Y Growth (%) Projections by Tour Type, 2024 to 2034
Figure 165: Central Market Value (US$ Million) Analysis by Consumer Orientation, 2019 to 2034
Figure 166: Central Market Value Share (%) and BPS Analysis by Consumer Orientation, 2024 to 2034
Figure 167: Central Market Y-o-Y Growth (%) Projections by Consumer Orientation, 2024 to 2034
Figure 168: Central Market Value (US$ Million) Analysis by Age Group, 2019 to 2034
Figure 169: Central Market Value Share (%) and BPS Analysis by Age Group, 2024 to 2034
Figure 170: Central Market Y-o-Y Growth (%) Projections by Age Group, 2024 to 2034
Figure 171: Central Market Value (US$ Million) Analysis by Booking Channel, 2019 to 2034
Figure 172: Central Market Value Share (%) and BPS Analysis by Booking Channel, 2024 to 2034
Figure 173: Central Market Y-o-Y Growth (%) Projections by Booking Channel, 2024 to 2034
Figure 174: Central Market Attractiveness by Treatment Type, 2024 to 2034
Figure 175: Central Market Attractiveness by Services, 2024 to 2034
Figure 176: Central Market Attractiveness by Tourist Type, 2024 to 2034
Figure 177: Central Market Attractiveness by Tour Type, 2024 to 2034
Figure 178: Central Market Attractiveness by Consumer Orientation, 2024 to 2034
Figure 179: Central Market Attractiveness by Age Group, 2024 to 2034
Figure 180: Central Market Attractiveness by Booking Channel, 2024 to 2034
Figure 181: Eastern Market Value (US$ Million) by Treatment Type, 2024 to 2034
Figure 182: Eastern Market Value (US$ Million) by Services, 2024 to 2034
Figure 183: Eastern Market Value (US$ Million) by Tourist Type, 2024 to 2034
Figure 184: Eastern Market Value (US$ Million) by Tour Type, 2024 to 2034
Figure 185: Eastern Market Value (US$ Million) by Consumer Orientation, 2024 to 2034
Figure 186: Eastern Market Value (US$ Million) by Age Group, 2024 to 2034
Figure 187: Eastern Market Value (US$ Million) by Booking Channel, 2024 to 2034
Figure 188: Eastern Market Value (US$ Million) Analysis by Treatment Type, 2019 to 2034
Figure 189: Eastern Market Value Share (%) and BPS Analysis by Treatment Type, 2024 to 2034
Figure 190: Eastern Market Y-o-Y Growth (%) Projections by Treatment Type, 2024 to 2034
Figure 191: Eastern Market Value (US$ Million) Analysis by Services, 2019 to 2034
Figure 192: Eastern Market Value Share (%) and BPS Analysis by Services, 2024 to 2034
Figure 193: Eastern Market Y-o-Y Growth (%) Projections by Services, 2024 to 2034
Figure 194: Eastern Market Value (US$ Million) Analysis by Tourist Type, 2019 to 2034
Figure 195: Eastern Market Value Share (%) and BPS Analysis by Tourist Type, 2024 to 2034
Figure 196: Eastern Market Y-o-Y Growth (%) Projections by Tourist Type, 2024 to 2034
Figure 197: Eastern Market Value (US$ Million) Analysis by Tour Type, 2019 to 2034
Figure 198: Eastern Market Value Share (%) and BPS Analysis by Tour Type, 2024 to 2034
Figure 199: Eastern Market Y-o-Y Growth (%) Projections by Tour Type, 2024 to 2034
Figure 200: Eastern Market Value (US$ Million) Analysis by Consumer Orientation, 2019 to 2034
Figure 201: Eastern Market Value Share (%) and BPS Analysis by Consumer Orientation, 2024 to 2034
Figure 202: Eastern Market Y-o-Y Growth (%) Projections by Consumer Orientation, 2024 to 2034
Figure 203: Eastern Market Value (US$ Million) Analysis by Age Group, 2019 to 2034
Figure 204: Eastern Market Value Share (%) and BPS Analysis by Age Group, 2024 to 2034
Figure 205: Eastern Market Y-o-Y Growth (%) Projections by Age Group, 2024 to 2034
Figure 206: Eastern Market Value (US$ Million) Analysis by Booking Channel, 2019 to 2034
Figure 207: Eastern Market Value Share (%) and BPS Analysis by Booking Channel, 2024 to 2034
Figure 208: Eastern Market Y-o-Y Growth (%) Projections by Booking Channel, 2024 to 2034
Figure 209: Eastern Market Attractiveness by Treatment Type, 2024 to 2034
Figure 210: Eastern Market Attractiveness by Services, 2024 to 2034
Figure 211: Eastern Market Attractiveness by Tourist Type, 2024 to 2034
Figure 212: Eastern Market Attractiveness by Tour Type, 2024 to 2034
Figure 213: Eastern Market Attractiveness by Consumer Orientation, 2024 to 2034
Figure 214: Eastern Market Attractiveness by Age Group, 2024 to 2034
Figure 215: Eastern Market Attractiveness by Booking Channel, 2024 to 2034
Figure 216: Southern Market Value (US$ Million) by Treatment Type, 2024 to 2034
Figure 217: Southern Market Value (US$ Million) by Services, 2024 to 2034
Figure 218: Southern Market Value (US$ Million) by Tourist Type, 2024 to 2034
Figure 219: Southern Market Value (US$ Million) by Tour Type, 2024 to 2034
Figure 220: Southern Market Value (US$ Million) by Consumer Orientation, 2024 to 2034
Figure 221: Southern Market Value (US$ Million) by Age Group, 2024 to 2034
Figure 222: Southern Market Value (US$ Million) by Booking Channel, 2024 to 2034
Figure 223: Southern Market Value (US$ Million) Analysis by Treatment Type, 2019 to 2034
Figure 224: Southern Market Value Share (%) and BPS Analysis by Treatment Type, 2024 to 2034
Figure 225: Southern Market Y-o-Y Growth (%) Projections by Treatment Type, 2024 to 2034
Figure 226: Southern Market Value (US$ Million) Analysis by Services, 2019 to 2034
Figure 227: Southern Market Value Share (%) and BPS Analysis by Services, 2024 to 2034
Figure 228: Southern Market Y-o-Y Growth (%) Projections by Services, 2024 to 2034
Figure 229: Southern Market Value (US$ Million) Analysis by Tourist Type, 2019 to 2034
Figure 230: Southern Market Value Share (%) and BPS Analysis by Tourist Type, 2024 to 2034
Figure 231: Southern Market Y-o-Y Growth (%) Projections by Tourist Type, 2024 to 2034
Figure 232: Southern Market Value (US$ Million) Analysis by Tour Type, 2019 to 2034
Figure 233: Southern Market Value Share (%) and BPS Analysis by Tour Type, 2024 to 2034
Figure 234: Southern Market Y-o-Y Growth (%) Projections by Tour Type, 2024 to 2034
Figure 235: Southern Market Value (US$ Million) Analysis by Consumer Orientation, 2019 to 2034
Figure 236: Southern Market Value Share (%) and BPS Analysis by Consumer Orientation, 2024 to 2034
Figure 237: Southern Market Y-o-Y Growth (%) Projections by Consumer Orientation, 2024 to 2034
Figure 238: Southern Market Value (US$ Million) Analysis by Age Group, 2019 to 2034
Figure 239: Southern Market Value Share (%) and BPS Analysis by Age Group, 2024 to 2034
Figure 240: Southern Market Y-o-Y Growth (%) Projections by Age Group, 2024 to 2034
Figure 241: Southern Market Value (US$ Million) Analysis by Booking Channel, 2019 to 2034
Figure 242: Southern Market Value Share (%) and BPS Analysis by Booking Channel, 2024 to 2034
Figure 243: Southern Market Y-o-Y Growth (%) Projections by Booking Channel, 2024 to 2034
Figure 244: Southern Market Attractiveness by Treatment Type, 2024 to 2034
Figure 245: Southern Market Attractiveness by Services, 2024 to 2034
Figure 246: Southern Market Attractiveness by Tourist Type, 2024 to 2034
Figure 247: Southern Market Attractiveness by Tour Type, 2024 to 2034
Figure 248: Southern Market Attractiveness by Consumer Orientation, 2024 to 2034
Figure 249: Southern Market Attractiveness by Age Group, 2024 to 2034
Figure 250: Southern Market Attractiveness by Booking Channel, 2024 to 2034
The medical tourism sector of Thailand is nearly USD 15,378.00 million valuation in 2024.
The demand growth of medical tourism in Thailand is going to increase at a 15.70% CAGR through 2034.
The medical tourism sector of Thailand is likely to reach USD 66,104.90 million figure by 2034.
People between 46-55 years are the frequent consumers of Thailand’s medical tourism.
Lotus Medical International, World Medical and Surgical LLC, and MedEx Ventures Co. Ltd. are promising participants in the Thailand medical tourism industry.
Explore Wellness Tourism Insights
Thank you!
You will receive an email from our Business Development Manager. Please be sure to check your SPAM/JUNK folder too.