The Trends, Growth, and Opportunity Analysis of Pea Protein in South Korea is estimated to be valued at USD 109.3 million in 2025 and is projected to reach USD 324.6 million by 2035, registering a compound annual growth rate (CAGR) of 11.5% over the forecast period.
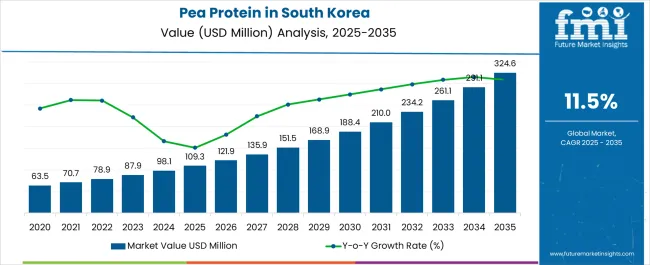
| Metric | Value |
|---|---|
| Trends, Growth, and Opportunity Analysis of Pea Protein in South Korea Estimated Value in (2025 E) | USD 109.3 million |
| Trends, Growth, and Opportunity Analysis of Pea Protein in South Korea Forecast Value in (2035 F) | USD 324.6 million |
| Forecast CAGR (2025 to 2035) | 11.5% |
The pea protein market in South Korea is experiencing robust growth. Rising consumer awareness regarding plant-based nutrition, increasing demand for protein-enriched foods, and growing adoption of vegan and flexitarian diets are driving market expansion. Current dynamics are shaped by the integration of pea protein into functional foods, beverages, and dietary supplements.
Regulatory frameworks supporting organic and clean-label products are enhancing market credibility and consumer trust. The future outlook is defined by continued investment in product innovation, expansion of retail and e-commerce channels, and increasing collaborations between ingredient suppliers and food manufacturers. Growth rationale is grounded in the high nutritional profile of pea protein, ease of incorporation into various formulations, and consumer preference for sustainable and non-allergenic protein sources.
Technological advancements in extraction and processing methods are improving solubility, taste, and functionality Combined with strategic distribution networks and rising health consciousness among consumers, these factors are expected to sustain demand and create new opportunities across the South Korean food and beverage industry.
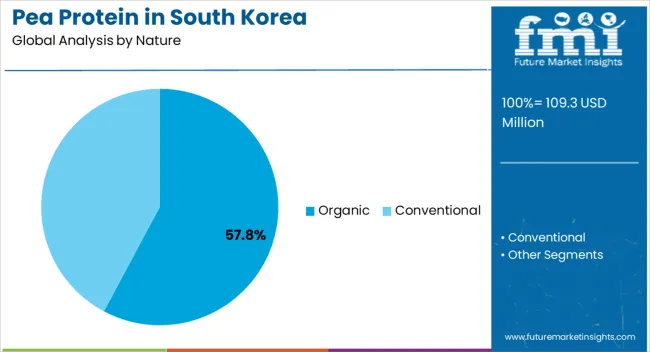
The organic segment, accounting for 57.80% of the nature category, has maintained market leadership due to strong consumer preference for natural and chemical-free ingredients. Adoption has been driven by heightened awareness of health and wellness benefits, regulatory support for certified organic products, and increasing trust in food labeling.
Demand stability has been reinforced by consistent supply from certified farms and import channels. Product quality, safety, and traceability have been critical in sustaining confidence among manufacturers and end consumers.
Growth is being further supported by premium positioning in functional foods, beverages, and dietary supplements, while ongoing investments in organic pea cultivation and processing infrastructure are expected to strengthen the segment’s market share and maintain its leadership position in South Korea.
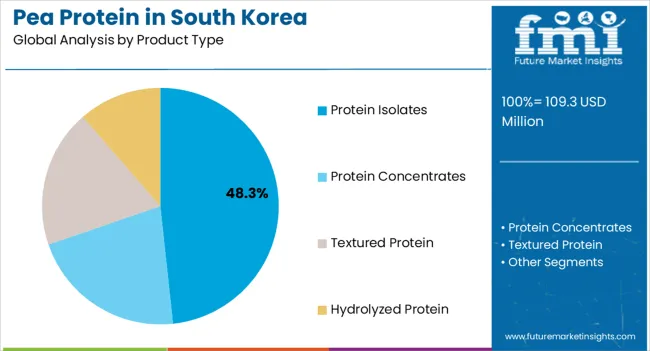
The protein isolates segment, representing 48.30% of the product type category, has been leading due to its high protein content, functional versatility, and suitability for diverse applications such as nutritional bars, beverages, and meat alternatives. Adoption has been facilitated by processing innovations that enhance solubility, taste, and texture, making isolates highly compatible with various formulations.
Manufacturers have prioritized protein isolates due to their consistent nutritional profile and ease of blending. Market preference has been reinforced by growing demand for high-protein, low-fat, and allergen-free ingredients.
Technological improvements in extraction and purification processes are expected to sustain the segment’s market share and support growth by meeting evolving consumer and industrial requirements.
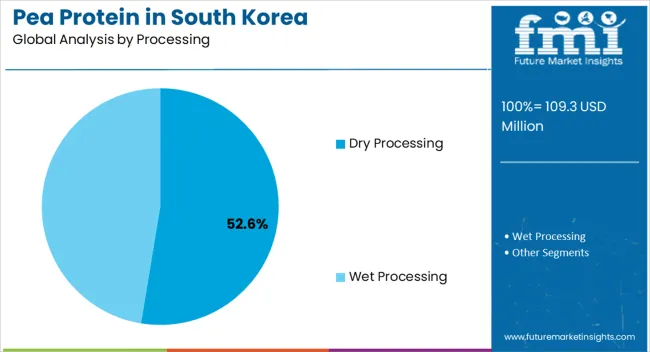
The dry processing segment, holding 52.60% of the processing category, has emerged as the leading method due to its cost-effectiveness, energy efficiency, and ability to preserve protein integrity. Adoption has been supported by compatibility with large-scale production, minimal impact on nutritional quality, and suitability for a range of end-product formats.
Market acceptance has been reinforced by enhanced shelf stability, ease of handling, and reduced processing complexity compared to wet methods. Investment in modern drying technologies and process optimization has improved yield and functionality, while regulatory compliance and quality control measures ensure product consistency.
These factors are expected to sustain the segment’s leadership and enable continued expansion in South Korea’s pea protein market.
The high protein content of isolates makes them suitable for use in sports nutrition products. Athletes and fitness enthusiasts often seek protein isolates for muscle recovery and growth, contributing to segmental growth.
| Pea Protein in South Korea based on Product Type | Protein Isolates |
|---|---|
| Share in % in 2035 | 45.1% |
Based on product type, the protein isolates segment is expected to account for a share of 45.1% in 2035. Pea protein isolates are considered hypoallergenic, making them suitable for individuals with food allergies or sensitivities.
Pea protein isolates are minimally processed and are perceived as clean-label ingredients. Isolates are increasingly used in various food and beverage applications, as consumer preferences for natural and clean label products grow.
Protein isolates have a neutral flavor profile and can be incorporated into a wide range of food products, including dairy alternatives, meat alternatives, snacks, and baked goods. South Korean consumers are increasingly focused on health and wellness, driving the demand for protein-rich products. Pea protein isolates cater to these trends.
The growth of plant-based and clean meat alternatives is boosting the use of pea protein isolates. They provide the right texture and protein content for meat analogs. The isolates are essential in the formulation of dairy-free and vegan products, such as plant-based milk, yogurt, and ice cream, which are gaining popularity.
| Pea Protein in South Korea based on Processing | Dry Processing |
|---|---|
| Share in % in 2035 | 67.7% |
Based on processing, the dry processing segment is expected to account for a share of 67.7% in 2035. Dry processing methods are highly effective in concentrating pea protein, resulting in powders with a high protein content. The methods are in high demand among consumers seeking protein-rich dietary options.
Dry processing helps in reducing the moisture content in pea protein, extending its shelf life and enhancing product stability. Pea protein produced through dry processing typically has a neutral flavor profile, allowing it to be incorporated into a wide range of food products without significantly altering taste.
Dry processed pea protein powders are known for their good solubility, making them suitable for use in a variety of applications, including beverages, protein shakes, and dietary supplements. Dry processing helps in achieving a high level of purity in pea protein products, reducing the presence of unwanted compounds and allergens.
Dry processed pea protein powders are versatile ingredients in various food and beverage applications, such as dairy alternatives, meat analogs, snacks, and baked goods. The growth of plant-based and clean meat alternatives is boosting the use of dry processed pea protein. It provides the right texture and protein content for meat analogs.
South Gyeongsang boasts significant agricultural potential with favorable climate conditions. The cultivation of peas, a key source of pea protein, can be supported by these conditions, potentially leading to increased local production.
Government incentives and policies that promote sustainable agriculture and plant based food production can encourage local farmers to grow peas for protein extraction. Increasing consumer awareness about the health and environmental benefits of plant based proteins can drive demand for pea protein products.
The food and beverage industry in the region can benefit from incorporating locally sourced pea protein into their products, appealing to consumers who prefer products with local ingredients. South Korean consumers are becoming more eco conscious. Locally produced pea protein with a lower carbon footprint can align with sustainability trends.
Partnering with local universities and research institutions can foster innovation in pea protein production and its application in food products. Educational initiatives and campaigns promoting plant based diets can boost the demand for pea protein as an essential ingredient in various plant based foods.
The food and beverage industry in North Jeolla can benefit from incorporating locally sourced pea protein into their products, appealing to consumers who prefer foods made with local ingredients. Growing awareness of the health benefits of plant-based proteins can drive consumer demand for pea protein products as a healthier alternative.
The potential of the province to produce locally sourced pea protein with a lower environmental footprint can align with consumer sustainability trends, especially as environmental concerns gain significance.
Promoting plant-based diets and the benefits of pea protein through educational initiatives can increase consumer demand in the region. Government and industry support for local start-ups and small to medium-sized enterprises (SMEs) can encourage entrepreneurship in the pea protein sector.
Producing pea protein locally for local consumption can reduce transportation costs and carbon emissions, aligning with sustainability goals. Incorporating pea protein into a variety of food products, such as snacks, beverages, and meat alternatives, can expand the range of offerings and cater to diverse consumer preferences.
The temperate climate and rich volcanic soil in Jeju can support the cultivation of peas, a primary source of pea protein. Local pea farming can increase the availability of raw materials for pea protein production. The tourism industry attracts health-conscious tourists in Jeju.
Local food and beverage businesses can leverage this by offering products enriched with pea protein, catering to health-conscious tourists. Producing pea protein locally can align with Jeju's focus on self-sufficiency and environmental sustainability.
The demand for health-focused foods, including those incorporating pea protein, can rise as Jeju becomes a hub for health and wellness tourism. The island's proximity to international industries and access to ports can facilitate the export of pea protein products to other regions and countries.
A competitive environment can stimulate innovation and quality improvement, making pea protein products more attractive and affordable to consumers. The food and beverage industry in the island can incorporate locally sourced pea protein into their products, promoting the use of locally grown ingredients and appealing to consumers who prefer such products.
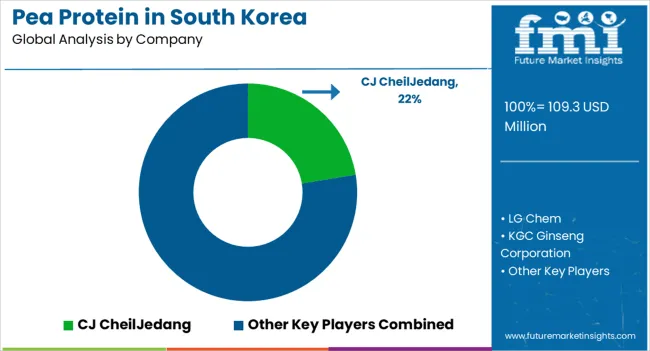
The competitive landscape of the pea protein industry in South Korea is dynamic and evolving, driven by increasing consumer demand for plant-based protein products and sustainable food options. Several companies are actively participating in this industry, both domestic and international players. The industry is expected to remain competitive in the coming years as companies continue to innovate and develop new products.
Recent Developments Observed in South Korean Pea Protein Industry
| Attribute | Details |
|---|---|
| Estimated Industry Size in 2025 | USD 109.3 million |
| Projected Industry Size in 2035 | USD 324.6 million |
| Anticipated CAGR from 2025 to 2035 | 11.5% CAGR |
| Historical Analysis of Demand for Pea Protein in South Korea | 2020 to 2025 |
| Demand Forecast for Pea Protein in South Korea | 2025 to 2035 |
| Report Coverage | Industry Size, Industry Trends, Analysis of key factors influencing Pea Protein adoption in South Korea, Insights on Global Players and their Industry Strategy in South Korea, Ecosystem Analysis of South Korean Manufacturers |
| Key Provinces Analyzed while Studying Opportunities in Pea Protein in South Korea | South Gyeongsang, North Jeolla, South Jeolla, Jeju |
| Key Companies Profiled | CJ CheilJedang; LG Chem; KGC Ginseng Corporation; Lotte Corporation; Samsung SDS; Daesang Corporation; Ingredion; Roquette; Emsland Group; Nutri-Pea; Shandong Jianyuan Foods; Shandong Huatai Food |
The global trends, growth, and opportunity analysis of pea protein in South Korea is estimated to be valued at USD 109.3 million in 2025.
The market size for the trends, growth, and opportunity analysis of pea protein in South Korea is projected to reach USD 324.6 million by 2035.
The trends, growth, and opportunity analysis of pea protein in South Korea is expected to grow at a 11.5% CAGR between 2025 and 2035.
The key product types in trends, growth, and opportunity analysis of pea protein in South Korea are organic and conventional.
In terms of product type, protein isolates segment to command 48.3% share in the trends, growth, and opportunity analysis of pea protein in South Korea in 2025.


Full Research Suite comprises of:
Market outlook & trends analysis
Interviews & case studies
Strategic recommendations
Vendor profiles & capabilities analysis
5-year forecasts
8 regions and 60+ country-level data splits
Market segment data splits
12 months of continuous data updates
DELIVERED AS:
PDF EXCEL ONLINE
Trends, Growth, and Opportunity Analysis of Drinking Water in Saudi Arabia Forecast and Outlook 2025 to 2035
Trends, Growth, and Opportunity Analysis of Culinary Tourism in Italy Size and Share Forecast Outlook 2025 to 2035
Monaco Casino Tourism Industry Trends – Growth & Forecast through 2034
Trends, Growth, and Opportunity Analysis of Sustainable Tourism in Thailand Size and Share Forecast Outlook 2025 to 2035
Indonesia Sustainable Tourism Market Growth – Forecast 2024-2034
Trends, Growth, and Opportunity Analysis of Micro-investing Platform in Australia Size and Share Forecast Outlook 2025 to 2035
Trends, Growth, and Opportunity Analysis of Tourism in Burma Market Forecast and Outlook 2025 to 2035
US Luxury Fine Jewelry Market Insights 2024 to 2034
Trends, Growth, and Opportunity Analysis of Rail Tourism in Europe Market Forecast and Outlook 2025 to 2035
Trends, Growth, and Opportunity Analysis of Shisha Tobacco in GCC Countries Forecast and Outlook 2025 to 2035
Trends, Growth, and Opportunity Analysis of Sports Tourism in South Africa Size and Share Forecast Outlook 2025 to 2035
UK Medical Tourism Market Analysis – Growth & Forecast 2024-2034
Trends, Growth, and Opportunity Analysis of Outbound Tourism in France Forecast and Outlook 2025 to 2035
Trends, Growth, and Opportunity Analysis of Outbound Tourism in China Market Forecast and Outlook 2025 to 2035
Outbound Tourism in GCC Countries - Trends, Growth, and Opportunity Analysis (2024 to 2034)
United States Outbound Tourism Market Analysis - Size, Share, and Forecast 2024 to 2034
Trends, Growth, and Opportunity Analysis of Data Center Facility in Morocco Size and Share Forecast Outlook 2025 to 2035
Europe Connected Car Market Growth - Trends & Forecast through 2034
Trends, Growth, Opportunity Analysis of Medical Tourism in Thailand Size and Share Forecast Outlook 2025 to 2035
Hair Regrowth Treatments Market Size and Share Forecast Outlook 2025 to 2035

Thank you!
You will receive an email from our Business Development Manager. Please be sure to check your SPAM/JUNK folder too.
Chat With
MaRIA