Reports

- Global Locations -

Headquarters

Future Market Insights, Inc.

Christiana Corporate, 200
Continental Drive, Suite 401,
Newark, Delaware - 19713,
United States

T: +1-845-579-5705

Americas

Future Market Insights, Inc.

616 Corporate Way, Suite 2-9018,
Valley Cottage, NY 10989, United States

T: +1-347-918-3531

MEA

Future Market Insights

1602-6 Jumeirah Bay X2 Tower, Plot No: JLT-PH2-X2A,
Jumeirah Lakes Towers, Dubai,
United Arab Emirates

Europe

Future Market Insights

3rd Floor, 207 Regent Street,
W1B 3HH London
United Kingdom

T: + 44 (0) 20 8123 9659
D: +44 (0) 20 3287 4268

Asia Pacific

Future Market Insights

IndiaLand Global Tech Park, Unit UG-1, Behind Grand HighStreet, Phase 1, Hinjawadi, MH, Pune – 411057, India

Analytical Study of Outbound Tourism in China from 2024 to 2034

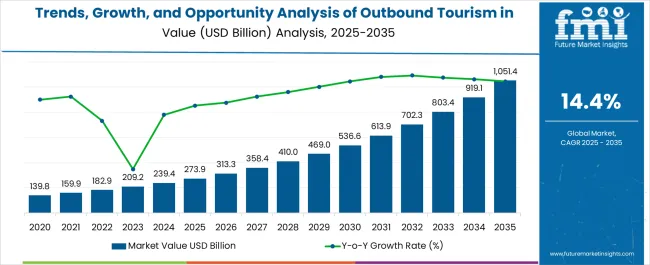
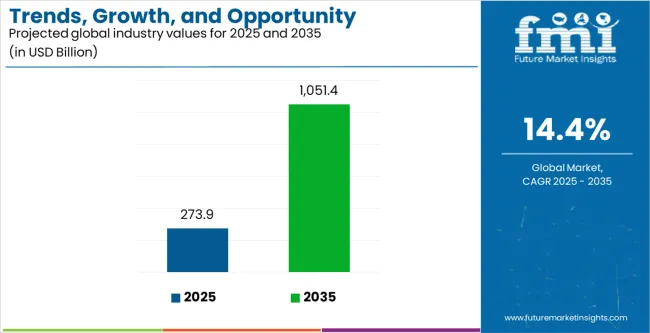
As China's economic growth persists, it is set to fuel significant expansion in the outbound tourism industry. There is substantial potential for further growth, with estimates suggesting it could soar to an impressive US$ 915.89 billion by 2034 from US$ 239.38 billion in 2024, marking a robust CAGR of 14.40%.

Attributes Details
Estimated China Outbound Tourism Market Size (2024) US$ 239.38 billion
Forecasted Industry Size (2034) US$ 915.89 billion
Projected Value CAGR (2024 to 2034) 14.40%

Don't pay for what you don't need

Customize your report by selecting specific countries or regions and save 30%!

Key Factors Influencing China’s Outbound Tourism Industry Growth

Direct Flights and Easy Visas Drive Chinese Travel Abroad! Tourism has always played a crucial role in boosting demand in China outbound tourism because of urbanization. With rising disposable income in China, millions of people can now afford to travel abroad. Given new direct-flight services and easier visa procedures, Chinese travelers now have more mobility and can travel abroad more easily. This trend is expected to continue, leading to increased travel volume and global impact.

China's Government Boosts Outbound Tourism! The government is now more enthusiastic about the outbound tourism sector. In August 2023, the Ministry of Culture and Tourism in China announced that travel agencies could start organizing trips to 138 countries for Chinese group tours again.

This decision is expected to significantly boost outbound travel from China. Among destination regions, the Middle East is expected to experience the fastest recovery in arrivals from China.

Southeast Asian Countries Woo Chinese Tourists! Travelers today are looking for genuine, local experiences, especially in countries like Australia, New Zealand, Africa, India, the United States, and Japan. Thailand, Malaysia, Sri Lanka, and Singapore have all made efforts in 2024 to draw in Chinese tourists.

They have removed visa requirements to make visiting easier and more appealing. With the urge to have rich travel experiences, the outbound travel Industry from China is expected to grow significantly in the next decade. As a result, our experts predict a 3.82X increase in outbound tourism sales in China by 2034.

Digital Revolution Fuels China's Travel Interest! Around half of the population in China uses social media, email, and instant messaging, and 85% have a personal account. Travel influencers are posting pictures and videos on Facebook, Twitter, and Instagram. Outbound tourism companies are using digital technology more extensively and are advertising on these platforms, too. All of these are likely to lead to China outbound tourism demand.

Historical Industry Study on China’s Outbound Tourism alongside Future Projections

From 2019 to 2023, the outbound tourism industry in China showed impressive growth, boasting a 13.70% CAGR. Before the COVID-19 pandemic, China led the world as the biggest outbound tourism market. This makes up over 9% of total outbound tourism expenditure in China. Domestic travel in China has bounced back strongly. This happened after the government relaxed three years of zero-COVID rules.

Recent information from the United Nations World Tourism Organization showed that outbound tourism in China reached around 55% of its pre-pandemic levels in the third quarter of 2023. During Golden Week in early October, millions more individuals are likely to travel within China. This includes visits to Hong Kong, Macau, and Thailand.

Attributes Quantitative Outlook
China Outbound Tourism Industry Size (2019) US$ 125.31 billion
China Outbound Tourism Industry Size (2023) US$ 209.80 billion
Historical CAGR (2019 to 2023) 13.70%

While domestic trips rebounded in 2023, domestic spending is expected to fully recover by 2024. Data from the Civil Aviation Administration of China shows a notable increase in international passenger flights, jumping from less than 500 flights per week in early 2023 to over 4,600 flights in early 2024.

With the rapid resumption of international flights and more favorable visa policies in major destinations, there has been a notable rise in residents' interest in exploring foreign countries.

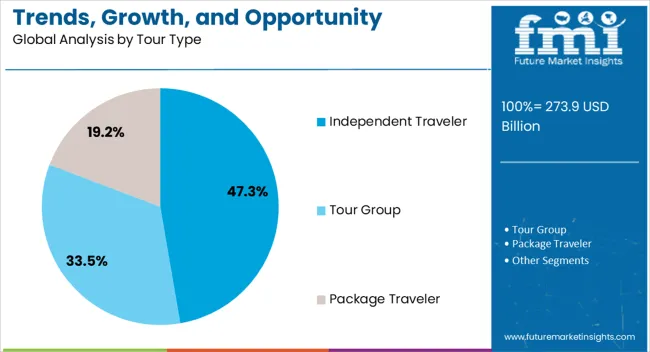
Many travelers in China prefer going abroad in family or group settings. Chinese tourists prefer Southeast Asian countries because of easy transportation, friendly language settings, many tourist attractions, and affordable travel expenses. This means travel companies in this region must create a positive environment and reputation to earn the trust and loyalty of their customers.

Ronak Shah
Ronak Shah

Principal Consultant

Talk to Analyst

Find your sweet spots for generating winning opportunities in this market.

Top Opportunities for China Outbound Tourism Industry Players

The growing interest of tourists from China in gastronomy tourism presents significant opportunities for travel companies in the China overseas travel market. Food is important in Chinese culture.

Tourists from China enjoy gastronomy tourism because it lets them try different foods, taste local flavors, and learn about culinary customs. Consequently, travel companies can create specialized gastronomy tour packages that showcase local cuisines, flavors, and culinary traditions of various destinations.

Sharing food experiences on social media is also trendy among Chinese tourists, adding to the appeal of gastronomy tourism. Travel companies can use the fact that many Chinese tourists love social media to their advantage. They can ask tourists to share their food adventures online. This helps promote gastronomy tourism and makes the travel company more known and respected among possible customers.

There is another opportunity available for businesses to attract tourists from China by leveraging personalized experiences and excellent customer service. Many tourists from China, particularly millennials, have a strong desire for customized travel experiences.

Therefore, strategies such as having multilingual staff, offering translation services, and providing personalized itineraries and special services/amenities could be proven beneficial. Therefore, the future of China’s outbound tourism and hotel market looks bright.

Outbound Tourism Trends China

  • China’s travel industry is increasingly leaning toward high-quality and experiential travel options as travelers’ preferences evolve. Personalized and flexible travel packages are becoming more popular among travelers.
  • Another evolving trend in China’s outbound tourism industry is an inclination toward self-driving tours. Specialized tourism offerings designed for specific interests are catching people's attention.
  • China’s airlines stand to gain significantly from the increasing demand for outbound travel. This growth in air travel is projected to also lead to more traffic at airports, thereby increasing demand for duty-free shopping.

Get the data you need at a Fraction of the cost

Personalize your report by choosing insights you need
and save 40%!

Comparative Analysis of the Adjacent China Outbound Tourism Industry

A comparison of the outbound tourism industry in China with the outbound tourism industry in Germany and the United States has been conducted in the table below. Analysis of these industries from 2024 to 2034 suggests that the expected growth rates of the outbound tourism industry in China and the United States are going to be relatively similar, with minimal variations. However, the outbound tourism industry in Germany is likely to exhibit a lower growth rate.

China Outbound Tourism Industry:

Differentiating Aspects China Outbound Tourism Industry
CAGR (2024 to 2034) 14.40%
Industry Size by 2034 US$ 915.89 billion
Growth Factor Growth of digital platforms and mobile payment options facilitating travel bookings
Key Trend Shift toward independent travel, personalized itineraries, and luxury travel experiences

Germany Outbound Tourism Industry:

Differentiating Aspects Germany Outbound Tourism Industry
CAGR (2024 to 2034) 9.80%
Industry Size by 2034 US$ 292.79 billion
Growth Factor Long-standing tradition of international travel and cultural exploration
Key Trend Rise of digital nomadism and remote work opportunities impacting travel patterns

The United States Outbound Tourism Industry:

Differentiating Aspects The United States Outbound Tourism Industry
CAGR (2024 to 2034) 14.20%
Industry Size by 2034 US$ 412.26 billion
Growth Factor Technological advancements are enabling easy access to travel information and bookings
Key Trend Influence of social media influencers and user-generated content on travel choices

China Outbound Tourism Market Analysis by Segment

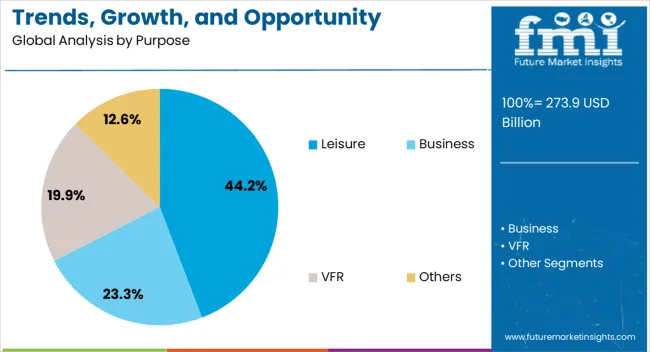
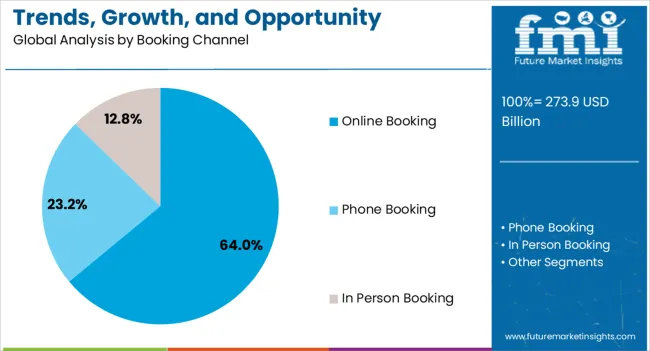
As far as the booking channel is concerned, the online booking segment is likely to perform better in 2024, holding 64.00% of China’s outbound tourism industry share. Similarly, the leisure segment is expected to generate significant turnover in terms of purpose, possessing a 44.20% revenue share of the outbound tourism industry in China in 2024.

Segment Estimated Industry Share in 2024
Online Booking Channel 64.00%
Leisure Purpose 44.20%

Chinese Travelers Flock to Online Booking for Convenience

The online booking channel segment is likely to become the prime revenue generator within the industry. The majority of bookings are done online, matching how people search for travel information. The significant impact of digital technology on tourists in China is expected to reshape the online booking channel for China’s travelers abroad market. China has a large number of smartphone users, with over 600 million people using them.

With the rise of online travel platforms and enticing deals, the online booking sector is expected to grow the most in the coming years. With a large number of Chinese travelers using smartphones, there is likely to be a surge in online bookings through mobile apps and websites.

Over 80% of Chinese independent travelers (FITs) book their flight tickets online because of the advanced global distribution system (GDS). This is likely to make online booking a big part of how people plan their trips in the China outbound tourism industry.

Social Media Sparks Surge in Experiential Leisure-oriented Trips

The leisure purpose is the top segment in the China outbound vacation market. Leisure is the top reason for travel, followed by visiting friends and relatives (VFR) and business trips.

The rise in disposable income among Chinese households has made leisure travel more accessible and affordable. Moreover, the growing influence of social media and digital platforms has contributed to the popularity of leisure travel. Travelers are inspired by online content showcasing exciting activities and unique experiences. This has prompted them to plan leisure-oriented trips.

Travelers have become more refined in their tastes as they explore new leisure experiences like beach resorts, skiing trips, and "staycations." Many senior travelers from China, aged 55-65, plan to spend their next leisure trip during the Chinese New Year holiday instead of celebrating at home with family.

For example, tourists from China see South Korea as a perfect destination. They visit for different reasons such as leisure, kimchi, Khan Steam, skiing, cosmetics, corporate trips, or attending concerts over the weekend.
Competitive Landscape

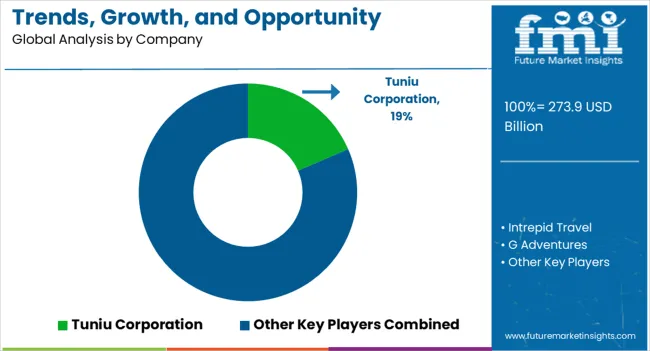
Outbound tourism industry players employ miscellaneous strategies to attract Chinese travelers and get a competitive edge. They highly focus on offering personalized travel experiences, such as customized itineraries and exclusive packages. They also capitalize on digital platforms for marketing and booking convenience. Some adopt competitive pricing strategies, while others prioritize customer service excellence and partnerships with local businesses for unique offerings.

Recent Developments

  • In February 2024, AVIAREPS, a prominent international representation, marketing, and communications company for the travel industry, partnered with the Shanghai Municipal Government to launch Shanghai's official online B2B travel platform, SmoothTravel. This platform serves as the official gateway, connecting the global travel industry with inbound and outbound Chinese travel agencies, tour wholesalers, online travel agencies (OTAs), and MICE agents in the East China market.
  • In December 2023, Fliggy, an online travel platform owned by Alibaba Group, announced a partnership with Choose Paris Region, a business growth and destination agency for the Paris Region. They plan to work closely on digital marketing and customer services. Together, they introduced the Fliggy x Paris Region Pass and Online Chinese Customer Service Center.
  • In September 2023, Go City, a global sightseeing pass company, launched its Weixin mini program on China's Weixin social media network. This allows users in Mainland China to easily explore, buy, and use Go City's sightseeing passes for over 30 cities globally.

Key China Outbound Tourism Industry Players

  • Tuniu Corporation
  • Intrepid Travel
  • G Adventures
  • TUI China
  • China Highlights
  • Exodus Travel
  • The Dragon Trip
  • World Expeditions
  • On The Go Tours
  • Contiki
  • Sita World Tours

Key Coverage in China Outbound Tourism Market Report

  • China Outbound Tourism Market Outlook and China Outbound Travel Market Forecast
  • China Outbound Travel Destinations
  • Outbound Tourism Preferences of China
  • China Tourists Abroad Market in Southeast Asia
  • China Outbound Tourist Spending in Australia, New Zealand, Africa, India, the United States, and Japan
  • Emerging Trends in China Outbound Travel

Key Segments Profiled in China Outbound Tourism Industry Survey

By Purpose:

  • Business
  • Leisure
  • VFR
  • Others

By Booking Channel:

  • Phone Booking
  • Online Booking
  • In Person Booking

By Tour Type:

  • Independent Traveler
  • Tour Group
  • Package Traveler

By Age Group:

  • 15-25 Years
  • 26-35 Years
  • 36-45 Years
  • 46-55 Years
  • 56-65 Years
  • 66-75 Years

Frequently Asked Questions

What is the Size of the Outbound Tourism Market in China?

The industry size for outbound tourism in China is forecasted to be worth US$ 239.38 billion in 2024.

What is the Sales Forecast for Outbound Tourism in China?

The market value of China’s outbound tourism is projected to surpass US$ 915.89 billion by 2034.

What is the Projected CAGR for China’s Outbound Tourism Industry?

The CAGR of China outbound travelers market is estimated to be around 14.40% through 2034.

What is the Outbound Tourism Statistics of China in 2023?

The outbound tourism industry from China was valued at US$ 209.80 billion in 2023.

What is the Industry Trend in China for Outbound Tourism?

Increased interest in experiential travel is a key industry trend.

Table of Content

1. Executive Summary

    1.1. Market Outlook

    1.2. Demand-side Trends

    1.3. Supply-side Trends

    1.4. Technology Roadmap Analysis

    1.5. Analysis and Recommendations

2. Market Overview

    2.1. Market Coverage / Taxonomy

    2.2. Market Definition / Scope / Limitations

3. Market Background

    3.1. Market Dynamics

        3.1.1. Drivers

        3.1.2. Restraints

        3.1.3. Opportunity

        3.1.4. Trends

    3.2. Scenario Forecast

        3.2.1. Demand in Optimistic Scenario

        3.2.2. Demand in Likely Scenario

        3.2.3. Demand in Conservative Scenario

    3.3. Opportunity Map Analysis

    3.4. Investment Feasibility Matrix

    3.5. PESTLE and Porter’s Analysis

    3.6. Regulatory Landscape

        3.6.1. By Key Regions

        3.6.2. By Key Countries

    3.7. Regional Parent Market Outlook

4. Market Analysis 2019 to 2023 and Forecast, 2024 to 2034

    4.1. Historical Market Size Value (US$ Million) Analysis, 2019 to 2023

    4.2. Current and Future Market Size Value (US$ Million) Projections, 2024 to 2034

        4.2.1. Y-o-Y Growth Trend Analysis

        4.2.2. Absolute $ Opportunity Analysis

5. Market Analysis 2019 to 2023 and Forecast 2024 to 2034, By Purpose

    5.1. Introduction / Key Findings

    5.2. Historical Market Size Value (US$ Million) Analysis By Purpose, 2019 to 2023

    5.3. Current and Future Market Size Value (US$ Million) Analysis and Forecast By Purpose, 2024 to 2034

        5.3.1. Business

        5.3.2. Leisure

        5.3.3. VFR

        5.3.4. Others

    5.4. Y-o-Y Growth Trend Analysis By Purpose, 2019 to 2023

    5.5. Absolute $ Opportunity Analysis By Purpose, 2024 to 2034

6. Market Analysis 2019 to 2023 and Forecast 2024 to 2034, By Booking Channel

    6.1. Introduction / Key Findings

    6.2. Historical Market Size Value (US$ Million) Analysis By Booking Channel, 2019 to 2023

    6.3. Current and Future Market Size Value (US$ Million) Analysis and Forecast By Booking Channel, 2024 to 2034

        6.3.1. Phone Booking

        6.3.2. Online Booking

        6.3.3. In Person Booking

    6.4. Y-o-Y Growth Trend Analysis By Booking Channel, 2019 to 2023

    6.5. Absolute $ Opportunity Analysis By Booking Channel, 2024 to 2034

7. Market Analysis 2019 to 2023 and Forecast 2024 to 2034, By Tour Type 

    7.1. Introduction / Key Findings

    7.2. Historical Market Size Value (US$ Million) Analysis By Tour Type, 2019 to 2023

    7.3. Current and Future Market Size Value (US$ Million) Analysis and Forecast By Tour Type, 2024 to 2034

        7.3.1. Independent Traveler

        7.3.2. Tour Group

        7.3.3. Package Traveller

    7.4. Y-o-Y Growth Trend Analysis By Tour Type, 2019 to 2023

    7.5. Absolute $ Opportunity Analysis By Tour Type, 2024 to 2034

8. Market Analysis 2019 to 2023 and Forecast 2024 to 2034, By Age Group

    8.1. Introduction / Key Findings

    8.2. Historical Market Size Value (US$ Million) Analysis By Age Group, 2019 to 2023

    8.3. Current and Future Market Size Value (US$ Million) Analysis and Forecast By Age Group, 2024 to 2034

        8.3.1. 15-25 Years

        8.3.2. 26-35 Years

        8.3.3. 36-45 Years

        8.3.4. 46-55 Years

        8.3.5. 56-65 Years

        8.3.6. 66-75 Years

        8.3.7. Above 75 Years

    8.4. Y-o-Y Growth Trend Analysis By Age Group, 2019 to 2023

    8.5. Absolute $ Opportunity Analysis By Age Group, 2024 to 2034

9. Market Analysis 2019 to 2023 and Forecast 2024 to 2034, By Region

    9.1. Introduction

    9.2. Historical Market Size Value (US$ Million) Analysis By Region, 2019 to 2023

    9.3. Current Market Size Value (US$ Million) Analysis and Forecast By Region, 2024 to 2034

        9.3.1. North (China)

        9.3.2. East (China)

        9.3.3. Central (China)

        9.3.4. South (China)

        9.3.5. West (China)

        9.3.6. North West (China)

    9.4. Market Attractiveness Analysis By Region

10. North (China) Market Analysis 2019 to 2023 and Forecast 2024 to 2034

    10.1. Historical Market Size Value (US$ Million) Trend Analysis By Market Taxonomy, 2019 to 2023

    10.2. Market Size Value (US$ Million) Forecast By Market Taxonomy, 2024 to 2034

        10.2.1. By Purpose

        10.2.2. By Booking Channel

        10.2.3. By Tour Type

        10.2.4. By Age Group

    10.3. Market Attractiveness Analysis

        10.3.1. By Purpose

        10.3.2. By Booking Channel

        10.3.3. By Tour Type

        10.3.4. By Age Group

    10.4. Key Takeaways

11. East (China) Market Analysis 2019 to 2023 and Forecast 2024 to 2034

    11.1. Historical Market Size Value (US$ Million) Trend Analysis By Market Taxonomy, 2019 to 2023

    11.2. Market Size Value (US$ Million) Forecast By Market Taxonomy, 2024 to 2034

        11.2.1. By Purpose

        11.2.2. By Booking Channel

        11.2.3. By Tour Type

        11.2.4. By Age Group

    11.3. Market Attractiveness Analysis

        11.3.1. By Purpose

        11.3.2. By Booking Channel

        11.3.3. By Tour Type

        11.3.4. By Age Group

    11.4. Key Takeaways

12. Central (China) Market Analysis 2019 to 2023 and Forecast 2024 to 2034

    12.1. Historical Market Size Value (US$ Million) Trend Analysis By Market Taxonomy, 2019 to 2023

    12.2. Market Size Value (US$ Million) Forecast By Market Taxonomy, 2024 to 2034

        12.2.1. By Purpose

        12.2.2. By Booking Channel

        12.2.3. By Tour Type

        12.2.4. By Age Group

    12.3. Market Attractiveness Analysis

        12.3.1. By Purpose

        12.3.2. By Booking Channel

        12.3.3. By Tour Type

        12.3.4. By Age Group

    12.4. Key Takeaways

13. South (China) Market Analysis 2019 to 2023 and Forecast 2024 to 2034

    13.1. Historical Market Size Value (US$ Million) Trend Analysis By Market Taxonomy, 2019 to 2023

    13.2. Market Size Value (US$ Million) Forecast By Market Taxonomy, 2024 to 2034

        13.2.1. By Purpose

        13.2.2. By Booking Channel

        13.2.3. By Tour Type

        13.2.4. By Age Group

    13.3. Market Attractiveness Analysis

        13.3.1. By Purpose

        13.3.2. By Booking Channel

        13.3.3. By Tour Type

        13.3.4. By Age Group

    13.4. Key Takeaways

14. West (China) Market Analysis 2019 to 2023 and Forecast 2024 to 2034

    14.1. Historical Market Size Value (US$ Million) Trend Analysis By Market Taxonomy, 2019 to 2023

    14.2. Market Size Value (US$ Million) Forecast By Market Taxonomy, 2024 to 2034

        14.2.1. By Purpose

        14.2.2. By Booking Channel

        14.2.3. By Tour Type

        14.2.4. By Age Group

    14.3. Market Attractiveness Analysis

        14.3.1. By Purpose

        14.3.2. By Booking Channel

        14.3.3. By Tour Type

        14.3.4. By Age Group

    14.4. Key Takeaways

15. North West (China) Market Analysis 2019 to 2023 and Forecast 2024 to 2034

    15.1. Historical Market Size Value (US$ Million) Trend Analysis By Market Taxonomy, 2019 to 2023

    15.2. Market Size Value (US$ Million) Forecast By Market Taxonomy, 2024 to 2034

        15.2.1. By Purpose

        15.2.2. By Booking Channel

        15.2.3. By Tour Type

        15.2.4. By Age Group

    15.3. Market Attractiveness Analysis

        15.3.1. By Purpose

        15.3.2. By Booking Channel

        15.3.3. By Tour Type

        15.3.4. By Age Group

    15.4. Key Takeaways

16. Market Structure Analysis

    16.1. Competition Dashboard

    16.2. Competition Benchmarking

    16.3. Market Share Analysis of Top Players

        16.3.1. By Regional

        16.3.2. By Purpose

        16.3.3. By Booking Channel

        16.3.4. By Tour Type

        16.3.5. By Age Group

17. Competition Analysis

    17.1. Competition Deep Dive

        17.1.1. Tuniu Corporation

            17.1.1.1. Overview

            17.1.1.2. Product Portfolio

            17.1.1.3. Profitability by Market Segments

            17.1.1.4. Sales Footprint

            17.1.1.5. Strategy Overview

                17.1.1.5.1. Marketing Strategy

        17.1.2. Intrepid Travel

            17.1.2.1. Overview

            17.1.2.2. Product Portfolio

            17.1.2.3. Profitability by Market Segments

            17.1.2.4. Sales Footprint

            17.1.2.5. Strategy Overview

                17.1.2.5.1. Marketing Strategy

        17.1.3. G Adventures

            17.1.3.1. Overview

            17.1.3.2. Product Portfolio

            17.1.3.3. Profitability by Market Segments

            17.1.3.4. Sales Footprint

            17.1.3.5. Strategy Overview

                17.1.3.5.1. Marketing Strategy

        17.1.4. TUI China

            17.1.4.1. Overview

            17.1.4.2. Product Portfolio

            17.1.4.3. Profitability by Market Segments

            17.1.4.4. Sales Footprint

            17.1.4.5. Strategy Overview

                17.1.4.5.1. Marketing Strategy

        17.1.5. China Highlights

            17.1.5.1. Overview

            17.1.5.2. Product Portfolio

            17.1.5.3. Profitability by Market Segments

            17.1.5.4. Sales Footprint

            17.1.5.5. Strategy Overview

                17.1.5.5.1. Marketing Strategy

        17.1.6. Exodus Travel

            17.1.6.1. Overview

            17.1.6.2. Product Portfolio

            17.1.6.3. Profitability by Market Segments

            17.1.6.4. Sales Footprint

            17.1.6.5. Strategy Overview

                17.1.6.5.1. Marketing Strategy

        17.1.7. The Dragon Trip

            17.1.7.1. Overview

            17.1.7.2. Product Portfolio

            17.1.7.3. Profitability by Market Segments

            17.1.7.4. Sales Footprint

            17.1.7.5. Strategy Overview

                17.1.7.5.1. Marketing Strategy

        17.1.8. World Expeditions

            17.1.8.1. Overview

            17.1.8.2. Product Portfolio

            17.1.8.3. Profitability by Market Segments

            17.1.8.4. Sales Footprint

            17.1.8.5. Strategy Overview

                17.1.8.5.1. Marketing Strategy

        17.1.9. On The Go Tours

            17.1.9.1. Overview

            17.1.9.2. Product Portfolio

            17.1.9.3. Profitability by Market Segments

            17.1.9.4. Sales Footprint

            17.1.9.5. Strategy Overview

                17.1.9.5.1. Marketing Strategy

        17.1.10. Contiki

            17.1.10.1. Overview

            17.1.10.2. Product Portfolio

            17.1.10.3. Profitability by Market Segments

            17.1.10.4. Sales Footprint

            17.1.10.5. Strategy Overview

                17.1.10.5.1. Marketing Strategy

        17.1.11. Sita World Tours

            17.1.11.1. Overview

            17.1.11.2. Product Portfolio

            17.1.11.3. Profitability by Market Segments

            17.1.11.4. Sales Footprint

            17.1.11.5. Strategy Overview

                17.1.11.5.1. Marketing Strategy

18. Assumptions & Acronyms Used

19. Research Methodology

Don't pay for what you don't need

Customize your report by selecting specific countries or regions and save 30%!

List of Tables

Table 1: Market Value (US$ Million) Forecast by Region, 2019 to 2034

Table 2: Market Value (US$ Million) Forecast by Purpose, 2019 to 2034

Table 3: Market Value (US$ Million) Forecast by Booking Channel, 2019 to 2034

Table 4: Market Value (US$ Million) Forecast by Tour Type, 2019 to 2034

Table 5: Market Value (US$ Million) Forecast by Age Group, 2019 to 2034

Table 6: North (China) Market Value (US$ Million) Forecast by Purpose, 2019 to 2034

Table 7: North (China) Market Value (US$ Million) Forecast by Booking Channel, 2019 to 2034

Table 8: North (China) Market Value (US$ Million) Forecast by Tour Type, 2019 to 2034

Table 9: North (China) Market Value (US$ Million) Forecast by Age Group, 2019 to 2034

Table 10: East (China) Market Value (US$ Million) Forecast by Purpose, 2019 to 2034

Table 11: East (China) Market Value (US$ Million) Forecast by Booking Channel, 2019 to 2034

Table 12: East (China) Market Value (US$ Million) Forecast by Tour Type, 2019 to 2034

Table 13: East (China) Market Value (US$ Million) Forecast by Age Group, 2019 to 2034

Table 14: Central (China) Market Value (US$ Million) Forecast by Purpose, 2019 to 2034

Table 15: Central (China) Market Value (US$ Million) Forecast by Booking Channel, 2019 to 2034

Table 16: Central (China) Market Value (US$ Million) Forecast by Tour Type, 2019 to 2034

Table 17: Central (China) Market Value (US$ Million) Forecast by Age Group, 2019 to 2034

Table 18: South (China) Market Value (US$ Million) Forecast by Purpose, 2019 to 2034

Table 19: South (China) Market Value (US$ Million) Forecast by Booking Channel, 2019 to 2034

Table 20: South (China) Market Value (US$ Million) Forecast by Tour Type, 2019 to 2034

Table 21: South (China) Market Value (US$ Million) Forecast by Age Group, 2019 to 2034

Table 22: West (China) Market Value (US$ Million) Forecast by Purpose, 2019 to 2034

Table 23: West (China) Market Value (US$ Million) Forecast by Booking Channel, 2019 to 2034

Table 24: West (China) Market Value (US$ Million) Forecast by Tour Type, 2019 to 2034

Table 25: West (China) Market Value (US$ Million) Forecast by Age Group, 2019 to 2034

Table 26: North West (China) Market Value (US$ Million) Forecast by Purpose, 2019 to 2034

Table 27: North West (China) Market Value (US$ Million) Forecast by Booking Channel, 2019 to 2034

Table 28: North West (China) Market Value (US$ Million) Forecast by Tour Type, 2019 to 2034

Table 29: North West (China) Market Value (US$ Million) Forecast by Age Group, 2019 to 2034
Ronak Shah
Ronak Shah

Principal Consultant

Talk to Analyst

Find your sweet spots for generating winning opportunities in this market.

List of Charts

Figure 1: Market Value (US$ Million) by Purpose, 2024 to 2034

Figure 2: Market Value (US$ Million) by Booking Channel, 2024 to 2034

Figure 3: Market Value (US$ Million) by Tour Type, 2024 to 2034

Figure 4: Market Value (US$ Million) by Age Group, 2024 to 2034

Figure 5: Market Value (US$ Million) by Region, 2024 to 2034

Figure 6: Market Value (US$ Million) Analysis by Region, 2019 to 2034

Figure 7: Market Value Share (%) and BPS Analysis by Region, 2024 to 2034

Figure 8: Market Y-o-Y Growth (%) Projections by Region, 2024 to 2034

Figure 9: Market Value (US$ Million) Analysis by Purpose, 2019 to 2034

Figure 10: Market Value Share (%) and BPS Analysis by Purpose, 2024 to 2034

Figure 11: Market Y-o-Y Growth (%) Projections by Purpose, 2024 to 2034

Figure 12: Market Value (US$ Million) Analysis by Booking Channel, 2019 to 2034

Figure 13: Market Value Share (%) and BPS Analysis by Booking Channel, 2024 to 2034

Figure 14: Market Y-o-Y Growth (%) Projections by Booking Channel, 2024 to 2034

Figure 15: Market Value (US$ Million) Analysis by Tour Type, 2019 to 2034

Figure 16: Market Value Share (%) and BPS Analysis by Tour Type, 2024 to 2034

Figure 17: Market Y-o-Y Growth (%) Projections by Tour Type, 2024 to 2034

Figure 18: Market Value (US$ Million) Analysis by Age Group, 2019 to 2034

Figure 19: Market Value Share (%) and BPS Analysis by Age Group, 2024 to 2034

Figure 20: Market Y-o-Y Growth (%) Projections by Age Group, 2024 to 2034

Figure 21: Market Attractiveness by Purpose, 2024 to 2034

Figure 22: Market Attractiveness by Booking Channel, 2024 to 2034

Figure 23: Market Attractiveness by Tour Type, 2024 to 2034

Figure 24: Market Attractiveness by Age Group, 2024 to 2034

Figure 25: Market Attractiveness by Region, 2024 to 2034

Figure 26: North (China) Market Value (US$ Million) by Purpose, 2024 to 2034

Figure 27: North (China) Market Value (US$ Million) by Booking Channel, 2024 to 2034

Figure 28: North (China) Market Value (US$ Million) by Tour Type, 2024 to 2034

Figure 29: North (China) Market Value (US$ Million) by Age Group, 2024 to 2034

Figure 30: North (China) Market Value (US$ Million) Analysis by Purpose, 2019 to 2034

Figure 31: North (China) Market Value Share (%) and BPS Analysis by Purpose, 2024 to 2034

Figure 32: North (China) Market Y-o-Y Growth (%) Projections by Purpose, 2024 to 2034

Figure 33: North (China) Market Value (US$ Million) Analysis by Booking Channel, 2019 to 2034

Figure 34: North (China) Market Value Share (%) and BPS Analysis by Booking Channel, 2024 to 2034

Figure 35: North (China) Market Y-o-Y Growth (%) Projections by Booking Channel, 2024 to 2034

Figure 36: North (China) Market Value (US$ Million) Analysis by Tour Type, 2019 to 2034

Figure 37: North (China) Market Value Share (%) and BPS Analysis by Tour Type, 2024 to 2034

Figure 38: North (China) Market Y-o-Y Growth (%) Projections by Tour Type, 2024 to 2034

Figure 39: North (China) Market Value (US$ Million) Analysis by Age Group, 2019 to 2034

Figure 40: North (China) Market Value Share (%) and BPS Analysis by Age Group, 2024 to 2034

Figure 41: North (China) Market Y-o-Y Growth (%) Projections by Age Group, 2024 to 2034

Figure 42: North (China) Market Attractiveness by Purpose, 2024 to 2034

Figure 43: North (China) Market Attractiveness by Booking Channel, 2024 to 2034

Figure 44: North (China) Market Attractiveness by Tour Type, 2024 to 2034

Figure 45: North (China) Market Attractiveness by Age Group, 2024 to 2034

Figure 46: East (China) Market Value (US$ Million) by Purpose, 2024 to 2034

Figure 47: East (China) Market Value (US$ Million) by Booking Channel, 2024 to 2034

Figure 48: East (China) Market Value (US$ Million) by Tour Type, 2024 to 2034

Figure 49: East (China) Market Value (US$ Million) by Age Group, 2024 to 2034

Figure 50: East (China) Market Value (US$ Million) Analysis by Purpose, 2019 to 2034

Figure 51: East (China) Market Value Share (%) and BPS Analysis by Purpose, 2024 to 2034

Figure 52: East (China) Market Y-o-Y Growth (%) Projections by Purpose, 2024 to 2034

Figure 53: East (China) Market Value (US$ Million) Analysis by Booking Channel, 2019 to 2034

Figure 54: East (China) Market Value Share (%) and BPS Analysis by Booking Channel, 2024 to 2034

Figure 55: East (China) Market Y-o-Y Growth (%) Projections by Booking Channel, 2024 to 2034

Figure 56: East (China) Market Value (US$ Million) Analysis by Tour Type, 2019 to 2034

Figure 57: East (China) Market Value Share (%) and BPS Analysis by Tour Type, 2024 to 2034

Figure 58: East (China) Market Y-o-Y Growth (%) Projections by Tour Type, 2024 to 2034

Figure 59: East (China) Market Value (US$ Million) Analysis by Age Group, 2019 to 2034

Figure 60: East (China) Market Value Share (%) and BPS Analysis by Age Group, 2024 to 2034

Figure 61: East (China) Market Y-o-Y Growth (%) Projections by Age Group, 2024 to 2034

Figure 62: East (China) Market Attractiveness by Purpose, 2024 to 2034

Figure 63: East (China) Market Attractiveness by Booking Channel, 2024 to 2034

Figure 64: East (China) Market Attractiveness by Tour Type, 2024 to 2034

Figure 65: East (China) Market Attractiveness by Age Group, 2024 to 2034

Figure 66: Central (China) Market Value (US$ Million) by Purpose, 2024 to 2034

Figure 67: Central (China) Market Value (US$ Million) by Booking Channel, 2024 to 2034

Figure 68: Central (China) Market Value (US$ Million) by Tour Type, 2024 to 2034

Figure 69: Central (China) Market Value (US$ Million) by Age Group, 2024 to 2034

Figure 70: Central (China) Market Value (US$ Million) Analysis by Purpose, 2019 to 2034

Figure 71: Central (China) Market Value Share (%) and BPS Analysis by Purpose, 2024 to 2034

Figure 72: Central (China) Market Y-o-Y Growth (%) Projections by Purpose, 2024 to 2034

Figure 73: Central (China) Market Value (US$ Million) Analysis by Booking Channel, 2019 to 2034

Figure 74: Central (China) Market Value Share (%) and BPS Analysis by Booking Channel, 2024 to 2034

Figure 75: Central (China) Market Y-o-Y Growth (%) Projections by Booking Channel, 2024 to 2034

Figure 76: Central (China) Market Value (US$ Million) Analysis by Tour Type, 2019 to 2034

Figure 77: Central (China) Market Value Share (%) and BPS Analysis by Tour Type, 2024 to 2034

Figure 78: Central (China) Market Y-o-Y Growth (%) Projections by Tour Type, 2024 to 2034

Figure 79: Central (China) Market Value (US$ Million) Analysis by Age Group, 2019 to 2034

Figure 80: Central (China) Market Value Share (%) and BPS Analysis by Age Group, 2024 to 2034

Figure 81: Central (China) Market Y-o-Y Growth (%) Projections by Age Group, 2024 to 2034

Figure 82: Central (China) Market Attractiveness by Purpose, 2024 to 2034

Figure 83: Central (China) Market Attractiveness by Booking Channel, 2024 to 2034

Figure 84: Central (China) Market Attractiveness by Tour Type, 2024 to 2034

Figure 85: Central (China) Market Attractiveness by Age Group, 2024 to 2034

Figure 86: South (China) Market Value (US$ Million) by Purpose, 2024 to 2034

Figure 87: South (China) Market Value (US$ Million) by Booking Channel, 2024 to 2034

Figure 88: South (China) Market Value (US$ Million) by Tour Type, 2024 to 2034

Figure 89: South (China) Market Value (US$ Million) by Age Group, 2024 to 2034

Figure 90: South (China) Market Value (US$ Million) Analysis by Purpose, 2019 to 2034

Figure 91: South (China) Market Value Share (%) and BPS Analysis by Purpose, 2024 to 2034

Figure 92: South (China) Market Y-o-Y Growth (%) Projections by Purpose, 2024 to 2034

Figure 93: South (China) Market Value (US$ Million) Analysis by Booking Channel, 2019 to 2034

Figure 94: South (China) Market Value Share (%) and BPS Analysis by Booking Channel, 2024 to 2034

Figure 95: South (China) Market Y-o-Y Growth (%) Projections by Booking Channel, 2024 to 2034

Figure 96: South (China) Market Value (US$ Million) Analysis by Tour Type, 2019 to 2034

Figure 97: South (China) Market Value Share (%) and BPS Analysis by Tour Type, 2024 to 2034

Figure 98: South (China) Market Y-o-Y Growth (%) Projections by Tour Type, 2024 to 2034

Figure 99: South (China) Market Value (US$ Million) Analysis by Age Group, 2019 to 2034

Figure 100: South (China) Market Value Share (%) and BPS Analysis by Age Group, 2024 to 2034

Figure 101: South (China) Market Y-o-Y Growth (%) Projections by Age Group, 2024 to 2034

Figure 102: South (China) Market Attractiveness by Purpose, 2024 to 2034

Figure 103: South (China) Market Attractiveness by Booking Channel, 2024 to 2034

Figure 104: South (China) Market Attractiveness by Tour Type, 2024 to 2034

Figure 105: South (China) Market Attractiveness by Age Group, 2024 to 2034

Figure 106: West (China) Market Value (US$ Million) by Purpose, 2024 to 2034

Figure 107: West (China) Market Value (US$ Million) by Booking Channel, 2024 to 2034

Figure 108: West (China) Market Value (US$ Million) by Tour Type, 2024 to 2034

Figure 109: West (China) Market Value (US$ Million) by Age Group, 2024 to 2034

Figure 110: West (China) Market Value (US$ Million) Analysis by Purpose, 2019 to 2034

Figure 111: West (China) Market Value Share (%) and BPS Analysis by Purpose, 2024 to 2034

Figure 112: West (China) Market Y-o-Y Growth (%) Projections by Purpose, 2024 to 2034

Figure 113: West (China) Market Value (US$ Million) Analysis by Booking Channel, 2019 to 2034

Figure 114: West (China) Market Value Share (%) and BPS Analysis by Booking Channel, 2024 to 2034

Figure 115: West (China) Market Y-o-Y Growth (%) Projections by Booking Channel, 2024 to 2034

Figure 116: West (China) Market Value (US$ Million) Analysis by Tour Type, 2019 to 2034

Figure 117: West (China) Market Value Share (%) and BPS Analysis by Tour Type, 2024 to 2034

Figure 118: West (China) Market Y-o-Y Growth (%) Projections by Tour Type, 2024 to 2034

Figure 119: West (China) Market Value (US$ Million) Analysis by Age Group, 2019 to 2034

Figure 120: West (China) Market Value Share (%) and BPS Analysis by Age Group, 2024 to 2034

Figure 121: West (China) Market Y-o-Y Growth (%) Projections by Age Group, 2024 to 2034

Figure 122: West (China) Market Attractiveness by Purpose, 2024 to 2034

Figure 123: West (China) Market Attractiveness by Booking Channel, 2024 to 2034

Figure 124: West (China) Market Attractiveness by Tour Type, 2024 to 2034

Figure 125: West (China) Market Attractiveness by Age Group, 2024 to 2034

Figure 126: North West (China) Market Value (US$ Million) by Purpose, 2024 to 2034

Figure 127: North West (China) Market Value (US$ Million) by Booking Channel, 2024 to 2034

Figure 128: North West (China) Market Value (US$ Million) by Tour Type, 2024 to 2034

Figure 129: North West (China) Market Value (US$ Million) by Age Group, 2024 to 2034

Figure 130: North West (China) Market Value (US$ Million) Analysis by Purpose, 2019 to 2034

Figure 131: North West (China) Market Value Share (%) and BPS Analysis by Purpose, 2024 to 2034

Figure 132: North West (China) Market Y-o-Y Growth (%) Projections by Purpose, 2024 to 2034

Figure 133: North West (China) Market Value (US$ Million) Analysis by Booking Channel, 2019 to 2034

Figure 134: North West (China) Market Value Share (%) and BPS Analysis by Booking Channel, 2024 to 2034

Figure 135: North West (China) Market Y-o-Y Growth (%) Projections by Booking Channel, 2024 to 2034

Figure 136: North West (China) Market Value (US$ Million) Analysis by Tour Type, 2019 to 2034

Figure 137: North West (China) Market Value Share (%) and BPS Analysis by Tour Type, 2024 to 2034

Figure 138: North West (China) Market Y-o-Y Growth (%) Projections by Tour Type, 2024 to 2034

Figure 139: North West (China) Market Value (US$ Million) Analysis by Age Group, 2019 to 2034

Figure 140: North West (China) Market Value Share (%) and BPS Analysis by Age Group, 2024 to 2034

Figure 141: North West (China) Market Y-o-Y Growth (%) Projections by Age Group, 2024 to 2034

Figure 142: North West (China) Market Attractiveness by Purpose, 2024 to 2034

Figure 143: North West (China) Market Attractiveness by Booking Channel, 2024 to 2034

Figure 144: North West (China) Market Attractiveness by Tour Type, 2024 to 2034

Figure 145: North West (China) Market Attractiveness by Age Group, 2024 to 2034

Recommendations

Explore Travel and Tourism Insights

View Reports

Trends, Growth, and Opportunity Analysis of Outbound Tourism in China