Boxboard Packaging Market Size and Forecast Outlook 2025 to 2035

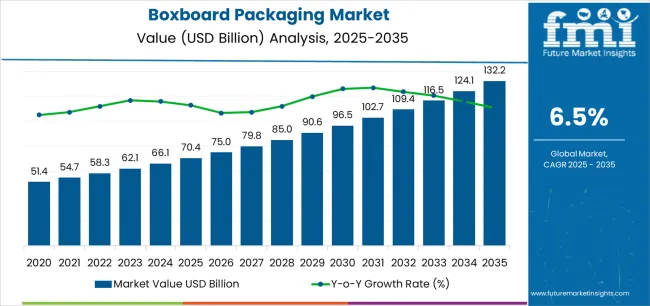
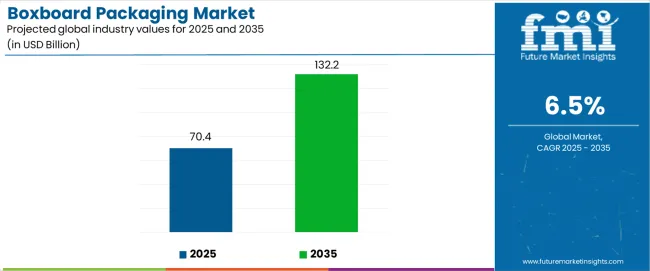
The global boxboard packaging market is projected to grow from USD 38.7 billion in 2025 to USD 59.5 billion by 2035, expanding at a steady CAGR of 4.4%. This growth is underpinned by increasing demand for lightweight, cost-effective, and sustainable packaging solutions across multiple sectors, particularly food and beverages, personal care, and e-commerce.

The industry’s 2024 valuation stood at USD 37.5 billion, with incremental opportunities anticipated to exceed USD 22 billion by the end of the forecast period. Boxes are expected to remain the dominant packaging format, accounting for over 44% of industry share by 2035, while recovered paper will continue to lead as the primary material due to its sustainability and cost-efficiency.

The primary growth driver for the industry is the surging demand for sustainable and visually appealing packaging, especially for premium food, beverage, and cosmetic products. The rise of e-commerce and direct-to-consumer models has further fueled the need for packaging that ensures product protection while optimizing supply chain efficiency.

In regions like Asia Pacific and South Asia, rapid urbanization and rising disposable incomes are accelerating the adoption of boxboard for FMCG and electronics packaging. Additionally, regulatory frameworks promoting plastic alternatives are pushing manufacturers to innovate with eco-friendly boxboard solutions that align with both consumer values and environmental compliance.

Government regulations in the boxboard packaging market are increasingly centered around sustainability, recyclability, and environmental compliance. Many countries have implemented stringent laws aimed at reducing plastic waste, pushing manufacturers to adopt paper-based alternatives like boxboard. In the European Union, directives such as the Packaging and Packaging Waste Directive mandate the use of recyclable materials and set recovery and recycling targets for packaging waste.

Similarly, in the United States, the Environmental Protection Agency (EPA) encourages the adoption of sustainable packaging through extended producer responsibility (EPR) frameworks. Countries like Germany, Japan, and Canada have also introduced labeling requirements, FSC certification standards, and producer take-back obligations to ensure transparency and environmental stewardship.

These evolving regulatory norms are prompting companies to innovate with biodegradable materials, use recovered paper, and adopt closed-loop recycling systems to remain compliant while catering to eco-conscious consumers.

Metric Value
Industry Size (2025E) USD 38.7 billion
Industry Value (2035F) USD 59.5 billion
CAGR (2025 to 2035) 4.4%

Boxboard Packaging Market Analysis by Top Investment Segments

The industry is segmented by material type into pulp bleached, bleached chemical, recovered paper, and others (including molded pulp and virgin fiber). By grammage weight, the industry is categorized into 160 gsm to 200 gsm, 201 gsm to 300 gsm, and above 301 gsm. In terms of packaging type, the key segments include boxes, cartons, trays, and other packaging types (sleeves, clamshells, wraps, partitions, and slipcases).

By end use, the industry is divided into food & beverages, personal care & cosmetics, household, food service, tobacco/cigarette, and other higher-end/general packaging (electronics, luxury goods, gift items, stationery, and specialty retail products). Regionally, the industry analysis covers North America, Latin America, East Asia, South Asia & Pacific, Western Europe, Eastern Europe, and the Middle East & Africa.

Boxboard Packaging Market Analysis by Material Type

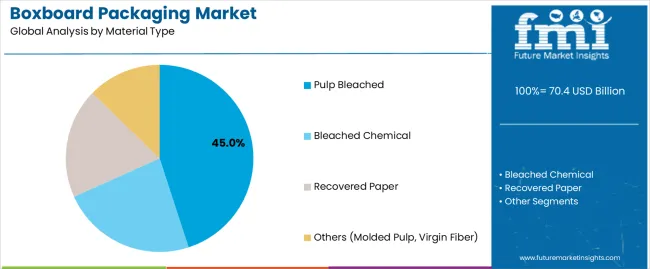
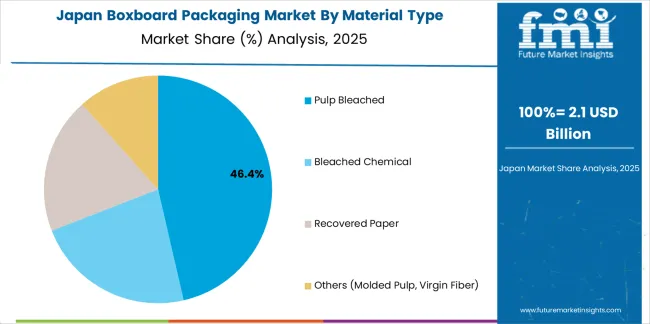
By material type, the industry is led by recovered paper, which is projected to reach a value of USD 27.8 billion by 2025 and expand at a CAGR of 4.9% from 2025 to 2035. Its dominance is attributed to growing sustainability mandates and cost advantages, as it is derived from recycled content, reducing dependency on virgin resources. Recovered paper is widely adopted across the FMCG, food, and e-commerce sectors due to its environmental appeal and alignment with circular economy principles.

Pulp bleachedis expected to grow at a considerable CAGR, driven by demand in premium packaging segments where brightness, printability, and visual aesthetics are critical, especially in cosmetics and luxury retail. Bleached chemical pulp is primarily used in pharmaceutical and food packaging due to its superior fiber strength and hygienic finish.

Meanwhile, the ‘others’ segment, including molded pulp and virgin fiber benefits from innovation in biodegradable molded formats and premium applications of virgin fiber, although growth is somewhat limited by higher input costs and resource-intensive processing.

Material Type CAGR (2025 to 2035)
Recovered Paper 4.9%

Boxboard Packaging Market Analysis by Grammage Weight

By grammage weight, the 201 gsm to 300 gsm segment dominates the industry and is projected to be valued at USD 22.5 billion in 2025, growing at a CAGR of 4.6% through 2035. This mid-weight range is preferred for folding cartons and retail packaging, offering the ideal balance of strength, flexibility, and cost, making it suitable for food, cosmetics, and pharmaceutical applications. The 160 gsm to 200 gsm segment is driven by demand for lightweight packaging solutions in the personal care and food service sectors.

However, it faces limitations in terms of structural durability, restricting its use in heavy-duty applications. The above 301 gsm segmentis forecast to grow at a considerable CAGR, primarily supported by demand in premium and protective packaging, including electronics and high-end consumer goods. While offering superior rigidity and product protection, its higher production cost can act as a growth barrier in cost-sensitive markets.

Grammage Weight CAGR (2025 to 2035)
201gsm to 300gsm 4.6%

Boxboard Packaging Market Analysis by Packaging Type

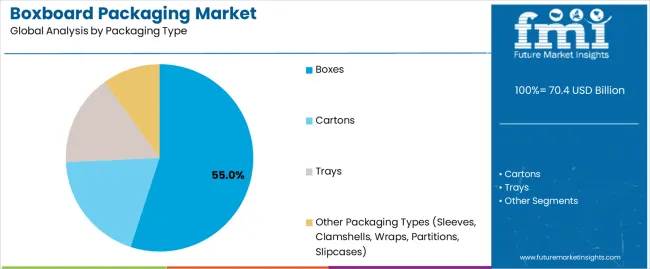
By packaging type, boxes are projected to lead the industry with a value of USD 17.4 billion in 2025 and a CAGR of 4.8% through 2035. Their dominance is attributed to high structural integrity, cost-effectiveness, and broad applicability across e-commerce, retail, and FMCG sectors. Boxes are preferred for their durability, stackability, and large printable surface area, making them ideal for branding and efficient logistics. Cartons are expected to grow at a significant CAGR during the study period.

They are widely used in food, pharmaceutical, and personal care packaging due to their lightweight profile and versatility in design, although they offer less strength than boxes. Traysare primarily used in ready-to-eat meals and perishables; however, limited reusability and exposure risks restrain their expansion. Other packaging types, including sleeves, clamshells, and wraps, are driven by niche applications in specialty foods, electronics, and luxury packaging, although customization costs and lower volume demand may limit broader adoption.

Packaging Type CAGR (2025 to 2035)
Boxes 4.8%

Boxboard Packaging Market Analysis by End Use

By end use, the food & beverages segment is projected to dominate the industry with a value of USD 15.8 billion in 2025, growing at a CAGR of 4.9% through 2035, driven by high consumption of packaged food, frozen items, and ready-to-eat meals, which demand durable, moisture-resistant, and sustainable packaging. The personal care & cosmetics segment is supported by rising demand for visually appealing, lightweight packaging that aligns with premium and eco-conscious branding. Household applications are fueled by the use of boxboard for packaging, cleaning, and utility items, though growth is moderate due to limited differentiation needs.

The food service segment, benefits from the shift to disposable, recyclable takeaway containers. Tobacco/cigarette packaging is limited by regulatory constraints but supported by luxury packaging demand. Other higher-end/general packaging, including electronics and gift items, is forecasted to expand at a considerable CAGR during the study period due to rising demand for sturdy, customizable, and aesthetically refined packaging in premium product categories.

End Use CAGR (2025 to 2035)
Food & Beverages 4.9%

Boxboard Packaging Market Analysis by Top Countries

United States

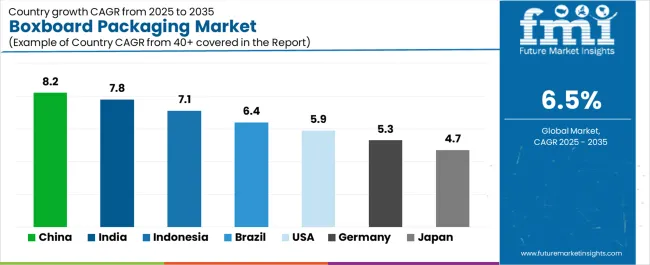
The United States is the largest and most mature industry for boxboard packaging, projected to reach a value of USD 8.7 billion in 2025 and grow to approximately USD 13.6 billion by 2035, registering a CAGR of 4.6%. Growth is driven by strong demand from food and beverage companies, online retail giants, and premium personal care brands. E-commerce continues to be a major catalyst, with consumers expecting packaging that is protective, sustainable, and visually appealing.

The USA regulatory landscape, including Extended Producer Responsibility (EPR) laws in several states, is pushing businesses to shift to recyclable and biodegradable boxboard formats. Furthermore, brand owners are leveraging advanced printing and structural design capabilities to enhance shelf impact.

High consumer purchasing power and the presence of leading boxboard manufacturers such as WestRock and International Paper strengthen the country’s dominance. Increased demand for eco-friendly alternatives to plastic packaging further supports the consistent expansion of the USA industry.

Country CAGR (2025 to 2035)
United States 4.6%

China

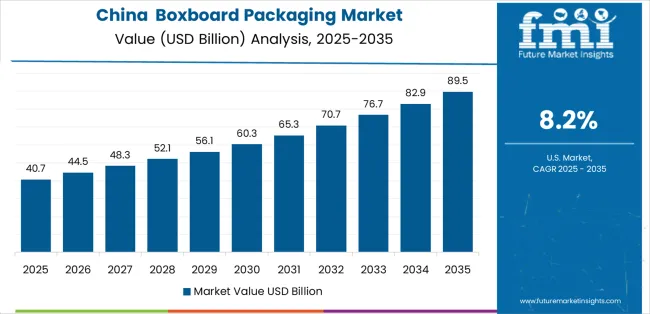
China is poised to be one of the fastest-growing markets for boxboard packaging, with its industry expected to reach USD 7.9 billion in 2025 and expand to USD 13.8 billion by 2035, reflecting a CAGR of 5.9%. This growth is fueled by the rapid expansion of the e-commerce industry, the growing consumer packaged goods sector, and increasing preference for sustainable packaging. Government initiatives aimed at reducing plastic use and encouraging the adoption of recyclable alternatives are pushing manufacturers to invest in paper-based materials like boxboard.

Additionally, the country’s booming middle-class population is driving demand for packaged food, personal care, and electronics, all key sectors that utilize boxboard packaging extensively. Chinese firms are increasingly focusing on automation and smart packaging solutions, supported by domestic production of bleached chemical pulp and recovered paper. Major cities like Shanghai and Guangzhou are at the forefront of sustainability transitions, prompting greater uptake of recycled boxboard products for urban retail and logistics networks.

Country CAGR (2025 to 2035)
China 5.9%

Germany

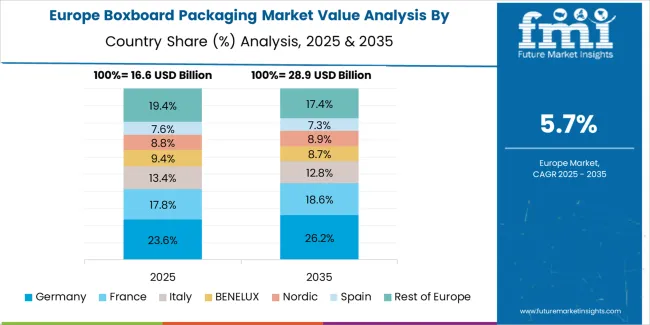
Germany is one of the most prominent cardboard packaging markets in Europe, valued at USD 4.3 billion in 2025 and forecast to reach USD 6.9 billion by 2035, expanding at a CAGR of 4.8%. The country’s strong industrial base, combined with advanced recycling infrastructure and stringent environmental regulations, makes it a leading adopter of sustainable packaging. Boxboard packaging is widely used across the food, cosmetics, and pharmaceutical sectors, driven by Germany’s eco-conscious consumers and well-regulated retail landscape.

The shift away from single-use plastics, in compliance with EU directives and national laws, has accelerated the replacement of plastic containers with recyclable paper-based formats. Germany also houses several major packaging firms, including subsidiaries of Stora Enso, Mondi, and Smurfit Kappa, that continue to invest in recyclable, high-barrier coated boxboard solutions. Moreover, innovative applications like smart packaging with traceability and anti-counterfeiting features are gaining momentum in pharmaceutical and luxury goods packaging segments, further boosting boxboard demand.

Country CAGR (2025 to 2035)
Germany 4.8%

India

India's boxboard packaging market is experiencing rapid expansion, driven by rising urbanization, increased consumption of packaged goods, and a booming e-commerce industry. The industry is projected to reach USD 3.6 billion in 2025 and is expected to grow to USD 6.6 billion by 2035, reflecting a robust CAGR of 6.2%. Food and beverage, personal care, and pharmaceuticals are the primary demand centers, where boxboard is favored for its recyclability, printability, and ability to withstand handling in long distribution chains.

With rising environmental awareness and regulatory emphasis on sustainable alternatives to plastic, the demand for recovered paper-based boxboard is growing. Start-ups and major brands alike are turning to lightweight, customizable boxboard solutions to improve both customer experience and sustainability metrics. The rise of organized retail and packaged food delivery services in cities like Mumbai, Delhi, and Bengaluru has further amplified industry growth. Government initiatives like Swachh Bharat Abhiyan and policies encouraging waste paper recovery are also supporting this sector's development.

Country CAGR (2025 to 2035)
India 6.2%

Japan

Japan's boxboard packaging market is expected to reach a valuation of USD 3.1 billion in 2025 and grow to USD 4.5 billion by 2035, registering a CAGR of 3.7%. The country’s highly developed consumer goods, electronics, and cosmetics sectors are major contributors to the demand for high-quality, aesthetically appealing, and protective packaging. Japanese consumers prioritize neatness, brand integrity, and sustainability, making boxboard an ideal choice due to its recyclability, smooth surface finish, and superior print compatibility.

Brands in Japan are increasingly shifting to biodegradable and compostable boxboard packaging, especially in response to the Plastic Resource Circulation Act and other national sustainability goals. Furthermore, Japan’s emphasis on compact, space-efficient packaging aligns well with the properties of boxboard cartons and trays. Premium and gift packaging also plays a key role in product differentiation in the retail space, with Japanese manufacturers innovating in custom boxboard formats that enhance user experience while maintaining eco-conscious design.

Country CAGR (2025 to 2035)
Japan 3.7%

Brazil

Brazil represents the most dynamic boxboard packaging market in Latin America, with the industry projected to reach USD 2.9 billion in 2025 and expand to USD 5.3 billion by 2035, registering a strong CAGR of 6.3%. Growth is primarily driven by the country’s expanding food and beverage industry, fast-moving consumer goods (FMCG), and rising urban retail activity. With increasing demand for packaged snacks, frozen food, and personal care products, manufacturers are turning to boxboard for its versatility, lightweight strength, and sustainable appeal.

The Brazilian government’s environmental regulations and growing corporate social responsibility among brands are leading to wider adoption of recycled paperboard solutions. Domestic companies and multinational packaging providers are also investing in automation and high-speed boxboard production lines to meet demand from both local and export markets. The shift away from plastic and Styrofoam, especially in food service and retail packaging, has further reinforced boxboard’s position as a cost-effective and eco-friendly alternative.

Country CAGR (2025 to 2035)
Brazil 6.3%

United Kingdom

The United Kingdom's boxboard packaging market is projected to be valued at USD 2.7 billion in 2025 and is expected to grow to USD 4.2 billion by 2035, registering a CAGR of 4.5%. The country’s strong regulatory framework on sustainability, including the UK Plastic Packaging Tax and extended producer responsibility (EPR) schemes, is pushing brands to transition from plastic to fiber-based alternatives like boxboard. Major retail chains and FMCG brands are adopting recyclable boxboard packaging to align with consumer expectations for environmentally responsible products.

The UK's premium food, cosmetics, and personal care industries rely heavily on coated and high-quality boxboard for retail display and brand impact. E-commerce growth in the UK is also influencing the demand for lightweight, protective boxboard packaging that performs well in last-mile delivery. Furthermore, local players are investing in advanced printing and die-cutting technologies to produce customized and branded solutions, strengthening the competitiveness of UK-based manufacturers in both domestic and export markets.

Country CAGR (2025 to 2035)
United Kingdom 4.5%

France

France’s boxboard packaging market is forecast to reach USD 2.5 billion in 2025 and grow to USD 4.0 billion by 2035, registering a CAGR of 4.7%. The country’s packaging sector is undergoing a significant transformation driven by strict environmental regulations, such as the Anti-Waste Law for a Circular Economy (AGEC), which restricts single-use plastics and mandates higher recycling rates. This shift has created strong demand for recyclable and biodegradable materials, positioning boxboard as a preferred solution across food, cosmetics, and retail segments.

France’s robust wine, gourmet food, and high-end cosmetics industries also require premium, visually appealing packaging, which is well served by high-grade coated boxboard. Additionally, consumer preferences are tilting toward eco-conscious products, prompting retailers and manufacturers to adopt FSC-certified and post-consumer recycled paperboard formats. Innovations in digital printing and smart packaging have further enhanced the appeal of boxboard solutions. The country also benefits from a strong local manufacturing base that supports sustainable production and closed-loop recycling systems.

Country CAGR (2025 to 2035)
France 4.7%

Canada

Canada’s boxboard packaging market is set to reach USD 2.2 billion in 2025 and is projected to grow to USD 3.5 billion by 2035, recording a CAGR of 4.7%. The country’s packaging industry is evolving rapidly due to increasing consumer awareness about sustainability and strong government initiatives, including the Single-Use Plastics Prohibition Regulations. These regulations, along with enhanced provincial waste management programs and corporate sustainability pledges, are driving a steady shift from plastic to recyclable and biodegradable packaging formats such as boxboard.

The food, beverage, and healthcare sectors are major end users, with demand also rising in e-commerce and personal care. Canadian consumers are particularly responsive to clean-label, eco-conscious branding, leading manufacturers to prioritize coated boxboard options that offer visual appeal and functionality. Investment in digital print technologies and lightweight fiber solutions further supports growth. In addition, collaborations between packaging firms and waste recovery organizations are helping improve the circularity of materials across the Canadian value chain.

Country CAGR (2025 to 2035)
Canada 4.7%

Italy

Italy’s boxboard packaging market is anticipated to reach USD 2.1 billion in 2025 and grow to approximately USD 3.3 billion by 2035, reflecting a CAGR of 4.6%. As a key player in Europe’s premium manufacturing and design ecosystem, Italy’s demand for high-quality, visually appealing, and sustainable packaging continues to rise. Boxboard is widely used in the country’s luxury fashion, cosmetics, wine, and confectionery sectors, where packaging plays a critical role in brand positioning and consumer experience.

The adoption of recyclable and FSC-certified materials has surged due to increasing compliance with EU Green Deal policies and national circular economy goals. Italian converters and packaging manufacturers are investing in advanced die-cutting, embossing, and UV-coating technologies to deliver sophisticated boxboard solutions that meet both aesthetic and environmental expectations. Additionally, artisanal and boutique brands in Italy are leveraging custom boxboard packaging as a differentiator, further expanding the use of high-grade paperboard across B2C and premium retail segments.

Country CAGR (2025 to 2035)
Italy 4.6%

Boxboard Packaging Market Players’ Share and Strategy Analysis

Company Estimated Market Share (2025)
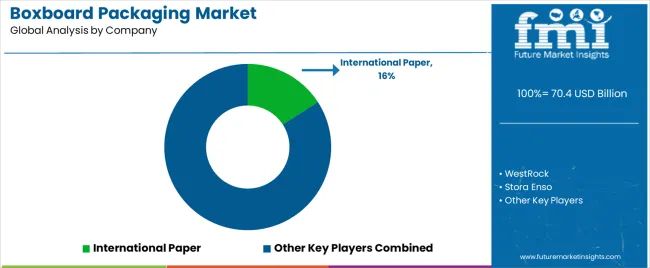
International Paper Company 15%
WestRock Company 13%
Smurfit Kappa Group plc 10%
Mondi Group 7%
Stora Enso Oyj 7%

The global industry, the top five companies, International Paper Company, WestRock Company, Smurfit Kappa Group plc, Mondi Group, and Stora Enso Oyj, collectively account for approximately 52-55% of the total industry share as of 2025. International Paper leads the industry with an estimated share of around 15%, leveraging its vast global footprint and vertical integration.

WestRock follows closely with 13%, supported by its broad product portfolio and strong presence in North American and European markets. Smurfit Kappa holds nearly 10%, while Mondi and Stora Enso each maintain shares between 6% and 8%, benefiting from strong European manufacturing and sustainable packaging innovation.

These leading companies are actively pursuing strategies focused on sustainability, product innovation, and digital transformation. Investments are being channeled into recyclable and biodegradable materials, enhanced coating technologies for moisture and grease resistance, and the development of intelligent packaging with traceability and interactive features.

Mergers and acquisitions also play a vital role, as evidenced by International Paper's acquisition of DS Smith to expand geographic reach and technological capabilities. Similarly, Mondi's recent expansion in Western Europe and WestRock's new production facilities in the USA showcase strategic capacity scaling to meet evolving demand.

For these large players, regulatory compliance and environmental certifications (such as FSC and EPR alignment) are central to retaining their leadership in a market increasingly defined by ESG criteria. Advanced automation, digital printing, and closed-loop recycling integration have become differentiators that not only optimize costs but also appeal to major FMCG and e-commerce clients focused on carbon reduction.

Smaller players and mid-tier manufacturers, such as Mayr-MelnhofKarton, ITC Limited, and DS Smith Plc, often adopt region-specific strategies. These include targeting niche markets like high-end personal care, artisanal foods, or regional retail chains.

Limited by lower capital investment, many smaller companies focus on customized packaging, quick turnaround services, and developing strong local customer relationships. While these firms may not compete directly with tier-1 multinationals on scale, they hold competitive advantages in agility, customer intimacy, and localized sustainability solutions.

Report Scope for the Global Boxboard Packaging Market

Attribute Details
Current Total Market Size (2025) USD 38.7 billion
Projected Market Size (2035) USD 59.5 billion
CAGR (2025 to 2035) 4.4%
Base Year for Estimation 2024
Historical Period 2020 to 2024
Projections Period 2025 to 2035
Report Parameter Revenue in USD billion/ Volume in Units
By Material Type Pulp Bleached , Bleached Chemical , Recovered Paper , and Others (Molded Pulp, Virgin Fiber)
By Grammage Weight 160gsm to 200gsm , 201gsm to 300gsm , and Above 301gsm
By Packaging Type Boxes , Cartons , Trays , and Other Packaging Types ( Sleeves, Clamshells, Wraps, Partitions, And Slipcases)
By End Use Food & Beverages , Personal Care & Cosmetics , Household , Food Service , Tobacco / Cigarette , and Other Higher-end / General Packaging ( Electronics, Luxury Goods, Gift Items, Stationery, And Specialty Retail Products)
Regions Covered North America, Latin America, Western Europe, South Asia, East Asia, Eastern Europe, and the Middle East & Africa
Countries Covered United States, Japan, Germany, India, United Kingdom, France, Italy, Brazil, Canada, South Korea, Australia, Spain, Netherlands, Saudi Arabia, Switzerland
Key Players International Paper Company, WestRock Company, Smurfit Kappa Group plc, Mondi Group, Stora Enso Oyj , Nippon Paper Industries Co., Ltd., Georgia-Pacific LLC, DS Smith Plc , Mayr-Melnhof Karton , and ITC Limited.
Additional Attributes Dollar sales by value, industry share analysis by region, and country-wise analysis

Segmentation

By Material Type:

In terms of material type, the market for boxboard packaging is segmented into pulp bleaches, bleached chemical, recovered paper and others (molded pulp, virgin fiber).

By Grammage Weight:

In terms of grammage weight, the market for boxboard packaging is divided into 160gsm to 200gsm, 210gsm to 300gsm and above 301gsm.

By Packaging Type:

In terms of packaging type, the market for boxboard packaging is divided into boxes, cartons, trays and other packaging types.

By End-Use:

In terms of end-use, the boxboard packaging market industry includes food & beverages, personal care & cosmetics, healthcare, foodservice, tobacco/cigarette and other higher-end /general packaging.

By Region:

Key countries of North America, Latin America, East Asia, South Asia and Pacific, Western Europe, Eastern Europe, Middle East and Africa are covered.

Table of Content

  1. Executive Summary
  2. Industry Introduction, including Taxonomy and Market Definition
  3. Market Trends and Success Factors, including Macro-economic Factors, Market Dynamics, and Recent Industry Developments
  4. Global Market Demand Analysis 2020 to 2024 and Forecast 2025 to 2035, including Historical Analysis and Future Projections
  5. Global Market Analysis 2020 to 2024 and Forecast 2025 to 2035
    • Material Type
    • Grammage Weight
    • Packaging Type
    • End Use
  6. Global Market Analysis 2020 to 2024 and Forecast 2025 to 2035, By Material Type
    • Pulp Bleached
    • Bleached Chemical
    • Recovered Paper
    • Others (Molded Pulp, Virgin Fiber)
  7. Global Market Analysis 2020 to 2024 and Forecast 2025 to 2035, By Grammage Weight
    • 160gsm to 200gsm
    • 201gsm to 300gsm
    • Above 301gsm
  8. Global Market Analysis 2020 to 2024 and Forecast 2025 to 2035, By Packaging Type
    • Boxes
    • Cartons
    • Trays
    • Other Packaging Types (Sleeves, Clamshells, Wraps, Partitions, And Slipcases)
  9. Global Market Analysis 2020 to 2024 and Forecast 2025 to 2035, By End Use
    • Food & Beverages
    • Personal Care & Cosmetics
    • Household
    • Food Service
    • Tobacco / Cigarette
    • Other Higher-end / General Packaging (Electronics, Luxury Goods, Gift Items, Stationery, And Specialty Retail Products)
  10. Global Market Analysis 2020 to 2024 and Forecast 2025 to 2035, By Region
    • North America
    • Latin America
    • East Asia
    • South Asia & Pacific
    • Western Europe
    • Eastern Europe
    • Middle East & Africa
  11. North America Sales Analysis 2020 to 2024 and Forecast 2025 to 2035, by Key Segments and Countries
  12. Latin America Sales Analysis 2020 to 2024 and Forecast 2025 to 2035, by Key Segments and Countries
  13. East Asia Sales Analysis 2020 to 2024 and Forecast 2025 to 2035, by Key Segments and Countries
  14. South Asia & Pacific Sales Analysis 2020 to 2024 and Forecast 2025 to 2035, by Key Segments and Countries
  15. Western Europe Sales Analysis 2020 to 2024 and Forecast 2025 to 2035, by Key Segments and Countries
  16. Eastern Europe Sales Analysis 2020 to 2024 and Forecast 2025 to 2035, by Key Segments and Countries
  17. Middle East & Africa Sales Analysis 2020 to 2024 and Forecast 2025 to 2035, by Key Segments and Countries
  18. Sales Forecast 2025 to 2035 by Material Type, Grammage Weight, Packaging Type, and End Use for 30 Countries
  19. Competition Outlook, including Market Structure Analysis, Company Share Analysis by Key Players, and Competition Dashboard
  20. Company Profile
    • International Paper Company
    • WestRock Company
    • Smurfit Kappa Group plc
    • Mondi Group
    • Stora Enso Oyj
    • Nippon Paper Industries Co., Ltd.
    • Georgia-Pacific LLC
    • DS Smith Plc.
    • Mayr-Melnhof Karton
    • ITC Limited

List of Tables

Table 1: Global Market Value (US$ Million) Forecast by Region, 2018 to 2033

Table 2: Global Market Volume (Units) Forecast by Region, 2018 to 2033

Table 3: Global Market Value (US$ Million) Forecast by Product Type, 2018 to 2033

Table 4: Global Market Volume (Units) Forecast by Product Type, 2018 to 2033

Table 5: Global Market Value (US$ Million) Forecast by Grade, 2018 to 2033

Table 6: Global Market Volume (Units) Forecast by Grade, 2018 to 2033

Table 7: Global Market Value (US$ Million) Forecast by End Use, 2018 to 2033

Table 8: Global Market Volume (Units) Forecast by End Use, 2018 to 2033

Table 9: North America Market Value (US$ Million) Forecast by Country, 2018 to 2033

Table 10: North America Market Volume (Units) Forecast by Country, 2018 to 2033

Table 11: North America Market Value (US$ Million) Forecast by Product Type, 2018 to 2033

Table 12: North America Market Volume (Units) Forecast by Product Type, 2018 to 2033

Table 13: North America Market Value (US$ Million) Forecast by Grade, 2018 to 2033

Table 14: North America Market Volume (Units) Forecast by Grade, 2018 to 2033

Table 15: North America Market Value (US$ Million) Forecast by End Use, 2018 to 2033

Table 16: North America Market Volume (Units) Forecast by End Use, 2018 to 2033

Table 17: Latin America Market Value (US$ Million) Forecast by Country, 2018 to 2033

Table 18: Latin America Market Volume (Units) Forecast by Country, 2018 to 2033

Table 19: Latin America Market Value (US$ Million) Forecast by Product Type, 2018 to 2033

Table 20: Latin America Market Volume (Units) Forecast by Product Type, 2018 to 2033

Table 21: Latin America Market Value (US$ Million) Forecast by Grade, 2018 to 2033

Table 22: Latin America Market Volume (Units) Forecast by Grade, 2018 to 2033

Table 23: Latin America Market Value (US$ Million) Forecast by End Use, 2018 to 2033

Table 24: Latin America Market Volume (Units) Forecast by End Use, 2018 to 2033

Table 25: Western Europe Market Value (US$ Million) Forecast by Country, 2018 to 2033

Table 26: Western Europe Market Volume (Units) Forecast by Country, 2018 to 2033

Table 27: Western Europe Market Value (US$ Million) Forecast by Product Type, 2018 to 2033

Table 28: Western Europe Market Volume (Units) Forecast by Product Type, 2018 to 2033

Table 29: Western Europe Market Value (US$ Million) Forecast by Grade, 2018 to 2033

Table 30: Western Europe Market Volume (Units) Forecast by Grade, 2018 to 2033

Table 31: Western Europe Market Value (US$ Million) Forecast by End Use, 2018 to 2033

Table 32: Western Europe Market Volume (Units) Forecast by End Use, 2018 to 2033

Table 33: Eastern Europe Market Value (US$ Million) Forecast by Country, 2018 to 2033

Table 34: Eastern Europe Market Volume (Units) Forecast by Country, 2018 to 2033

Table 35: Eastern Europe Market Value (US$ Million) Forecast by Product Type, 2018 to 2033

Table 36: Eastern Europe Market Volume (Units) Forecast by Product Type, 2018 to 2033

Table 37: Eastern Europe Market Value (US$ Million) Forecast by Grade, 2018 to 2033

Table 38: Eastern Europe Market Volume (Units) Forecast by Grade, 2018 to 2033

Table 39: Eastern Europe Market Value (US$ Million) Forecast by End Use, 2018 to 2033

Table 40: Eastern Europe Market Volume (Units) Forecast by End Use, 2018 to 2033

Table 41: South Asia and Pacific Market Value (US$ Million) Forecast by Country, 2018 to 2033

Table 42: South Asia and Pacific Market Volume (Units) Forecast by Country, 2018 to 2033

Table 43: South Asia and Pacific Market Value (US$ Million) Forecast by Product Type, 2018 to 2033

Table 44: South Asia and Pacific Market Volume (Units) Forecast by Product Type, 2018 to 2033

Table 45: South Asia and Pacific Market Value (US$ Million) Forecast by Grade, 2018 to 2033

Table 46: South Asia and Pacific Market Volume (Units) Forecast by Grade, 2018 to 2033

Table 47: South Asia and Pacific Market Value (US$ Million) Forecast by End Use, 2018 to 2033

Table 48: South Asia and Pacific Market Volume (Units) Forecast by End Use, 2018 to 2033

Table 49: East Asia Market Value (US$ Million) Forecast by Country, 2018 to 2033

Table 50: East Asia Market Volume (Units) Forecast by Country, 2018 to 2033

Table 51: East Asia Market Value (US$ Million) Forecast by Product Type, 2018 to 2033

Table 52: East Asia Market Volume (Units) Forecast by Product Type, 2018 to 2033

Table 53: East Asia Market Value (US$ Million) Forecast by Grade, 2018 to 2033

Table 54: East Asia Market Volume (Units) Forecast by Grade, 2018 to 2033

Table 55: East Asia Market Value (US$ Million) Forecast by End Use, 2018 to 2033

Table 56: East Asia Market Volume (Units) Forecast by End Use, 2018 to 2033

Table 57: Middle East and Africa Market Value (US$ Million) Forecast by Country, 2018 to 2033

Table 58: Middle East and Africa Market Volume (Units) Forecast by Country, 2018 to 2033

Table 59: Middle East and Africa Market Value (US$ Million) Forecast by Product Type, 2018 to 2033

Table 60: Middle East and Africa Market Volume (Units) Forecast by Product Type, 2018 to 2033

Table 61: Middle East and Africa Market Value (US$ Million) Forecast by Grade, 2018 to 2033

Table 62: Middle East and Africa Market Volume (Units) Forecast by Grade, 2018 to 2033

Table 63: Middle East and Africa Market Value (US$ Million) Forecast by End Use, 2018 to 2033

Table 64: Middle East and Africa Market Volume (Units) Forecast by End Use, 2018 to 2033

List of Figures

Figure 1: Global Market Value (US$ Million) by Product Type, 2023 to 2033

Figure 2: Global Market Value (US$ Million) by Grade, 2023 to 2033

Figure 3: Global Market Value (US$ Million) by End Use, 2023 to 2033

Figure 4: Global Market Value (US$ Million) by Region, 2023 to 2033

Figure 5: Global Market Value (US$ Million) Analysis by Region, 2018 to 2033

Figure 6: Global Market Volume (Units) Analysis by Region, 2018 to 2033

Figure 7: Global Market Value Share (%) and BPS Analysis by Region, 2023 to 2033

Figure 8: Global Market Y-o-Y Growth (%) Projections by Region, 2023 to 2033

Figure 9: Global Market Value (US$ Million) Analysis by Product Type, 2018 to 2033

Figure 10: Global Market Volume (Units) Analysis by Product Type, 2018 to 2033

Figure 11: Global Market Value Share (%) and BPS Analysis by Product Type, 2023 to 2033

Figure 12: Global Market Y-o-Y Growth (%) Projections by Product Type, 2023 to 2033

Figure 13: Global Market Value (US$ Million) Analysis by Grade, 2018 to 2033

Figure 14: Global Market Volume (Units) Analysis by Grade, 2018 to 2033

Figure 15: Global Market Value Share (%) and BPS Analysis by Grade, 2023 to 2033

Figure 16: Global Market Y-o-Y Growth (%) Projections by Grade, 2023 to 2033

Figure 17: Global Market Value (US$ Million) Analysis by End Use, 2018 to 2033

Figure 18: Global Market Volume (Units) Analysis by End Use, 2018 to 2033

Figure 19: Global Market Value Share (%) and BPS Analysis by End Use, 2023 to 2033

Figure 20: Global Market Y-o-Y Growth (%) Projections by End Use, 2023 to 2033

Figure 21: Global Market Attractiveness by Product Type, 2023 to 2033

Figure 22: Global Market Attractiveness by Grade, 2023 to 2033

Figure 23: Global Market Attractiveness by End Use, 2023 to 2033

Figure 24: Global Market Attractiveness by Region, 2023 to 2033

Figure 25: North America Market Value (US$ Million) by Product Type, 2023 to 2033

Figure 26: North America Market Value (US$ Million) by Grade, 2023 to 2033

Figure 27: North America Market Value (US$ Million) by End Use, 2023 to 2033

Figure 28: North America Market Value (US$ Million) by Country, 2023 to 2033

Figure 29: North America Market Value (US$ Million) Analysis by Country, 2018 to 2033

Figure 30: North America Market Volume (Units) Analysis by Country, 2018 to 2033

Figure 31: North America Market Value Share (%) and BPS Analysis by Country, 2023 to 2033

Figure 32: North America Market Y-o-Y Growth (%) Projections by Country, 2023 to 2033

Figure 33: North America Market Value (US$ Million) Analysis by Product Type, 2018 to 2033

Figure 34: North America Market Volume (Units) Analysis by Product Type, 2018 to 2033

Figure 35: North America Market Value Share (%) and BPS Analysis by Product Type, 2023 to 2033

Figure 36: North America Market Y-o-Y Growth (%) Projections by Product Type, 2023 to 2033

Figure 37: North America Market Value (US$ Million) Analysis by Grade, 2018 to 2033

Figure 38: North America Market Volume (Units) Analysis by Grade, 2018 to 2033

Figure 39: North America Market Value Share (%) and BPS Analysis by Grade, 2023 to 2033

Figure 40: North America Market Y-o-Y Growth (%) Projections by Grade, 2023 to 2033

Figure 41: North America Market Value (US$ Million) Analysis by End Use, 2018 to 2033

Figure 42: North America Market Volume (Units) Analysis by End Use, 2018 to 2033

Figure 43: North America Market Value Share (%) and BPS Analysis by End Use, 2023 to 2033

Figure 44: North America Market Y-o-Y Growth (%) Projections by End Use, 2023 to 2033

Figure 45: North America Market Attractiveness by Product Type, 2023 to 2033

Figure 46: North America Market Attractiveness by Grade, 2023 to 2033

Figure 47: North America Market Attractiveness by End Use, 2023 to 2033

Figure 48: North America Market Attractiveness by Country, 2023 to 2033

Figure 49: Latin America Market Value (US$ Million) by Product Type, 2023 to 2033

Figure 50: Latin America Market Value (US$ Million) by Grade, 2023 to 2033

Figure 51: Latin America Market Value (US$ Million) by End Use, 2023 to 2033

Figure 52: Latin America Market Value (US$ Million) by Country, 2023 to 2033

Figure 53: Latin America Market Value (US$ Million) Analysis by Country, 2018 to 2033

Figure 54: Latin America Market Volume (Units) Analysis by Country, 2018 to 2033

Figure 55: Latin America Market Value Share (%) and BPS Analysis by Country, 2023 to 2033

Figure 56: Latin America Market Y-o-Y Growth (%) Projections by Country, 2023 to 2033

Figure 57: Latin America Market Value (US$ Million) Analysis by Product Type, 2018 to 2033

Figure 58: Latin America Market Volume (Units) Analysis by Product Type, 2018 to 2033

Figure 59: Latin America Market Value Share (%) and BPS Analysis by Product Type, 2023 to 2033

Figure 60: Latin America Market Y-o-Y Growth (%) Projections by Product Type, 2023 to 2033

Figure 61: Latin America Market Value (US$ Million) Analysis by Grade, 2018 to 2033

Figure 62: Latin America Market Volume (Units) Analysis by Grade, 2018 to 2033

Figure 63: Latin America Market Value Share (%) and BPS Analysis by Grade, 2023 to 2033

Figure 64: Latin America Market Y-o-Y Growth (%) Projections by Grade, 2023 to 2033

Figure 65: Latin America Market Value (US$ Million) Analysis by End Use, 2018 to 2033

Figure 66: Latin America Market Volume (Units) Analysis by End Use, 2018 to 2033

Figure 67: Latin America Market Value Share (%) and BPS Analysis by End Use, 2023 to 2033

Figure 68: Latin America Market Y-o-Y Growth (%) Projections by End Use, 2023 to 2033

Figure 69: Latin America Market Attractiveness by Product Type, 2023 to 2033

Figure 70: Latin America Market Attractiveness by Grade, 2023 to 2033

Figure 71: Latin America Market Attractiveness by End Use, 2023 to 2033

Figure 72: Latin America Market Attractiveness by Country, 2023 to 2033

Figure 73: Western Europe Market Value (US$ Million) by Product Type, 2023 to 2033

Figure 74: Western Europe Market Value (US$ Million) by Grade, 2023 to 2033

Figure 75: Western Europe Market Value (US$ Million) by End Use, 2023 to 2033

Figure 76: Western Europe Market Value (US$ Million) by Country, 2023 to 2033

Figure 77: Western Europe Market Value (US$ Million) Analysis by Country, 2018 to 2033

Figure 78: Western Europe Market Volume (Units) Analysis by Country, 2018 to 2033

Figure 79: Western Europe Market Value Share (%) and BPS Analysis by Country, 2023 to 2033

Figure 80: Western Europe Market Y-o-Y Growth (%) Projections by Country, 2023 to 2033

Figure 81: Western Europe Market Value (US$ Million) Analysis by Product Type, 2018 to 2033

Figure 82: Western Europe Market Volume (Units) Analysis by Product Type, 2018 to 2033

Figure 83: Western Europe Market Value Share (%) and BPS Analysis by Product Type, 2023 to 2033

Figure 84: Western Europe Market Y-o-Y Growth (%) Projections by Product Type, 2023 to 2033

Figure 85: Western Europe Market Value (US$ Million) Analysis by Grade, 2018 to 2033

Figure 86: Western Europe Market Volume (Units) Analysis by Grade, 2018 to 2033

Figure 87: Western Europe Market Value Share (%) and BPS Analysis by Grade, 2023 to 2033

Figure 88: Western Europe Market Y-o-Y Growth (%) Projections by Grade, 2023 to 2033

Figure 89: Western Europe Market Value (US$ Million) Analysis by End Use, 2018 to 2033

Figure 90: Western Europe Market Volume (Units) Analysis by End Use, 2018 to 2033

Figure 91: Western Europe Market Value Share (%) and BPS Analysis by End Use, 2023 to 2033

Figure 92: Western Europe Market Y-o-Y Growth (%) Projections by End Use, 2023 to 2033

Figure 93: Western Europe Market Attractiveness by Product Type, 2023 to 2033

Figure 94: Western Europe Market Attractiveness by Grade, 2023 to 2033

Figure 95: Western Europe Market Attractiveness by End Use, 2023 to 2033

Figure 96: Western Europe Market Attractiveness by Country, 2023 to 2033

Figure 97: Eastern Europe Market Value (US$ Million) by Product Type, 2023 to 2033

Figure 98: Eastern Europe Market Value (US$ Million) by Grade, 2023 to 2033

Figure 99: Eastern Europe Market Value (US$ Million) by End Use, 2023 to 2033

Figure 100: Eastern Europe Market Value (US$ Million) by Country, 2023 to 2033

Figure 101: Eastern Europe Market Value (US$ Million) Analysis by Country, 2018 to 2033

Figure 102: Eastern Europe Market Volume (Units) Analysis by Country, 2018 to 2033

Figure 103: Eastern Europe Market Value Share (%) and BPS Analysis by Country, 2023 to 2033

Figure 104: Eastern Europe Market Y-o-Y Growth (%) Projections by Country, 2023 to 2033

Figure 105: Eastern Europe Market Value (US$ Million) Analysis by Product Type, 2018 to 2033

Figure 106: Eastern Europe Market Volume (Units) Analysis by Product Type, 2018 to 2033

Figure 107: Eastern Europe Market Value Share (%) and BPS Analysis by Product Type, 2023 to 2033

Figure 108: Eastern Europe Market Y-o-Y Growth (%) Projections by Product Type, 2023 to 2033

Figure 109: Eastern Europe Market Value (US$ Million) Analysis by Grade, 2018 to 2033

Figure 110: Eastern Europe Market Volume (Units) Analysis by Grade, 2018 to 2033

Figure 111: Eastern Europe Market Value Share (%) and BPS Analysis by Grade, 2023 to 2033

Figure 112: Eastern Europe Market Y-o-Y Growth (%) Projections by Grade, 2023 to 2033

Figure 113: Eastern Europe Market Value (US$ Million) Analysis by End Use, 2018 to 2033

Figure 114: Eastern Europe Market Volume (Units) Analysis by End Use, 2018 to 2033

Figure 115: Eastern Europe Market Value Share (%) and BPS Analysis by End Use, 2023 to 2033

Figure 116: Eastern Europe Market Y-o-Y Growth (%) Projections by End Use, 2023 to 2033

Figure 117: Eastern Europe Market Attractiveness by Product Type, 2023 to 2033

Figure 118: Eastern Europe Market Attractiveness by Grade, 2023 to 2033

Figure 119: Eastern Europe Market Attractiveness by End Use, 2023 to 2033

Figure 120: Eastern Europe Market Attractiveness by Country, 2023 to 2033

Figure 121: South Asia and Pacific Market Value (US$ Million) by Product Type, 2023 to 2033

Figure 122: South Asia and Pacific Market Value (US$ Million) by Grade, 2023 to 2033

Figure 123: South Asia and Pacific Market Value (US$ Million) by End Use, 2023 to 2033

Figure 124: South Asia and Pacific Market Value (US$ Million) by Country, 2023 to 2033

Figure 125: South Asia and Pacific Market Value (US$ Million) Analysis by Country, 2018 to 2033

Figure 126: South Asia and Pacific Market Volume (Units) Analysis by Country, 2018 to 2033

Figure 127: South Asia and Pacific Market Value Share (%) and BPS Analysis by Country, 2023 to 2033

Figure 128: South Asia and Pacific Market Y-o-Y Growth (%) Projections by Country, 2023 to 2033

Figure 129: South Asia and Pacific Market Value (US$ Million) Analysis by Product Type, 2018 to 2033

Figure 130: South Asia and Pacific Market Volume (Units) Analysis by Product Type, 2018 to 2033

Figure 131: South Asia and Pacific Market Value Share (%) and BPS Analysis by Product Type, 2023 to 2033

Figure 132: South Asia and Pacific Market Y-o-Y Growth (%) Projections by Product Type, 2023 to 2033

Figure 133: South Asia and Pacific Market Value (US$ Million) Analysis by Grade, 2018 to 2033

Figure 134: South Asia and Pacific Market Volume (Units) Analysis by Grade, 2018 to 2033

Figure 135: South Asia and Pacific Market Value Share (%) and BPS Analysis by Grade, 2023 to 2033

Figure 136: South Asia and Pacific Market Y-o-Y Growth (%) Projections by Grade, 2023 to 2033

Figure 137: South Asia and Pacific Market Value (US$ Million) Analysis by End Use, 2018 to 2033

Figure 138: South Asia and Pacific Market Volume (Units) Analysis by End Use, 2018 to 2033

Figure 139: South Asia and Pacific Market Value Share (%) and BPS Analysis by End Use, 2023 to 2033

Figure 140: South Asia and Pacific Market Y-o-Y Growth (%) Projections by End Use, 2023 to 2033

Figure 141: South Asia and Pacific Market Attractiveness by Product Type, 2023 to 2033

Figure 142: South Asia and Pacific Market Attractiveness by Grade, 2023 to 2033

Figure 143: South Asia and Pacific Market Attractiveness by End Use, 2023 to 2033

Figure 144: South Asia and Pacific Market Attractiveness by Country, 2023 to 2033

Figure 145: East Asia Market Value (US$ Million) by Product Type, 2023 to 2033

Figure 146: East Asia Market Value (US$ Million) by Grade, 2023 to 2033

Figure 147: East Asia Market Value (US$ Million) by End Use, 2023 to 2033

Figure 148: East Asia Market Value (US$ Million) by Country, 2023 to 2033

Figure 149: East Asia Market Value (US$ Million) Analysis by Country, 2018 to 2033

Figure 150: East Asia Market Volume (Units) Analysis by Country, 2018 to 2033

Figure 151: East Asia Market Value Share (%) and BPS Analysis by Country, 2023 to 2033

Figure 152: East Asia Market Y-o-Y Growth (%) Projections by Country, 2023 to 2033

Figure 153: East Asia Market Value (US$ Million) Analysis by Product Type, 2018 to 2033

Figure 154: East Asia Market Volume (Units) Analysis by Product Type, 2018 to 2033

Figure 155: East Asia Market Value Share (%) and BPS Analysis by Product Type, 2023 to 2033

Figure 156: East Asia Market Y-o-Y Growth (%) Projections by Product Type, 2023 to 2033

Figure 157: East Asia Market Value (US$ Million) Analysis by Grade, 2018 to 2033

Figure 158: East Asia Market Volume (Units) Analysis by Grade, 2018 to 2033

Figure 159: East Asia Market Value Share (%) and BPS Analysis by Grade, 2023 to 2033

Figure 160: East Asia Market Y-o-Y Growth (%) Projections by Grade, 2023 to 2033

Figure 161: East Asia Market Value (US$ Million) Analysis by End Use, 2018 to 2033

Figure 162: East Asia Market Volume (Units) Analysis by End Use, 2018 to 2033

Figure 163: East Asia Market Value Share (%) and BPS Analysis by End Use, 2023 to 2033

Figure 164: East Asia Market Y-o-Y Growth (%) Projections by End Use, 2023 to 2033

Figure 165: East Asia Market Attractiveness by Product Type, 2023 to 2033

Figure 166: East Asia Market Attractiveness by Grade, 2023 to 2033

Figure 167: East Asia Market Attractiveness by End Use, 2023 to 2033

Figure 168: East Asia Market Attractiveness by Country, 2023 to 2033

Figure 169: Middle East and Africa Market Value (US$ Million) by Product Type, 2023 to 2033

Figure 170: Middle East and Africa Market Value (US$ Million) by Grade, 2023 to 2033

Figure 171: Middle East and Africa Market Value (US$ Million) by End Use, 2023 to 2033

Figure 172: Middle East and Africa Market Value (US$ Million) by Country, 2023 to 2033

Figure 173: Middle East and Africa Market Value (US$ Million) Analysis by Country, 2018 to 2033

Figure 174: Middle East and Africa Market Volume (Units) Analysis by Country, 2018 to 2033

Figure 175: Middle East and Africa Market Value Share (%) and BPS Analysis by Country, 2023 to 2033

Figure 176: Middle East and Africa Market Y-o-Y Growth (%) Projections by Country, 2023 to 2033

Figure 177: Middle East and Africa Market Value (US$ Million) Analysis by Product Type, 2018 to 2033

Figure 178: Middle East and Africa Market Volume (Units) Analysis by Product Type, 2018 to 2033

Figure 179: Middle East and Africa Market Value Share (%) and BPS Analysis by Product Type, 2023 to 2033

Figure 180: Middle East and Africa Market Y-o-Y Growth (%) Projections by Product Type, 2023 to 2033

Figure 181: Middle East and Africa Market Value (US$ Million) Analysis by Grade, 2018 to 2033

Figure 182: Middle East and Africa Market Volume (Units) Analysis by Grade, 2018 to 2033

Figure 183: Middle East and Africa Market Value Share (%) and BPS Analysis by Grade, 2023 to 2033

Figure 184: Middle East and Africa Market Y-o-Y Growth (%) Projections by Grade, 2023 to 2033

Figure 185: Middle East and Africa Market Value (US$ Million) Analysis by End Use, 2018 to 2033

Figure 186: Middle East and Africa Market Volume (Units) Analysis by End Use, 2018 to 2033

Figure 187: Middle East and Africa Market Value Share (%) and BPS Analysis by End Use, 2023 to 2033

Figure 188: Middle East and Africa Market Y-o-Y Growth (%) Projections by End Use, 2023 to 2033

Figure 189: Middle East and Africa Market Attractiveness by Product Type, 2023 to 2033

Figure 190: Middle East and Africa Market Attractiveness by Grade, 2023 to 2033

Figure 191: Middle East and Africa Market Attractiveness by End Use, 2023 to 2033

Figure 192: Middle East and Africa Market Attractiveness by Country, 2023 to 2033

Frequently Asked Questions

What is the projected size of the boxboard packaging market by 2035?

The global market is expected to grow from USD 38.7 billion in 2025 to USD 59.5 billion by 2035, driven by demand for sustainable and efficient packaging.

Which material type leads the boxboard packaging market?

Recovered paper leads the market due to its sustainability and cost benefits, growing at a CAGR of 4.9% through 2035.

Which is the largest end-use segment in the boxboard packaging industry?

The food and beverages segment is the largest end-use category, projected to reach USD 15.8 billion in 2025 and continue growing through 2035.

Who are the top players in the boxboard packaging market?

The top companies include International Paper, WestRock, Smurfit Kappa, Mondi, and Stora Enso, together accounting for over 50% of the industry share in 2025.

Which regions are expected to see the fastest growth in boxboard packaging demand?

Asia Pacific, particularly China and India, is set to experience the fastest growth due to urbanization, rising incomes, and policy support for recyclable materials.

Explore Similar Insights

Future Market Insights

Boxboard Packaging Market