Cupcake Box Market Size and Share Forecast Outlook (2025 to 2035)

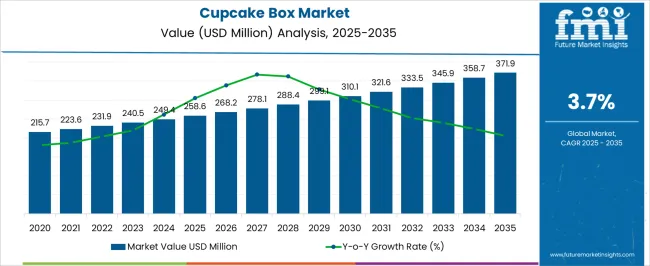
The Cupcake Box Market is estimated to be valued at USD 258.6 million in 2025 and is projected to reach USD 371.9 million by 2035, registering a compound annual growth rate (CAGR) of 3.7% over the forecast period.

The cupcake box market is experiencing consistent expansion due to the growing bakery industry, increasing consumer inclination toward packaged confectionery products, and rising demand for visually appealing and durable packaging solutions. Current market conditions are shaped by higher production volumes in commercial bakeries and expanding retail distribution networks that rely on efficient and protective packaging. Sustainability initiatives are also influencing material choices, with manufacturers adopting recyclable and food-grade materials to align with regulatory and consumer expectations.

The future outlook remains optimistic as customization, branding integration, and structural innovation continue to drive market differentiation. Growth rationale is rooted in the demand for lightweight, cost-effective, and high-barrier packaging that maintains product freshness and presentation.

Urbanization, expansion of online bakery sales, and the popularity of gifting culture are expected to further stimulate demand Continuous investment in packaging design technology and automated manufacturing processes will sustain competitive advantage and ensure consistent revenue generation across global bakery packaging markets.
Quick Stats for Cupcake Box Market

  • Cupcake Box Market Industry Value (2025): USD 258.6 million
  • Cupcake Box Market Forecast Value (2035): USD 371.9 million
  • Cupcake Box Market Forecast CAGR: 3.7%
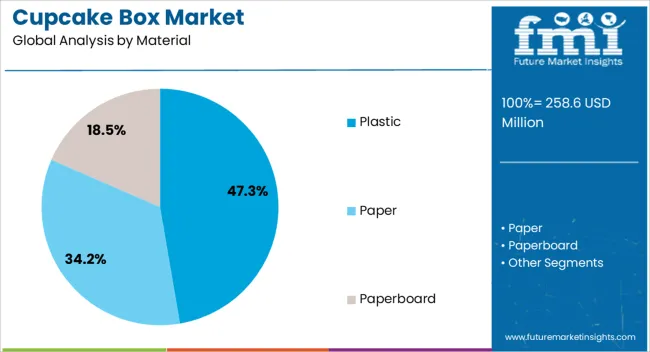
  • Leading Segment in Cupcake Box Market in 2025: Plastic (47.3%)
  • Key Growth Region in Cupcake Box Market: North America, Asia-Pacific, Europe
  • Top Key Players in Cupcake Box Market: Smurfit Kappa Group plc, Plastic Package, Inc., Inno-Pak, LLC, TEMMA SHIKI CO., LTD, LINDAR Corporation, Napco National, Premier Packaging Solutions, Dart Container Corporation, Pactiv LLC, ClipnBox, Robinson Plc, McLaren Packaging Ltd, Graphic Packaging International, LLC, Alefh Sp z o.o. Sp. K, CoPack Inc., Obtech Corporation (M) Sdn Bhd., Veerkarton BV, ZEE Packaging, Taylor Box Company, Europack

Cupcake Box Market Market Value Analysis

Metric Value
Cupcake Box Market Estimated Value in (2025 E) USD 258.6 million
Cupcake Box Market Forecast Value in (2035 F) USD 371.9 million
Forecast CAGR (2025 to 2035) 3.7%

Segmental Analysis

The market is segmented by Material, Size, and End Use and region. By Material, the market is divided into Plastic, Paper, and Paperboard. In terms of Size, the market is classified into 6 oz. to 9 oz., Less Than 2 oz., 2 oz. to 5 oz., and 10 oz. And Above. Based on End Use, the market is segmented into Commercial Use, Institutional Use, and Household Use. Regionally, the market is classified into North America, Latin America, Western Europe, Eastern Europe, Balkan & Baltic Countries, Russia & Belarus, Central Asia, East Asia, South Asia & Pacific, and the Middle East & Africa.
Insights into the Material Segment

Cupcake Box Market Analysis By Material

The plastic segment, holding 47.30% of the material category, has maintained its leading position owing to its durability, lightweight nature, and superior protection against moisture and contamination. It remains the preferred choice for both small-scale and large-scale bakeries that prioritize product visibility and extended shelf life.

Clear plastic cupcake boxes offer aesthetic appeal and convenient stacking, enhancing their suitability for retail and catering applications. Despite increasing scrutiny of plastic usage, advancements in biodegradable and recyclable plastic formulations are supporting continued adoption.

Production scalability and cost efficiency further strengthen its dominance, while innovations in sustainable polymer technology are expected to secure long-term relevance As packaging producers align with circular economy goals, the plastic segment is anticipated to retain a strong market share through material diversification and enhanced recyclability.
Insights into the Size Segment

Cupcake Box Market Analysis By Size

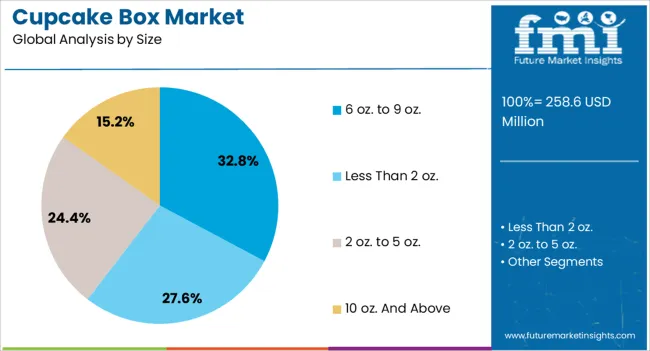
The 6 oz. to 9 oz. segment, representing 32.80% of the size category, has emerged as a prominent segment due to its compatibility with standard-sized cupcakes widely sold across commercial outlets and bakeries. Its moderate capacity allows for versatile packaging configurations that balance space efficiency and product protection.

Manufacturers favor this size range for its adaptability to both single and multi-cavity box formats, facilitating broad market applicability. The segment’s demand is reinforced by its alignment with retail display standards and online delivery packaging specifications. Production optimization and uniform sizing have contributed to reduced manufacturing waste and improved logistics handling.

With consistent consumption patterns in bakery chains and retail channels, the 6 oz to 9 oz category is expected to sustain stable growth and maintain its position as a preferred packaging format in the cupcake box market.
Insights into the End Use Segment

Cupcake Box Market Analysis By End Use

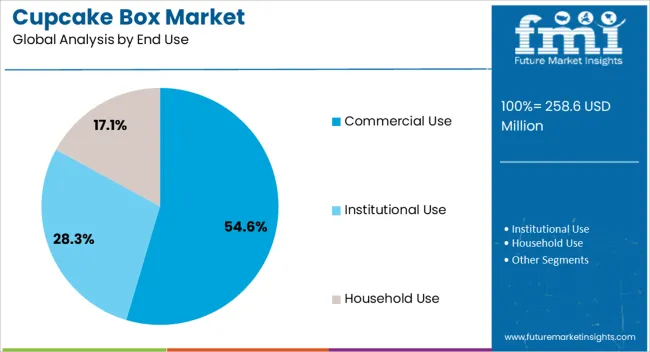
The commercial use segment, accounting for 54.60% of the end-use category, has dominated the market due to increasing utilization of cupcake boxes by bakeries, cafés, catering services, and event organizers. The segment’s leadership is driven by bulk packaging demand, frequent restocking cycles, and the need for cost-effective yet premium-quality packaging solutions.

Standardized sizing, efficient material utilization, and customized branding options have enhanced the segment’s appeal among commercial users. The rise of online bakery delivery platforms and quick-service chains has further amplified large-volume packaging requirements.

Manufacturers are focusing on supplying durable and tamper-resistant solutions to meet safety and transportation needs As commercial production and distribution networks expand globally, the commercial use segment is projected to maintain strong momentum, reinforcing its position as the leading end-use category within the cupcake box market.

Key Cupcake Box Industry Trends

Rundown of Growth Drivers Influencing Cupcake Box Sales Transactions

The cupcakes are picking up steam as a fashionable and convenient dessert alternative has led to an amplifying cupcake box demand. This trend is evident in urban regions where bakery items are a staple in events or celebrations. The cupcake box vendors need to keep a check on consumer choices and adjust to the changes in demand to be relevant in the industry.

There is a strengthening consumer alternative for environment-friendly packaging choices. The cupcake box providers that invest in recyclable or reusable boxes lure eco-conscious customers and adhere to the spurring regulatory demands for sustainable activities.

The evolution of e-commerce websites has surged the demand for safe and attractive cupcake box packaging alternatives. Cupcake boxes are made for safe transportation, and luring presentations are crucial for online sales. Using the e-commerce growth, open novel supply chains and customer bases. These factors augment the cupcake box market expansion.

Restraints Affecting Cupcake Container Market Growth

The cost shifts of raw materials like paper, cardboard, and printing ink adversely influence the operation costs. Shifts in distribution network dynamics, geopolitical catalysts, or transitions in cupcake box demand for such materials in diverse industries usher these fluctuations.

The strict environmental rules are a significant constraint. Adherence to these rules needs substantial investment in eco-friendly materials and manufacturing processes. The cupcake box vendors should invest in sustainable alternatives, which are available at a higher cost.

The transition in consumer choices towards environment-friendly and customizable packaging alternatives poses a threat. Satisfying these shifting demands needs flexibility in manufacturing procedures and soaring costs because of the sector for personalized solutions. These factors impede the cupcake box market growth.

Comparison of Historical vs Future Outlook on Changing Consumer Trends for Cupcake Box Industry

The global cupcake box ecosystem recorded sales of USD 215.7 million in 2020. Between 2020 and 2025, the cupcake box market witnessed strong growth ushered by the amplifying traction of cupcakes as a contemporary dessert alternative for diverse occasions.

The upsurged consumer demand for fascinating packaging solutions strengthened the growth of the cupcake box industry. The historical period from 2020 to 2025 witnessed a boom in artisanal bakeries and specialty dessert retailers, aiding the soaring competition and revolution in cupcake box packaging designs.

From 2025 to 2035, the demand analysis of cupcake boxes is on an upward growth trajectory, notwithstanding a slower pace in comparison to the previous forecast period. While cupcakes are an admirable treat, industry saturation and evolving consumer choices moderate growth rates.

The cupcake box ecosystem aids in continuous product diversification, with a concentration on environment-friendly and personalized packaging solutions to favor shifting consumer values.

The cupcake box industry is slated for supported growth between 2025 and 2035, prompted by continuous product innovation, proliferating supply chains, and spurring consumer demand for suitable and visually appealing packaging alternatives for sweet treats. The cupcake box vendors operating in the industry should adapt to shifting industry dynamics and consumer alternatives to foster a competitive edge in the upcoming years.

Analysis of Top Countries Producing and Exporting Cupcake Boxes

The section below covers the forecast for the cupcake box market in terms of countries. Information on key countries in several parts of the globe, including North America, Asia Pacific, Europe, and others, is provided. The United States is moving at a moderate pace in North America’s cupcake box industry, with a CAGR of 2.4% through 2035. In Asia Pacific, India infers a CAGR of 6.4% by 2035, followed by China at 5.6%.

Countries CAGR 2025 to 2035
United States 2.4%
United Kingdom 2.8%
Spain 3.7%
China 5.6%
India 6.4%

Growth Factors Influencing the Cupcake Box Market in The United States

The United States cupcake box industry experienced a transition into premium packaging alternatives, catering to the demand for superior and artisanal bakery items. The spurring demand for eco-conscious packaging solutions impacts the market trends in the United States, indicating an expanding environmental awareness in consumers.

Personalization is a key catalyst to shape the cupcake box sector in the United States, serving varied consumer choices. Online bakery service providers use innovative packaging designs in the United States cupcake box ecosystem to improve brand appeal and customer participation.

Market Trends in Cupcake Boxes in the United Kingdom

The eco-conscious packaging activities are gaining traction in the United Kingdom cupcake box industry, ushered by government schemes and consumer awareness strategies. Accessibility and flexibility are pivotal factors transforming the United Kingdom cupcake box sector, with a concentration on compact and portable packaging solutions for on-the-go utilization.

The advent of home bakers in the United Kingdom strengthens the demand for small-sized cupcake boxes, satisfying DIY bakers and SMEs. Premiumization trends in the United Kingdom cupcake box ecosystem are prevalent, with a focus on supreme materials and complex designs to lure high-end customers.

Growth Opportunity for The Cupcake Box in India

The Indian cupcake box market is ushered by the rising café culture and the traction towards western desserts among urban millennials. The economical and lightweight packaging solutions prevail in the Indian cupcake box sector, serving price-sensitive individuals and small-scale or home bakeries.

The impact of festivals and celebrations severely affects the Indian cupcake box industry, with a demand upsurge perceived during significant cultural events. E-commerce websites play a considerable role in the supply of cupcake boxes in India, presenting a conducive pathway for consumers as well as vendors to access an array of alternatives.

Cupcake Box Industry Analysis by Top Investment Segments

The section contains information about the leading segments in the cupcake box industry. In terms of material category, the paper and paperboard segment accounts for a share of 67.9% by 2035. By end use category, the commercial use segment dominates by holding a share of 45.1% in 2035.

Paper and Paperboard Takes Precedence in Preserving Cupcake Quality

Segment Paper and Paperboard
Value Share (2035) 67.9%

The rise in the adoption of paper and paperboard packaging appeals to vendors looking for effective solutions without compromising quality. Consumer sensitivity favors paper packaging because of its natural and biodegradable attributes, improving brand trust.

Paper-based packaging is easily personalized, permitting providers to display branding and strengthen product presentation. The rising regulatory scrutiny on plastic adoption directs businesses towards paper and paperboard substitutes for adherence and reputation management.

Custom Branding Elevates Cupcake Box Sales

Segment Commercial Use
Value Share (2035) 45.1%

Commercial businesses like bakeries and retail stores have a stable and significant demand for cupcake boxes to pack their products proficiently. The commercial use segment involves custom branding on packaging, which amplifies the sales of cupcake boxes.

The providers serve at events, parties, and celebrations, ushering in the demand for large quantities of cupcake boxes for transit and presentation. Commercial units adhere to packaging and food safety rules, compelling the adoption of cupcake boxes.
Competitive Landscape of the Cupcake Box Industry

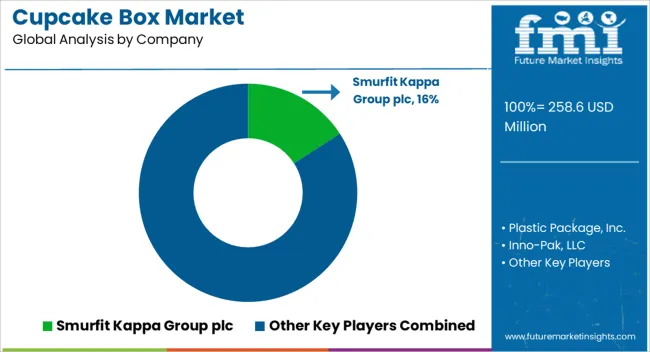
Cupcake Box Market Analysis By Company

The cupcake box industry is very competitive, ushered by an evolving demand for pleasing and functional packaging solutions. The leading cupcake box vendors like established packaging producers and emerging providers specializing in niche industries.

The packaging market is remarked by a strong emphasis on eco-friendliness. Numerous cupcake box manufacturers are adopting sustainable materials and renewable alternatives to align with evolving consumer preferences. This focus on sustainability is a key driver of innovation in design and personalization alternatives.

The upsurge of online bakeries and home-based firms has developed cupcake box market opportunities. Competitive costs, product integrity, and customer service are necessary factors impacting the market share. The cupcake box sector impedes shifting the raw material costs and regulatory guidelines associated with food packaging safety.

Industry Updates

  • In January 2025, Bakery Packaging Boxes, a broad-scale custom packaging company headquartered in the United States, announced the launch of eco-friendly packaging solutions. The company has introduced cardboard boxes to its product line, aiming to tackle plastic packaging pollution and promote sustainability in the industry.
  • In November 2025, Inno-Pak, LLC, a portfolio firm of Emerald Lake Capital Management and a prominent manufacturer, importer, and provider of innovative, sustainable packaging for ready-to-eat and takeout foods, announced the acquisition of Albany Packaging Inc. This strategic move is set to enhance Inno-Pak's capabilities and expand its reach in the sustainable packaging market.

Top Cupcake Box Vendors by Market Share

  • Plastic Package, Inc.
  • Inno-Pak, LLC
  • TEMMA SHIKI CO., LTD
  • LINDAR Corporation
  • Napco National
  • Premier Packaging Solutions
  • Dart Container Corporation
  • Pactiv LLC
  • ClipnBox
  • Robinson Plc
  • McLaren Packaging Ltd
  • Graphic Packaging International, LLC
  • Smurfit Kappa Group plc
  • Alefh Sp z o.o. Sp. K
  • CoPack Inc.
  • Obtech Corporation (M) Sdn Bhd.
  • Veerkarton BV
  • ZEE Packaging
  • Taylor Box Company
  • Europack

Top Segments Studied in the Cupcake Box Market Research Report

By Material:

The market is bifurcated into paper, paperboard, and plastic.

By Size:

Key sizes include Less than 2 oz., 2 oz. to 5 oz., 6 oz. to 9 oz., and 10 oz. and above.

By End Use:

The market is trifurcated into commercial use, institutional use, and household use.

By Region:

Analysis of the market has been carried out in key countries of North America, Latin America, East Asia, South Asia and Pacific, Western Europe, Eastern Europe, and the Middle East and Africa.

Frequently Asked Questions

How big is the cupcake box market in 2025?

The global cupcake box market is estimated to be valued at USD 258.6 million in 2025.

What will be the size of cupcake box market in 2035?

The market size for the cupcake box market is projected to reach USD 371.9 million by 2035.

How much will be the cupcake box market growth between 2025 and 2035?

The cupcake box market is expected to grow at a 3.7% CAGR between 2025 and 2035.

What are the key product types in the cupcake box market?

The key product types in cupcake box market are plastic, paper and paperboard.

Which size segment to contribute significant share in the cupcake box market in 2025?

In terms of size, 6 oz. to 9 oz. segment to command 32.8% share in the cupcake box market in 2025.

Table of Content

  1. Executive Summary
    • Global Market Outlook
    • Demand-side Trends
    • Supply-side Trends
    • Technology Roadmap Analysis
    • Analysis and Recommendations
  2. Market Overview
    • Market Coverage / Taxonomy
    • Market Definition / Scope / Limitations
  3. Market Background
    • Market Dynamics
      • Drivers
      • Restraints
      • Opportunity
      • Trends
    • Scenario Forecast
      • Demand in Optimistic Scenario
      • Demand in Likely Scenario
      • Demand in Conservative Scenario
    • Opportunity Map Analysis
    • Product Life Cycle Analysis
    • Supply Chain Analysis
    • Investment Feasibility Matrix
    • Value Chain Analysis
    • PESTLE and Porter’s Analysis
    • Regulatory Landscape
    • Regional Parent Market Outlook
    • Production and Consumption Statistics
    • Import and Export Statistics
  4. Global Market Analysis 2020 to 2024 and Forecast, 2025 to 2035
    • Historical Market Size Value (USD Million) Analysis, 2020 to 2024
    • Current and Future Market Size Value (USD Million) Projections, 2025 to 2035
      • Y-o-Y Growth Trend Analysis
      • Absolute $ Opportunity Analysis
  5. Global Market Pricing Analysis 2020 to 2024 and Forecast 2025 to 2035
  6. Global Market Analysis 2020 to 2024 and Forecast 2025 to 2035, By Material
    • Introduction / Key Findings
    • Historical Market Size Value (USD Million) Analysis By Material , 2020 to 2024
    • Current and Future Market Size Value (USD Million) Analysis and Forecast By Material , 2025 to 2035
      • Plastic
      • Paper
      • Paperboard
    • Y-o-Y Growth Trend Analysis By Material , 2020 to 2024
    • Absolute $ Opportunity Analysis By Material , 2025 to 2035
  7. Global Market Analysis 2020 to 2024 and Forecast 2025 to 2035, By Size
    • Introduction / Key Findings
    • Historical Market Size Value (USD Million) Analysis By Size, 2020 to 2024
    • Current and Future Market Size Value (USD Million) Analysis and Forecast By Size, 2025 to 2035
      • 6 oz. to 9 oz.
      • Less Than 2 oz.
      • 2 oz. to 5 oz.
      • 10 oz. And Above
    • Y-o-Y Growth Trend Analysis By Size, 2020 to 2024
    • Absolute $ Opportunity Analysis By Size, 2025 to 2035
  8. Global Market Analysis 2020 to 2024 and Forecast 2025 to 2035, By End Use
    • Introduction / Key Findings
    • Historical Market Size Value (USD Million) Analysis By End Use, 2020 to 2024
    • Current and Future Market Size Value (USD Million) Analysis and Forecast By End Use, 2025 to 2035
      • Commercial Use
      • Institutional Use
      • Household Use
    • Y-o-Y Growth Trend Analysis By End Use, 2020 to 2024
    • Absolute $ Opportunity Analysis By End Use, 2025 to 2035
  9. Global Market Analysis 2020 to 2024 and Forecast 2025 to 2035, By Region
    • Introduction
    • Historical Market Size Value (USD Million) Analysis By Region, 2020 to 2024
    • Current Market Size Value (USD Million) Analysis and Forecast By Region, 2025 to 2035
      • North America
      • Latin America
      • Western Europe
      • Eastern Europe
      • East Asia
      • South Asia and Pacific
      • Middle East & Africa
    • Market Attractiveness Analysis By Region
  10. North America Market Analysis 2020 to 2024 and Forecast 2025 to 2035, By Country
    • Historical Market Size Value (USD Million) Trend Analysis By Market Taxonomy, 2020 to 2024
    • Market Size Value (USD Million) Forecast By Market Taxonomy, 2025 to 2035
      • By Country
        • USA
        • Canada
        • Mexico
      • By Material
      • By Size
      • By End Use
    • Market Attractiveness Analysis
      • By Country
      • By Material
      • By Size
      • By End Use
    • Key Takeaways
  11. Latin America Market Analysis 2020 to 2024 and Forecast 2025 to 2035, By Country
    • Historical Market Size Value (USD Million) Trend Analysis By Market Taxonomy, 2020 to 2024
    • Market Size Value (USD Million) Forecast By Market Taxonomy, 2025 to 2035
      • By Country
        • Brazil
        • Chile
        • Rest of Latin America
      • By Material
      • By Size
      • By End Use
    • Market Attractiveness Analysis
      • By Country
      • By Material
      • By Size
      • By End Use
    • Key Takeaways
  12. Western Europe Market Analysis 2020 to 2024 and Forecast 2025 to 2035, By Country
    • Historical Market Size Value (USD Million) Trend Analysis By Market Taxonomy, 2020 to 2024
    • Market Size Value (USD Million) Forecast By Market Taxonomy, 2025 to 2035
      • By Country
        • Germany
        • UK
        • Italy
        • Spain
        • France
        • Nordic
        • BENELUX
        • Rest of Western Europe
      • By Material
      • By Size
      • By End Use
    • Market Attractiveness Analysis
      • By Country
      • By Material
      • By Size
      • By End Use
    • Key Takeaways
  13. Eastern Europe Market Analysis 2020 to 2024 and Forecast 2025 to 2035, By Country
    • Historical Market Size Value (USD Million) Trend Analysis By Market Taxonomy, 2020 to 2024
    • Market Size Value (USD Million) Forecast By Market Taxonomy, 2025 to 2035
      • By Country
        • Russia
        • Poland
        • Hungary
        • Balkan & Baltic
        • Rest of Eastern Europe
      • By Material
      • By Size
      • By End Use
    • Market Attractiveness Analysis
      • By Country
      • By Material
      • By Size
      • By End Use
    • Key Takeaways
  14. East Asia Market Analysis 2020 to 2024 and Forecast 2025 to 2035, By Country
    • Historical Market Size Value (USD Million) Trend Analysis By Market Taxonomy, 2020 to 2024
    • Market Size Value (USD Million) Forecast By Market Taxonomy, 2025 to 2035
      • By Country
        • China
        • Japan
        • South Korea
      • By Material
      • By Size
      • By End Use
    • Market Attractiveness Analysis
      • By Country
      • By Material
      • By Size
      • By End Use
    • Key Takeaways
  15. South Asia and Pacific Market Analysis 2020 to 2024 and Forecast 2025 to 2035, By Country
    • Historical Market Size Value (USD Million) Trend Analysis By Market Taxonomy, 2020 to 2024
    • Market Size Value (USD Million) Forecast By Market Taxonomy, 2025 to 2035
      • By Country
        • India
        • ASEAN
        • Australia & New Zealand
        • Rest of South Asia and Pacific
      • By Material
      • By Size
      • By End Use
    • Market Attractiveness Analysis
      • By Country
      • By Material
      • By Size
      • By End Use
    • Key Takeaways
  16. Middle East & Africa Market Analysis 2020 to 2024 and Forecast 2025 to 2035, By Country
    • Historical Market Size Value (USD Million) Trend Analysis By Market Taxonomy, 2020 to 2024
    • Market Size Value (USD Million) Forecast By Market Taxonomy, 2025 to 2035
      • By Country
        • Kingdom of Saudi Arabia
        • Other GCC Countries
        • Turkiye
        • South Africa
        • Other African Union
        • Rest of Middle East & Africa
      • By Material
      • By Size
      • By End Use
    • Market Attractiveness Analysis
      • By Country
      • By Material
      • By Size
      • By End Use
    • Key Takeaways
  17. Key Countries Market Analysis
    • USA
      • Pricing Analysis
      • Market Share Analysis, 2024
        • By Material
        • By Size
        • By End Use
    • Canada
      • Pricing Analysis
      • Market Share Analysis, 2024
        • By Material
        • By Size
        • By End Use
    • Mexico
      • Pricing Analysis
      • Market Share Analysis, 2024
        • By Material
        • By Size
        • By End Use
    • Brazil
      • Pricing Analysis
      • Market Share Analysis, 2024
        • By Material
        • By Size
        • By End Use
    • Chile
      • Pricing Analysis
      • Market Share Analysis, 2024
        • By Material
        • By Size
        • By End Use
    • Germany
      • Pricing Analysis
      • Market Share Analysis, 2024
        • By Material
        • By Size
        • By End Use
    • UK
      • Pricing Analysis
      • Market Share Analysis, 2024
        • By Material
        • By Size
        • By End Use
    • Italy
      • Pricing Analysis
      • Market Share Analysis, 2024
        • By Material
        • By Size
        • By End Use
    • Spain
      • Pricing Analysis
      • Market Share Analysis, 2024
        • By Material
        • By Size
        • By End Use
    • France
      • Pricing Analysis
      • Market Share Analysis, 2024
        • By Material
        • By Size
        • By End Use
    • India
      • Pricing Analysis
      • Market Share Analysis, 2024
        • By Material
        • By Size
        • By End Use
    • ASEAN
      • Pricing Analysis
      • Market Share Analysis, 2024
        • By Material
        • By Size
        • By End Use
    • Australia & New Zealand
      • Pricing Analysis
      • Market Share Analysis, 2024
        • By Material
        • By Size
        • By End Use
    • China
      • Pricing Analysis
      • Market Share Analysis, 2024
        • By Material
        • By Size
        • By End Use
    • Japan
      • Pricing Analysis
      • Market Share Analysis, 2024
        • By Material
        • By Size
        • By End Use
    • South Korea
      • Pricing Analysis
      • Market Share Analysis, 2024
        • By Material
        • By Size
        • By End Use
    • Russia
      • Pricing Analysis
      • Market Share Analysis, 2024
        • By Material
        • By Size
        • By End Use
    • Poland
      • Pricing Analysis
      • Market Share Analysis, 2024
        • By Material
        • By Size
        • By End Use
    • Hungary
      • Pricing Analysis
      • Market Share Analysis, 2024
        • By Material
        • By Size
        • By End Use
    • Kingdom of Saudi Arabia
      • Pricing Analysis
      • Market Share Analysis, 2024
        • By Material
        • By Size
        • By End Use
    • Turkiye
      • Pricing Analysis
      • Market Share Analysis, 2024
        • By Material
        • By Size
        • By End Use
    • South Africa
      • Pricing Analysis
      • Market Share Analysis, 2024
        • By Material
        • By Size
        • By End Use
  18. Market Structure Analysis
    • Competition Dashboard
    • Competition Benchmarking
    • Market Share Analysis of Top Players
      • By Regional
      • By Material
      • By Size
      • By End Use
  19. Competition Analysis
    • Competition Deep Dive
      • Smurfit Kappa Group plc
        • Overview
        • Product Portfolio
        • Profitability by Market Segments (Product/Age /Sales Channel/Region)
        • Sales Footprint
        • Strategy Overview
          • Marketing Strategy
          • Product Strategy
          • Channel Strategy
      • Plastic Package, Inc.
      • Inno-Pak, LLC
      • TEMMA SHIKI CO., LTD
      • LINDAR Corporation
      • Napco National
      • Premier Packaging Solutions
      • Dart Container Corporation
      • Pactiv LLC
      • ClipnBox
      • Robinson Plc
      • McLaren Packaging Ltd
      • Graphic Packaging International, LLC
      • Alefh Sp z o.o. Sp. K
      • CoPack Inc.
      • Obtech Corporation (M) Sdn Bhd.
      • Veerkarton BV
      • ZEE Packaging
      • Taylor Box Company
      • Europack
  20. Assumptions & Acronyms Used
  21. Research Methodology

List of Tables

  • Table 1: Global Market Value (USD Million) Forecast by Region, 2020-2035
  • Table 2: Global Market Value (USD Million) Forecast by Material , 2020-2035
  • Table 3: Global Market Value (USD Million) Forecast by Size, 2020-2035
  • Table 4: Global Market Value (USD Million) Forecast by End Use, 2020-2035
  • Table 5: North America Market Value (USD Million) Forecast by Country, 2020-2035
  • Table 6: North America Market Value (USD Million) Forecast by Material , 2020-2035
  • Table 7: North America Market Value (USD Million) Forecast by Size, 2020-2035
  • Table 8: North America Market Value (USD Million) Forecast by End Use, 2020-2035
  • Table 9: Latin America Market Value (USD Million) Forecast by Country, 2020-2035
  • Table 10: Latin America Market Value (USD Million) Forecast by Material , 2020-2035
  • Table 11: Latin America Market Value (USD Million) Forecast by Size, 2020-2035
  • Table 12: Latin America Market Value (USD Million) Forecast by End Use, 2020-2035
  • Table 13: Western Europe Market Value (USD Million) Forecast by Country, 2020-2035
  • Table 14: Western Europe Market Value (USD Million) Forecast by Material , 2020-2035
  • Table 15: Western Europe Market Value (USD Million) Forecast by Size, 2020-2035
  • Table 16: Western Europe Market Value (USD Million) Forecast by End Use, 2020-2035
  • Table 17: Eastern Europe Market Value (USD Million) Forecast by Country, 2020-2035
  • Table 18: Eastern Europe Market Value (USD Million) Forecast by Material , 2020-2035
  • Table 19: Eastern Europe Market Value (USD Million) Forecast by Size, 2020-2035
  • Table 20: Eastern Europe Market Value (USD Million) Forecast by End Use, 2020-2035
  • Table 21: East Asia Market Value (USD Million) Forecast by Country, 2020-2035
  • Table 22: East Asia Market Value (USD Million) Forecast by Material , 2020-2035
  • Table 23: East Asia Market Value (USD Million) Forecast by Size, 2020-2035
  • Table 24: East Asia Market Value (USD Million) Forecast by End Use, 2020-2035
  • Table 25: South Asia and Pacific Market Value (USD Million) Forecast by Country, 2020-2035
  • Table 26: South Asia and Pacific Market Value (USD Million) Forecast by Material , 2020-2035
  • Table 27: South Asia and Pacific Market Value (USD Million) Forecast by Size, 2020-2035
  • Table 28: South Asia and Pacific Market Value (USD Million) Forecast by End Use, 2020-2035
  • Table 29: Middle East & Africa Market Value (USD Million) Forecast by Country, 2020-2035
  • Table 30: Middle East & Africa Market Value (USD Million) Forecast by Material , 2020-2035
  • Table 31: Middle East & Africa Market Value (USD Million) Forecast by Size, 2020-2035
  • Table 32: Middle East & Africa Market Value (USD Million) Forecast by End Use, 2020-2035

List of Figures

  • Figure 1: Global Market Pricing Analysis
  • Figure 2: Global Market Value (USD Million) Forecast 2020-2035
  • Figure 3: Global Market Value Share and BPS Analysis by Material , 2025 and 2035
  • Figure 4: Global Market Y-o-Y Growth Comparison by Material , 2025-2035
  • Figure 5: Global Market Attractiveness Analysis by Material
  • Figure 6: Global Market Value Share and BPS Analysis by Size, 2025 and 2035
  • Figure 7: Global Market Y-o-Y Growth Comparison by Size, 2025-2035
  • Figure 8: Global Market Attractiveness Analysis by Size
  • Figure 9: Global Market Value Share and BPS Analysis by End Use, 2025 and 2035
  • Figure 10: Global Market Y-o-Y Growth Comparison by End Use, 2025-2035
  • Figure 11: Global Market Attractiveness Analysis by End Use
  • Figure 12: Global Market Value (USD Million) Share and BPS Analysis by Region, 2025 and 2035
  • Figure 13: Global Market Y-o-Y Growth Comparison by Region, 2025-2035
  • Figure 14: Global Market Attractiveness Analysis by Region
  • Figure 15: North America Market Incremental Dollar Opportunity, 2025-2035
  • Figure 16: Latin America Market Incremental Dollar Opportunity, 2025-2035
  • Figure 17: Western Europe Market Incremental Dollar Opportunity, 2025-2035
  • Figure 18: Eastern Europe Market Incremental Dollar Opportunity, 2025-2035
  • Figure 19: East Asia Market Incremental Dollar Opportunity, 2025-2035
  • Figure 20: South Asia and Pacific Market Incremental Dollar Opportunity, 2025-2035
  • Figure 21: Middle East & Africa Market Incremental Dollar Opportunity, 2025-2035
  • Figure 22: North America Market Value Share and BPS Analysis by Country, 2025 and 2035
  • Figure 23: North America Market Value Share and BPS Analysis by Material , 2025 and 2035
  • Figure 24: North America Market Y-o-Y Growth Comparison by Material , 2025-2035
  • Figure 25: North America Market Attractiveness Analysis by Material
  • Figure 26: North America Market Value Share and BPS Analysis by Size, 2025 and 2035
  • Figure 27: North America Market Y-o-Y Growth Comparison by Size, 2025-2035
  • Figure 28: North America Market Attractiveness Analysis by Size
  • Figure 29: North America Market Value Share and BPS Analysis by End Use, 2025 and 2035
  • Figure 30: North America Market Y-o-Y Growth Comparison by End Use, 2025-2035
  • Figure 31: North America Market Attractiveness Analysis by End Use
  • Figure 32: Latin America Market Value Share and BPS Analysis by Country, 2025 and 2035
  • Figure 33: Latin America Market Value Share and BPS Analysis by Material , 2025 and 2035
  • Figure 34: Latin America Market Y-o-Y Growth Comparison by Material , 2025-2035
  • Figure 35: Latin America Market Attractiveness Analysis by Material
  • Figure 36: Latin America Market Value Share and BPS Analysis by Size, 2025 and 2035
  • Figure 37: Latin America Market Y-o-Y Growth Comparison by Size, 2025-2035
  • Figure 38: Latin America Market Attractiveness Analysis by Size
  • Figure 39: Latin America Market Value Share and BPS Analysis by End Use, 2025 and 2035
  • Figure 40: Latin America Market Y-o-Y Growth Comparison by End Use, 2025-2035
  • Figure 41: Latin America Market Attractiveness Analysis by End Use
  • Figure 42: Western Europe Market Value Share and BPS Analysis by Country, 2025 and 2035
  • Figure 43: Western Europe Market Value Share and BPS Analysis by Material , 2025 and 2035
  • Figure 44: Western Europe Market Y-o-Y Growth Comparison by Material , 2025-2035
  • Figure 45: Western Europe Market Attractiveness Analysis by Material
  • Figure 46: Western Europe Market Value Share and BPS Analysis by Size, 2025 and 2035
  • Figure 47: Western Europe Market Y-o-Y Growth Comparison by Size, 2025-2035
  • Figure 48: Western Europe Market Attractiveness Analysis by Size
  • Figure 49: Western Europe Market Value Share and BPS Analysis by End Use, 2025 and 2035
  • Figure 50: Western Europe Market Y-o-Y Growth Comparison by End Use, 2025-2035
  • Figure 51: Western Europe Market Attractiveness Analysis by End Use
  • Figure 52: Eastern Europe Market Value Share and BPS Analysis by Country, 2025 and 2035
  • Figure 53: Eastern Europe Market Value Share and BPS Analysis by Material , 2025 and 2035
  • Figure 54: Eastern Europe Market Y-o-Y Growth Comparison by Material , 2025-2035
  • Figure 55: Eastern Europe Market Attractiveness Analysis by Material
  • Figure 56: Eastern Europe Market Value Share and BPS Analysis by Size, 2025 and 2035
  • Figure 57: Eastern Europe Market Y-o-Y Growth Comparison by Size, 2025-2035
  • Figure 58: Eastern Europe Market Attractiveness Analysis by Size
  • Figure 59: Eastern Europe Market Value Share and BPS Analysis by End Use, 2025 and 2035
  • Figure 60: Eastern Europe Market Y-o-Y Growth Comparison by End Use, 2025-2035
  • Figure 61: Eastern Europe Market Attractiveness Analysis by End Use
  • Figure 62: East Asia Market Value Share and BPS Analysis by Country, 2025 and 2035
  • Figure 63: East Asia Market Value Share and BPS Analysis by Material , 2025 and 2035
  • Figure 64: East Asia Market Y-o-Y Growth Comparison by Material , 2025-2035
  • Figure 65: East Asia Market Attractiveness Analysis by Material
  • Figure 66: East Asia Market Value Share and BPS Analysis by Size, 2025 and 2035
  • Figure 67: East Asia Market Y-o-Y Growth Comparison by Size, 2025-2035
  • Figure 68: East Asia Market Attractiveness Analysis by Size
  • Figure 69: East Asia Market Value Share and BPS Analysis by End Use, 2025 and 2035
  • Figure 70: East Asia Market Y-o-Y Growth Comparison by End Use, 2025-2035
  • Figure 71: East Asia Market Attractiveness Analysis by End Use
  • Figure 72: South Asia and Pacific Market Value Share and BPS Analysis by Country, 2025 and 2035
  • Figure 73: South Asia and Pacific Market Value Share and BPS Analysis by Material , 2025 and 2035
  • Figure 74: South Asia and Pacific Market Y-o-Y Growth Comparison by Material , 2025-2035
  • Figure 75: South Asia and Pacific Market Attractiveness Analysis by Material
  • Figure 76: South Asia and Pacific Market Value Share and BPS Analysis by Size, 2025 and 2035
  • Figure 77: South Asia and Pacific Market Y-o-Y Growth Comparison by Size, 2025-2035
  • Figure 78: South Asia and Pacific Market Attractiveness Analysis by Size
  • Figure 79: South Asia and Pacific Market Value Share and BPS Analysis by End Use, 2025 and 2035
  • Figure 80: South Asia and Pacific Market Y-o-Y Growth Comparison by End Use, 2025-2035
  • Figure 81: South Asia and Pacific Market Attractiveness Analysis by End Use
  • Figure 82: Middle East & Africa Market Value Share and BPS Analysis by Country, 2025 and 2035
  • Figure 83: Middle East & Africa Market Value Share and BPS Analysis by Material , 2025 and 2035
  • Figure 84: Middle East & Africa Market Y-o-Y Growth Comparison by Material , 2025-2035
  • Figure 85: Middle East & Africa Market Attractiveness Analysis by Material
  • Figure 86: Middle East & Africa Market Value Share and BPS Analysis by Size, 2025 and 2035
  • Figure 87: Middle East & Africa Market Y-o-Y Growth Comparison by Size, 2025-2035
  • Figure 88: Middle East & Africa Market Attractiveness Analysis by Size
  • Figure 89: Middle East & Africa Market Value Share and BPS Analysis by End Use, 2025 and 2035
  • Figure 90: Middle East & Africa Market Y-o-Y Growth Comparison by End Use, 2025-2035
  • Figure 91: Middle East & Africa Market Attractiveness Analysis by End Use
  • Figure 92: Global Market - Tier Structure Analysis
  • Figure 93: Global Market - Company Share Analysis
Dashboard
Dashboard
Dashboard
Dashboard
Dashboard
Dashboard

Full Research Suite comprises of:

Market outlook & trends analysis

Market outlook & trends analysis

Interviews & case studies

Interviews & case studies

Strategic recommendations

Strategic recommendations

Vendor profiles & capabilities analysis

Vendor profiles & capabilities analysis

5-year forecasts

5-year forecasts

8 regions and 60+ country-level data splits

8 regions and 60+ country-level data splits

Market segment data splits

Market segment data splits

12 months of continuous data updates

12 months of continuous data updates

DELIVERED AS:

PDF EXCEL ONLINE

Full Research Suite


$5000

$7500

$10000

Buy Report Now
Similar Industry Reports

Similar Industry Reports

Cupcake Liner Market

Cupcake Liner Market Size and Share Forecast Outlook 2025 to 2035

Cupcake Containers Market

Cupcake Containers Market Size and Share Forecast Outlook 2025 to 2035

Cupcake Wrappers Market

Cupcake Wrappers Market Size and Share Forecast Outlook 2025 to 2035

Cupcake Wrappers Market Share Analysis

Competitive Landscape of Cupcake Wrappers Manufacturers

Cupcake Tray Machines Market

Cupcake Tray Machines Market

Box Liners Market
Box Liners Market

Box Liners Market Size and Share Forecast Outlook 2025 to 2035

Boxboard Packaging Market

Boxboard Packaging Market Analysis - Size, Share, and Forecast Outlook 2025 to 2035

Box Compression Tester Market

Box Compression Tester Market Size and Share Forecast Outlook 2025 to 2035

Box Latch Market
Box Latch Market

Box Latch Market Size and Share Forecast Outlook 2025 to 2035

Box Pouch Market
Box Pouch Market

Box Pouch Market by Pouch Type from 2025 to 2035

Box Filling Machine Market

Box Filling Machine Market from 2025 to 2035

Box and Carton Overwrap Films Market

Box and Carton Overwrap Films Market Demand and Growth

Box and Carton Overwrapping Machines Market

Box and Carton Overwrapping Machines Market Insights and Growth 2025 to 2035

Boxcar Scars Market
Boxcar Scars Market

Boxcar Scars Market – Demand, Growth & Forecast 2025 to 2035

Box Sealing Machines Market

Box Sealing Machines Market Trends – Growth & Forecast 2025 to 2035

Box Pouch Market Share Analysis

Competitive Breakdown of Box Pouch Providers

Boxboard Packaging Market Share Analysis

Market Share Insights of Boxboard Packaging Providers

Box Latch Market Share Analysis

Box Latch Market Positioning & Competitive Analysis

Box Liners Market Share Analysis

Industry Share Analysis for Box Liners Companies

Carboxymethyl Tamarind Gum (CMT) Market

Carboxymethyl Tamarind Gum (CMT) Market Size and Share Forecast Outlook 2025 to 2035

Future Market Insights

Cupcake Box Market

Chat With MaRIA

Chat With

MaRIA

Hi There, I am MaRIA, Your Market Research Intelligence Assistant. How may I help you?