Cup Holder Market Size and Share Forecast Outlook 2025 to 2035

The global cup holder market is valued at USD 371.8 million in 2025 and is forecast to reach USD 617.3 million by 2035, registering a CAGR of 5.2% during the period. In 2025, the single cup segment holds 45% share, reflecting strong demand for convenience packaging solutions.
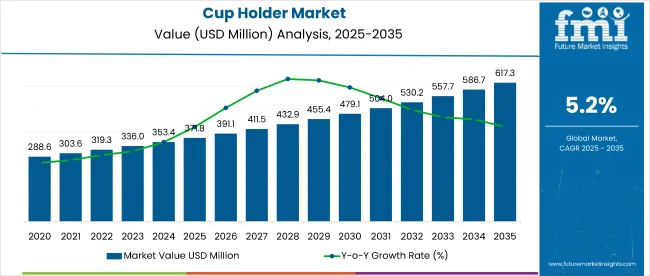
Quick Stats for Cup Holder Market

  • Market value in 2025: USD 371.8 million
  • Projected value in 2035: USD 617.3 million
  • Compound annual growth rate (2025-2035): 5.2%
  • Largest segment by carrying capacity (2025): Single cup (45%)
  • Leading material segment (2025): Paper (48%)
  • Top regional CAGR (2025 to 2035): United States and EU (4.8%)

Cup Holder Market Market

Attribute Detail
Market Size (2025) USD 371.8 million
Market Size (2035) USD 617.3 million
CAGR (2025 to 2035) 5.2%

Paper-based cup holders dominate the material landscape with a 48% market share, supported by increasing environmental regulations and consumer preference for recyclable products. Regionally, the United States and European Union markets are poised to grow at 4.8% CAGR, with the UK close behind at 4.7%. Demand is primarily driven by the expanding food service industry and growing institutional use across multiple end-use sectors.

The cup holder market is propelled by rising demand for sustainable and convenient beverage packaging solutions, particularly in quick-service restaurants and institutional settings. Regulations targeting single-use plastics drive material innovation toward paper and molded pulp alternatives.

However, cost constraints and competition from reusable cup holders restrain growth in some regions. Opportunities exist in emerging markets with expanding food service infrastructure and in product innovation to enhance durability and eco-friendliness. Trends include integration of biodegradable materials and customization for brand differentiation.

Cup Holder Market Analysis by Top Investment Segments

The Cup Holder Market is segmented by material, carrying capacity, and end use. By material, the market includes Plastic, Paper, Wood, and Molded Pulp. In terms of carrying capacity, segments are Single Cup, 2-4 Cups, and Above 4 Cups.

The end-use classification comprises Food Service (including Quick Service Restaurants, Hotels, Restaurants, Cafes, and Others), Institutional, and Household sectors. This segmentation enables detailed analysis of market dynamics and growth opportunities across various product types and applications.
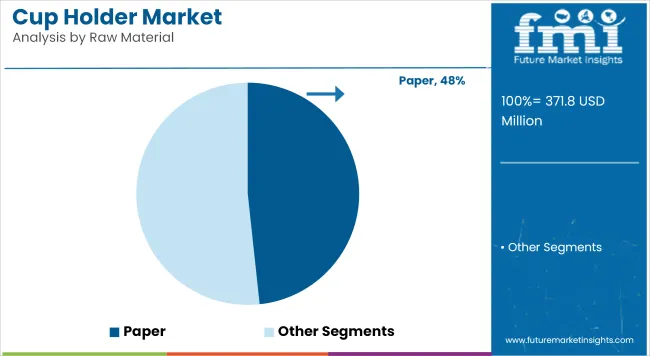
By Material, Paper Accounts for 48% Market Share

Cup Holder Market Analysis By Raw Material

In 2025, the Paper segment leads the cup holder market by material, accounting for 48% of the total market share. Paper-based cup holders are preferred for their recyclability and alignment with tightening environmental regulations globally. Growth in this segment is driven by increasing consumer and regulatory pressure to reduce single-use plastics.

Plastic cup holders remain significant due to their durability and cost-effectiveness but face headwinds from sustainability mandates. Wood and molded pulp materials are emerging as eco-friendly alternatives, supported by innovation in biodegradable and compostable product designs. These materials are expected to register above-average CAGR through 2035, fueled by food service providers’ shift toward sustainable packaging solutions.
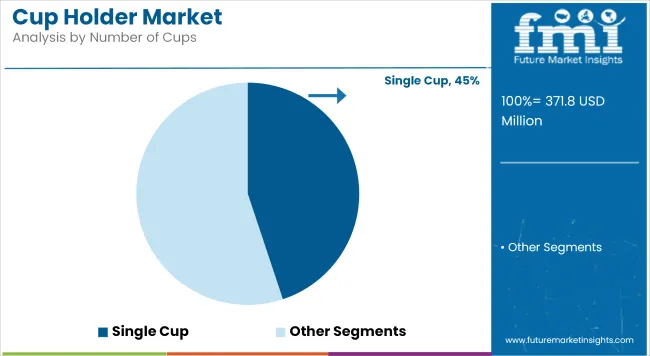
By Carrying Capacity, Single Cup Segment Accounts for 45% Market Share

Cup Holder Market Analysis By Number Of Cups

The Single Cup segment holds the largest share of 45% in 2025 within the carrying capacity category. This dominance is driven by the widespread use of single cup holders in quick-service restaurants and takeaway outlets, where convenience and cost-efficiency are paramount.

The 2-4 Cups segment follows, catering primarily to multi-beverage orders and family servings, while the Above 4 Cups segment represents specialized applications such as catering and large orders. Growth in multi-cup holders is supported by evolving consumer behaviorfavoring bulk purchases and group dining experiences. However, single cup holders remain the most widely adopted due to their simplicity and lower cost.

Food service Segment Dominates by End Use

The Food Service segment dominates the cup holder market, driven primarily by quick-service restaurants, hotels, restaurants, and cafes, accounting for the largest share in 2025. Rising consumer demand for convenient and hygienic beverage packaging fuels this segment’s growth. Institutional end use, which includes schools, hospitals, and corporate offices, is expanding steadily due to increased on-premise beverage consumption and catering services.

The Household segment, while smaller, is growing as consumers adopt more at-home beverage consumption habits, supported by the rise of food delivery and takeaway culture. This diverse end-use landscape ensures sustained demand across both commercial and residential channels.

Cup Holder Market Analysis by Country

The Cup Holder Market is expected to grow steadily across major countries from 2025 to 2035. The United States and the European Union both register a CAGR of 4.8%, driven by mature food service industries and increasing regulations favoring sustainable packaging. The United Kingdom follows closely with a 4.7% CAGR, supported by growing demand in quick-service restaurants and institutional sectors.

The fourth leading country shows a CAGR of 4.6%, reflecting stable growth through rising consumer convenience trends and environmental policies. These countries collectively represent the bulk of market value and innovation, setting benchmarks for material substitution and product design in the global market.

United States Cup Holder Market Analysis

The United States cup holder market is poised for steady expansion, growing at a CAGR of 4.8% from 2025 to 2035. This growth is underpinned by the country’s well-established food service sector, including a robust network of quick-service restaurants, cafes, and institutional buyers such as schools and hospitals.

Increasing regulatory pressure to reduce plastic waste is driving manufacturers and consumers toward sustainable alternatives, notably paper and molded pulp cup holders. Consumer preference shifts toward environmentally friendly and recyclable packaging further bolster demand.

Innovation in materials and design is expected to remain a key competitive differentiator, with companies investing in biodegradable products and customizable cup holders that meet evolving brand requirements. Despite the positive outlook, challenges persist. Competition from reusable cup holders and higher raw material costs create cost-sensitive conditions for manufacturers and end users. Supply chain disruptions could also impact availability and pricing. Nevertheless, ongoing investments in eco-friendly solutions and regulatory incentives offer significant opportunities for growth.

With a market size estimated at USD 85.6 million in 2025, expanding to USD 132.6 million by 2035, the USA cup holder market presents substantial absolute growth potential. Its mature yet evolving nature makes it a critical region for manufacturers aiming to lead sustainable packaging innovations.

European Union Cup Holder Market Analysis

The European Union (EU) cup holder market is forecast to expand at a CAGR of 4.8% between 2025 and 2035. This robust growth is fueled primarily by the region’s rigorous environmental policies and regulations aimed at reducing plastic waste and promoting circular economy principles. Countries within Western Europe are the main contributors to demand, where consumers and institutional buyers increasingly favor sustainable packaging solutions such as paper-based and biodegradable cup holders.

The EU’s commitment to phasing out single-use plastics creates both regulatory impetus and market opportunities. Manufacturers are focusing on innovation in molded pulp, wood, and other bio-based materials to capture emerging market segments. Quick-service restaurants, hotels, and institutional sectors are significant end users, driving volume growth.

Cost pressures, however, remain a notable challenge. The transition to eco-friendly materials can lead to higher production costs and supply chain complexities, potentially constraining margins. Additionally, material availability and fluctuating raw material prices add uncertainty.

Despite these challenges, the EU’s cup holder market benefits from heightened consumer awareness of sustainability and strong government support. The market size is projected to grow from USD 79.3 million in 2025 to USD 123.0 million by 2035. This steady growth aligns with broader European objectives on sustainable packaging, making the EU a vital region for innovation and expansion in the cup holder market.

United Kingdom Cup Holder Market Analysis

The United Kingdom cup holder market is expected to grow at a CAGR of 4.7% over the forecast period 2025 to 2035. The market recovery following the pandemic and increased demand for sustainable disposable packaging solutions are key drivers. Quick-service restaurants remain the primary consumers, actively adopting paper and molded pulp cup holders to meet both regulatory requirements and growing consumer preference for environmentally friendly packaging.

Institutional sectors such as education, healthcare, and corporate facilities contribute to steady demand growth. Government policies targeting single-use plastics further encourage manufacturers to innovate and expand their biodegradable product offerings. Despite the positive momentum, rising raw material costs, particularly for eco-friendly materials, exert cost pressures on manufacturers and suppliers.

The UK market is moderately competitive, with players focusing on product differentiation through biodegradability and customization to cater to brand-specific requirements. The food service industry's dynamic nature and evolving consumer expectations create multiple growth avenues. Market size is estimated at USD 18.4 million in 2025 and projected to reach USD 28.9 million by 2035, reflecting consistent growth supported by sustainability initiatives and recovering demand in hospitality sectors.

Overall, the UK cup holder market offers promising opportunities for companies investing in sustainable packaging innovation and efficient supply chain management.

Cup Holder Market Players and Strategies

The cup holder market is moderately consolidated with several key players holding significant market shares across regions and segments. Leading companies such as MULTIPAP, Huhtamaki Oyj, Georgia-Pacific Consumer Products, and WestRock Company dominate through broad product portfolios, geographic reach, and strong distribution networks. These firms invest heavily in research and development to innovate sustainable materials, including paper, molded pulp, and wood alternatives, responding to regulatory pressures and shifting consumer preferences toward eco-friendly packaging.

Competition centers on material innovation, cost efficiency, and customization capabilities, particularly for quick-service restaurants and institutional buyers. Companies like Sabert Corporation and Pactiv LLC have strengthened their market positions by expanding biodegradable and compostable product lines, enhancing their appeal in markets with stringent environmental regulations. Mid-tier players such as Green Paper Products, LLC and PakTech focus on niche segments, emphasizing quality and regional expertise.

Supply chain resilience and the ability to adapt to fluctuating raw material costs represent critical competitive factors. The rise of reusable cup holders introduces indirect competition, prompting players to differentiate through sustainability credentials and product design. Startups leveraging novel bio-based materials and digital printing for customization present emerging competitive threats. Overall, winners will be those who balance innovation with operational efficiency and anticipate evolving regulatory landscapes.

  • MULTIPAP
  • Green Paper Products, LLC
  • Huhtamaki Oyj
  • Georgia-Pacific Consumer Products LP
  • Sabert Corporation
  • Pactiv LLC
  • Southern Champion Tray, LP
  • Graphic Packaging International, LLC
  • PakTech
  • WestRock Company

Report Scope Table

Metric Value
Market Size (2025) USD 371.8 million
Market Size (2035) USD 617.3 million
CAGR (2025 to 2035) 5.2%
Base Year 2025
Historical Period 2020 to 2024
Forecast Period 2025 to 2035
Units USD Million
Segmentation By Material (Plastic, Paper, Wood, Molded Pulp); By Carrying Capacity (Single Cup, 2-4 Cups, Above 4 Cups); By End Use (Food Service, Institutional, Household)
Geographic Coverage North America (USA, Canada, Mexico), Latin America, Western Europe, Eastern Europe, East Asia (China, Japan, South Korea), South Asia & Pacific (India, Australia, ASEAN), Middle East & Africa
Key Companies Covered MULTIPAP, Green Paper Products, LLC, Huhtamaki Oyj, Georgia-Pacific Consumer Products LP, Sabert Corporation, Pactiv LLC, Southern Champion Tray, LP, Graphic Packaging International, LLC, PakTech, WestRock Company
Research Methodology Secondary research, expert interviews, market modeling and forecasting

Key Segments

By Material:

  • Plastic
  • Paper
  • Wood
  • Molded Pulp

By Carrying Capacity:

  • Single Cup
  • 2-4 Cups
  • Above 4 Cups

By End Use:

  • Food Service
    • Quick Service Restaurants
    • Hotels
    • Restaurants
    • Cafes
    • Others
  • Institutional
  • Household

By Region:

  • North America
  • Latin America
  • Europe
  • Middle East & Africa (MEA)
  • South Asia
  • East Asia
  • Oceania

Table of Content

  1. Executive Summary
    • Global Market Outlook
    • Demand-side Trends
    • Supply-side Trends
    • Technology Roadmap Analysis
    • Analysis and Recommendations
  2. Market Overview
    • Market Coverage/Taxonomy
    • Market Definition/Scope/Limitations
  3. Market Background
    • Market Dynamics
      • Drivers
      • Restraints
      • Opportunity
      • Trends
    • Scenario Forecast
      • Demand in Optimistic Scenario
      • Demand in Likely Scenario
      • Demand in Conservative Scenario
    • Opportunity Map Analysis
    • Product Life Cycle Analysis
    • Supply Chain Analysis
      • Supply Side Participants and their Roles
        • Producers
        • Mid-Level Participants (Traders/ Agents/ Brokers)
        • Wholesalers and Distributors
      • Value Added and Value Created at Node in the Supply Chain
      • List of Raw Material Suppliers
      • List of Existing and Potential Buyer’s
    • Investment Feasibility Matrix
    • Value Chain Analysis
      • Profit Margin Analysis
      • Wholesalers and Distributors
      • Retailers
    • PESTLE and Porter’s Analysis
    • Regulatory Landscape
      • By Key Regions
      • By Key Countries
    • Regional Parent Market Outlook
    • Production and Consumption Statistics
    • Import and Export Statistics
  4. Global Market Analysis 2020 to 2024 and Forecast, 2025 to 2035
    • Historical Market Size Value (USD Million) & Volume (Units) Analysis, 2020 to 2024
    • Current and Future Market Size Value (USD Million) & Volume (Units) Projections, 2025 to 2035
      • Y-o-Y Growth Trend Analysis
      • Absolute $ Opportunity Analysis
  5. Global Market Pricing Analysis 2020 to 2024 and Forecast 2025 to 2035
  6. Global Market Analysis 2020 to 2024 and Forecast 2025 to 2035, By Material
    • Introduction/Key Findings
    • Historical Market Size Value (USD Million) & Volume (Units) Analysis By Material, 2020 to 2024
    • Current and Future Market Size Value (USD Million) & Volume (Units) Analysis and Forecast By Material, 2025 to 2035
      • Plastic
      • Paper
      • Wood
      • Molded Pulp
    • Y-o-Y Growth Trend Analysis By Material, 2020 to 2024
    • Absolute $ Opportunity Analysis By Material, 2025 to 2035
  7. Global Market Analysis 2020 to 2024 and Forecast 2025 to 2035, By Carrying Capacity
    • Introduction/Key Findings
    • Historical Market Size Value (USD Million) & Volume (Units) Analysis By Carrying Capacity, 2020 to 2024
    • Current and Future Market Size Value (USD Million) & Volume (Units) Analysis and Forecast By Carrying Capacity, 2025 to 2035
      • Single cup
      • 2-4 cups
      • Above 4 cups
    • Y-o-Y Growth Trend Analysis By Carrying Capacity, 2020 to 2024
    • Absolute $ Opportunity Analysis By Carrying Capacity, 2025 to 2035
  8. Global Market Analysis 2020 to 2024 and Forecast 2025 to 2035, By End Use
    • Introduction/Key Findings
    • Historical Market Size Value (USD Million) & Volume (Units) Analysis By End Use, 2020 to 2024
    • Current and Future Market Size Value (USD Million) & Volume (Units) Analysis and Forecast By End Use, 2025 to 2035
      • Food Service
        • Quick Service Restaurants
        • Hotels
        • Restaurants
        • Cafes
        • Others
      • Institutional
      • Household
    • Y-o-Y Growth Trend Analysis By End Use, 2020 to 2024
    • Absolute $ Opportunity Analysis By End Use, 2025 to 2035
  9. Global Market Analysis 2020 to 2024 and Forecast 2025 to 2035, By Region
    • Introduction
    • Historical Market Size Value (USD Million) & Volume (Units) Analysis By Region, 2020 to 2024
    • Current Market Size Value (USD Million) & Volume (Units) Analysis and Forecast By Region, 2025 to 2035
      • North America
      • Latin America
      • Western Europe
      • Eastern Europe
      • East Asia
      • South Asia & Pacific
      • Middle East and Africa
    • Market Attractiveness Analysis By Region
  10. North America Market Analysis 2020 to 2024 and Forecast 2025 to 2035, By Country
    • Historical Market Size Value (USD Million) & Volume (Units) Trend Analysis By Market Taxonomy, 2020 to 2024
    • Market Size Value (USD Million) & Volume (Units) Forecast By Market Taxonomy, 2025 to 2035
      • By Country
        • USA
        • Canada
        • Mexico
      • By Material
      • By Carrying Capacity
      • By End Use
    • Market Attractiveness Analysis
      • By Country
      • By Material
      • By Carrying Capacity
      • By End Use
    • Key Takeaways
  11. Latin America Market Analysis 2020 to 2024 and Forecast 2025 to 2035, By Country
    • Historical Market Size Value (USD Million) & Volume (Units) Trend Analysis By Market Taxonomy, 2020 to 2024
    • Market Size Value (USD Million) & Volume (Units) Forecast By Market Taxonomy, 2025 to 2035
      • By Country
        • Brazil
        • Argentina
        • Rest of LATAM
      • By Material
      • By Carrying Capacity
      • By End Use
    • Market Attractiveness Analysis
      • By Country
      • By Material
      • By Carrying Capacity
      • By End Use
    • Key Takeaways
  12. Western Europe Market Analysis 2020 to 2024 and Forecast 2025 to 2035, By Country
    • Historical Market Size Value (USD Million) & Volume (Units) Trend Analysis By Market Taxonomy, 2020 to 2024
    • Market Size Value (USD Million) & Volume (Units) Forecast By Market Taxonomy, 2025 to 2035
      • By Country
        • Germany
        • Italy
        • France
        • UK
        • Spain
        • BENELUX
        • Nordic
        • Rest of W.Europe
      • By Material
      • By Carrying Capacity
      • By End Use
    • Market Attractiveness Analysis
      • By Country
      • By Material
      • By Carrying Capacity
      • By End Use
    • Key Takeaways
  13. Eastern Europe Market Analysis 2020 to 2024 and Forecast 2025 to 2035, By Country
    • Historical Market Size Value (USD Million) & Volume (Units) Trend Analysis By Market Taxonomy, 2020 to 2024
    • Market Size Value (USD Million) & Volume (Units) Forecast By Market Taxonomy, 2025 to 2035
      • By Country
        • Russia
        • Hungary
        • Poland
        • Balkan & Baltics
        • Rest of E. Europe
      • By Material
      • By Carrying Capacity
      • By End Use
    • Market Attractiveness Analysis
      • By Country
      • By Material
      • By Carrying Capacity
      • By End Use
    • Key Takeaways
  14. East Asia Market Analysis 2020 to 2024 and Forecast 2025 to 2035, By Country
    • Historical Market Size Value (USD Million) & Volume (Units) Trend Analysis By Market Taxonomy, 2020 to 2024
    • Market Size Value (USD Million) & Volume (Units) Forecast By Market Taxonomy, 2025 to 2035
      • By Country
        • China
        • Japan
        • South Korea
      • By Material
      • By Carrying Capacity
      • By End Use
    • Market Attractiveness Analysis
      • By Country
      • By Material
      • By Carrying Capacity
      • By End Use
    • Key Takeaways
  15. South Asia & Pacific Market Analysis 2020 to 2024 and Forecast 2025 to 2035, By Country
    • Historical Market Size Value (USD Million) & Volume (Units) Trend Analysis By Market Taxonomy, 2020 to 2024
    • Market Size Value (USD Million) & Volume (Units) Forecast By Market Taxonomy, 2025 to 2035
      • By Country
        • India
        • Australia & New Zealand
        • ASEAN
        • Rest of SAP
      • By Material
      • By Carrying Capacity
      • By End Use
    • Market Attractiveness Analysis
      • By Country
      • By Material
      • By Carrying Capacity
      • By End Use
    • Key Takeaways
  16. Middle East and Africa Market Analysis 2020 to 2024 and Forecast 2025 to 2035, By Country
    • Historical Market Size Value (USD Million) & Volume (Units) Trend Analysis By Market Taxonomy, 2020 to 2024
    • Market Size Value (USD Million) & Volume (Units) Forecast By Market Taxonomy, 2025 to 2035
      • By Country
        • GCC Countries
        • Northern Africa
        • South Africa
        • Turkiye
        • Rest of MEA
      • By Material
      • By Carrying Capacity
      • By End Use
    • Market Attractiveness Analysis
      • By Country
      • By Material
      • By Carrying Capacity
      • By End Use
    • Key Takeaways
  17. Key Countries Market Analysis
    • USA
      • Pricing Analysis
      • Market Share Analysis, 2024
        • By Material
        • By Carrying Capacity
        • By End Use
    • Canada
      • Pricing Analysis
      • Market Share Analysis, 2024
        • By Material
        • By Carrying Capacity
        • By End Use
    • Brazil
      • Pricing Analysis
      • Market Share Analysis, 2024
        • By Material
        • By Carrying Capacity
        • By End Use
    • Mexico
      • Pricing Analysis
      • Market Share Analysis, 2024
        • By Material
        • By Carrying Capacity
        • By End Use
    • Argentina
      • Pricing Analysis
      • Market Share Analysis, 2024
        • By Material
        • By Carrying Capacity
        • By End Use
  18. Market Structure Analysis
    • Competition Dashboard
    • Competition Benchmarking
    • Market Share Analysis of Top Players
      • By Regional
      • By Material
      • By Carrying Capacity
      • By End Use
  19. Competition Analysis
    • Competition Deep Dive
      • MULTIPAP
        • Overview
        • Product Portfolio
        • Profitability by Market Segments (Product/Age /Sales Channel/Region)
        • Sales Footprint
        • Strategy Overview
          • Marketing Strategy
          • Product Strategy
          • Channel Strategy
      • Green Paper Products, LLC.
        • Overview
        • Product Portfolio
        • Profitability by Market Segments (Product/Age /Sales Channel/Region)
        • Sales Footprint
        • Strategy Overview
          • Marketing Strategy
          • Product Strategy
          • Channel Strategy
      • Huhtamaki Oyj
        • Overview
        • Product Portfolio
        • Profitability by Market Segments (Product/Age /Sales Channel/Region)
        • Sales Footprint
        • Strategy Overview
          • Marketing Strategy
          • Product Strategy
          • Channel Strategy
      • Georgia-Pacific Consumer Products LP
        • Overview
        • Product Portfolio
        • Profitability by Market Segments (Product/Age /Sales Channel/Region)
        • Sales Footprint
        • Strategy Overview
          • Marketing Strategy
          • Product Strategy
          • Channel Strategy
      • Sabert Corporation
        • Overview
        • Product Portfolio
        • Profitability by Market Segments (Product/Age /Sales Channel/Region)
        • Sales Footprint
        • Strategy Overview
          • Marketing Strategy
          • Product Strategy
          • Channel Strategy
      • Pactiv LLC
        • Overview
        • Product Portfolio
        • Profitability by Market Segments (Product/Age /Sales Channel/Region)
        • Sales Footprint
        • Strategy Overview
          • Marketing Strategy
          • Product Strategy
          • Channel Strategy
      • Southern Champion Tray, LP
        • Overview
        • Product Portfolio
        • Profitability by Market Segments (Product/Age /Sales Channel/Region)
        • Sales Footprint
        • Strategy Overview
          • Marketing Strategy
          • Product Strategy
          • Channel Strategy
      • Graphic Packaging International, LLC
        • Overview
        • Product Portfolio
        • Profitability by Market Segments (Product/Age /Sales Channel/Region)
        • Sales Footprint
        • Strategy Overview
          • Marketing Strategy
          • Product Strategy
          • Channel Strategy
      • PakTech
        • Overview
        • Product Portfolio
        • Profitability by Market Segments (Product/Age /Sales Channel/Region)
        • Sales Footprint
        • Strategy Overview
          • Marketing Strategy
          • Product Strategy
          • Channel Strategy
      • WestRock Company
        • Overview
        • Product Portfolio
        • Profitability by Market Segments (Product/Age /Sales Channel/Region)
        • Sales Footprint
        • Strategy Overview
          • Marketing Strategy
          • Product Strategy
          • Channel Strategy
  20. Assumptions & Acronyms Used
  21. Research Methodology

List of Tables

  • Table 1: Global Market Value (USD Million) Forecast by Region, 2020-2035
  • Table 2: Global Market Volume (Units) Forecast by Region, 2020-2035
  • Table 3: Global Market Value (USD Million) Forecast by Material, 2020-2035
  • Table 4: Global Market Volume (Units) Forecast by Material, 2020-2035
  • Table 5: Global Market Value (USD Million) Forecast by Carrying Capacity, 2020-2035
  • Table 6: Global Market Volume (Units) Forecast by Carrying Capacity, 2020-2035
  • Table 7: Global Market Value (USD Million) Forecast by End Use, 2020-2035
  • Table 8: Global Market Volume (Units) Forecast by End Use, 2020-2035
  • Table 9: North America Market Value (USD Million) Forecast by Country, 2020-2035
  • Table 10: North America Market Volume (Units) Forecast by Country, 2020-2035
  • Table 11: North America Market Value (USD Million) Forecast by Material, 2020-2035
  • Table 12: North America Market Volume (Units) Forecast by Material, 2020-2035
  • Table 13: North America Market Value (USD Million) Forecast by Carrying Capacity, 2020-2035
  • Table 14: North America Market Volume (Units) Forecast by Carrying Capacity, 2020-2035
  • Table 15: North America Market Value (USD Million) Forecast by End Use, 2020-2035
  • Table 16: North America Market Volume (Units) Forecast by End Use, 2020-2035
  • Table 17: Latin America Market Value (USD Million) Forecast by Country, 2020-2035
  • Table 18: Latin America Market Volume (Units) Forecast by Country, 2020-2035
  • Table 19: Latin America Market Value (USD Million) Forecast by Material, 2020-2035
  • Table 20: Latin America Market Volume (Units) Forecast by Material, 2020-2035
  • Table 21: Latin America Market Value (USD Million) Forecast by Carrying Capacity, 2020-2035
  • Table 22: Latin America Market Volume (Units) Forecast by Carrying Capacity, 2020-2035
  • Table 23: Latin America Market Value (USD Million) Forecast by End Use, 2020-2035
  • Table 24: Latin America Market Volume (Units) Forecast by End Use, 2020-2035
  • Table 25: Western Europe Market Value (USD Million) Forecast by Country, 2020-2035
  • Table 26: Western Europe Market Volume (Units) Forecast by Country, 2020-2035
  • Table 27: Western Europe Market Value (USD Million) Forecast by Material, 2020-2035
  • Table 28: Western Europe Market Volume (Units) Forecast by Material, 2020-2035
  • Table 29: Western Europe Market Value (USD Million) Forecast by Carrying Capacity, 2020-2035
  • Table 30: Western Europe Market Volume (Units) Forecast by Carrying Capacity, 2020-2035
  • Table 31: Western Europe Market Value (USD Million) Forecast by End Use, 2020-2035
  • Table 32: Western Europe Market Volume (Units) Forecast by End Use, 2020-2035
  • Table 33: Eastern Europe Market Value (USD Million) Forecast by Country, 2020-2035
  • Table 34: Eastern Europe Market Volume (Units) Forecast by Country, 2020-2035
  • Table 35: Eastern Europe Market Value (USD Million) Forecast by Material, 2020-2035
  • Table 36: Eastern Europe Market Volume (Units) Forecast by Material, 2020-2035
  • Table 37: Eastern Europe Market Value (USD Million) Forecast by Carrying Capacity, 2020-2035
  • Table 38: Eastern Europe Market Volume (Units) Forecast by Carrying Capacity, 2020-2035
  • Table 39: Eastern Europe Market Value (USD Million) Forecast by End Use, 2020-2035
  • Table 40: Eastern Europe Market Volume (Units) Forecast by End Use, 2020-2035
  • Table 41: East Asia Market Value (USD Million) Forecast by Country, 2020-2035
  • Table 42: East Asia Market Volume (Units) Forecast by Country, 2020-2035
  • Table 43: East Asia Market Value (USD Million) Forecast by Material, 2020-2035
  • Table 44: East Asia Market Volume (Units) Forecast by Material, 2020-2035
  • Table 45: East Asia Market Value (USD Million) Forecast by Carrying Capacity, 2020-2035
  • Table 46: East Asia Market Volume (Units) Forecast by Carrying Capacity, 2020-2035
  • Table 47: East Asia Market Value (USD Million) Forecast by End Use, 2020-2035
  • Table 48: East Asia Market Volume (Units) Forecast by End Use, 2020-2035
  • Table 49: South Asia & Pacific Market Value (USD Million) Forecast by Country, 2020-2035
  • Table 50: South Asia & Pacific Market Volume (Units) Forecast by Country, 2020-2035
  • Table 51: South Asia & Pacific Market Value (USD Million) Forecast by Material, 2020-2035
  • Table 52: South Asia & Pacific Market Volume (Units) Forecast by Material, 2020-2035
  • Table 53: South Asia & Pacific Market Value (USD Million) Forecast by Carrying Capacity, 2020-2035
  • Table 54: South Asia & Pacific Market Volume (Units) Forecast by Carrying Capacity, 2020-2035
  • Table 55: South Asia & Pacific Market Value (USD Million) Forecast by End Use, 2020-2035
  • Table 56: South Asia & Pacific Market Volume (Units) Forecast by End Use, 2020-2035
  • Table 57: Middle East and Africa Market Value (USD Million) Forecast by Country, 2020-2035
  • Table 58: Middle East and Africa Market Volume (Units) Forecast by Country, 2020-2035
  • Table 59: Middle East and Africa Market Value (USD Million) Forecast by Material, 2020-2035
  • Table 60: Middle East and Africa Market Volume (Units) Forecast by Material, 2020-2035
  • Table 61: Middle East and Africa Market Value (USD Million) Forecast by Carrying Capacity, 2020-2035
  • Table 62: Middle East and Africa Market Volume (Units) Forecast by Carrying Capacity, 2020-2035
  • Table 63: Middle East and Africa Market Value (USD Million) Forecast by End Use, 2020-2035
  • Table 64: Middle East and Africa Market Volume (Units) Forecast by End Use, 2020-2035

List of Figures

  • Figure 1: Global Market Volume (Units) Forecast 2020-2035
  • Figure 2: Global Market Pricing Analysis
  • Figure 3: Global Market Value (USD Million) Forecast 2020-2035
  • Figure 4: Global Market Value Share and BPS Analysis by Material, 2025 and 2035
  • Figure 5: Global Market Y-o-Y Growth Comparison by Material, 2025-2035
  • Figure 6: Global Market Attractiveness Analysis by Material
  • Figure 7: Global Market Value Share and BPS Analysis by Carrying Capacity, 2025 and 2035
  • Figure 8: Global Market Y-o-Y Growth Comparison by Carrying Capacity, 2025-2035
  • Figure 9: Global Market Attractiveness Analysis by Carrying Capacity
  • Figure 10: Global Market Value Share and BPS Analysis by End Use, 2025 and 2035
  • Figure 11: Global Market Y-o-Y Growth Comparison by End Use, 2025-2035
  • Figure 12: Global Market Attractiveness Analysis by End Use
  • Figure 13: Global Market Value (USD Million) Share and BPS Analysis by Region, 2025 and 2035
  • Figure 14: Global Market Y-o-Y Growth Comparison by Region, 2025-2035
  • Figure 15: Global Market Attractiveness Analysis by Region
  • Figure 16: North America Market Incremental $ Opportunity, 2025-2035
  • Figure 17: Latin America Market Incremental $ Opportunity, 2025-2035
  • Figure 18: Western Europe Market Incremental $ Opportunity, 2025-2035
  • Figure 19: Eastern Europe Market Incremental $ Opportunity, 2025-2035
  • Figure 20: East Asia Market Incremental $ Opportunity, 2025-2035
  • Figure 21: South Asia & Pacific Market Incremental $ Opportunity, 2025-2035
  • Figure 22: Middle East and Africa Market Incremental $ Opportunity, 2025-2035
  • Figure 23: North America Market Value Share and BPS Analysis by Country, 2025 and 2035
  • Figure 24: North America Market Value Share and BPS Analysis by Material, 2025 and 2035
  • Figure 25: North America Market Y-o-Y Growth Comparison by Material, 2025-2035
  • Figure 26: North America Market Attractiveness Analysis by Material
  • Figure 27: North America Market Value Share and BPS Analysis by Carrying Capacity, 2025 and 2035
  • Figure 28: North America Market Y-o-Y Growth Comparison by Carrying Capacity, 2025-2035
  • Figure 29: North America Market Attractiveness Analysis by Carrying Capacity
  • Figure 30: North America Market Value Share and BPS Analysis by End Use, 2025 and 2035
  • Figure 31: North America Market Y-o-Y Growth Comparison by End Use, 2025-2035
  • Figure 32: North America Market Attractiveness Analysis by End Use
  • Figure 33: Latin America Market Value Share and BPS Analysis by Country, 2025 and 2035
  • Figure 34: Latin America Market Value Share and BPS Analysis by Material, 2025 and 2035
  • Figure 35: Latin America Market Y-o-Y Growth Comparison by Material, 2025-2035
  • Figure 36: Latin America Market Attractiveness Analysis by Material
  • Figure 37: Latin America Market Value Share and BPS Analysis by Carrying Capacity, 2025 and 2035
  • Figure 38: Latin America Market Y-o-Y Growth Comparison by Carrying Capacity, 2025-2035
  • Figure 39: Latin America Market Attractiveness Analysis by Carrying Capacity
  • Figure 40: Latin America Market Value Share and BPS Analysis by End Use, 2025 and 2035
  • Figure 41: Latin America Market Y-o-Y Growth Comparison by End Use, 2025-2035
  • Figure 42: Latin America Market Attractiveness Analysis by End Use
  • Figure 43: Western Europe Market Value Share and BPS Analysis by Country, 2025 and 2035
  • Figure 44: Western Europe Market Value Share and BPS Analysis by Material, 2025 and 2035
  • Figure 45: Western Europe Market Y-o-Y Growth Comparison by Material, 2025-2035
  • Figure 46: Western Europe Market Attractiveness Analysis by Material
  • Figure 47: Western Europe Market Value Share and BPS Analysis by Carrying Capacity, 2025 and 2035
  • Figure 48: Western Europe Market Y-o-Y Growth Comparison by Carrying Capacity, 2025-2035
  • Figure 49: Western Europe Market Attractiveness Analysis by Carrying Capacity
  • Figure 50: Western Europe Market Value Share and BPS Analysis by End Use, 2025 and 2035
  • Figure 51: Western Europe Market Y-o-Y Growth Comparison by End Use, 2025-2035
  • Figure 52: Western Europe Market Attractiveness Analysis by End Use
  • Figure 53: Eastern Europe Market Value Share and BPS Analysis by Country, 2025 and 2035
  • Figure 54: Eastern Europe Market Value Share and BPS Analysis by Material, 2025 and 2035
  • Figure 55: Eastern Europe Market Y-o-Y Growth Comparison by Material, 2025-2035
  • Figure 56: Eastern Europe Market Attractiveness Analysis by Material
  • Figure 57: Eastern Europe Market Value Share and BPS Analysis by Carrying Capacity, 2025 and 2035
  • Figure 58: Eastern Europe Market Y-o-Y Growth Comparison by Carrying Capacity, 2025-2035
  • Figure 59: Eastern Europe Market Attractiveness Analysis by Carrying Capacity
  • Figure 60: Eastern Europe Market Value Share and BPS Analysis by End Use, 2025 and 2035
  • Figure 61: Eastern Europe Market Y-o-Y Growth Comparison by End Use, 2025-2035
  • Figure 62: Eastern Europe Market Attractiveness Analysis by End Use
  • Figure 63: East Asia Market Value Share and BPS Analysis by Country, 2025 and 2035
  • Figure 64: East Asia Market Value Share and BPS Analysis by Material, 2025 and 2035
  • Figure 65: East Asia Market Y-o-Y Growth Comparison by Material, 2025-2035
  • Figure 66: East Asia Market Attractiveness Analysis by Material
  • Figure 67: East Asia Market Value Share and BPS Analysis by Carrying Capacity, 2025 and 2035
  • Figure 68: East Asia Market Y-o-Y Growth Comparison by Carrying Capacity, 2025-2035
  • Figure 69: East Asia Market Attractiveness Analysis by Carrying Capacity
  • Figure 70: East Asia Market Value Share and BPS Analysis by End Use, 2025 and 2035
  • Figure 71: East Asia Market Y-o-Y Growth Comparison by End Use, 2025-2035
  • Figure 72: East Asia Market Attractiveness Analysis by End Use
  • Figure 73: South Asia & Pacific Market Value Share and BPS Analysis by Country, 2025 and 2035
  • Figure 74: South Asia & Pacific Market Value Share and BPS Analysis by Material, 2025 and 2035
  • Figure 75: South Asia & Pacific Market Y-o-Y Growth Comparison by Material, 2025-2035
  • Figure 76: South Asia & Pacific Market Attractiveness Analysis by Material
  • Figure 77: South Asia & Pacific Market Value Share and BPS Analysis by Carrying Capacity, 2025 and 2035
  • Figure 78: South Asia & Pacific Market Y-o-Y Growth Comparison by Carrying Capacity, 2025-2035
  • Figure 79: South Asia & Pacific Market Attractiveness Analysis by Carrying Capacity
  • Figure 80: South Asia & Pacific Market Value Share and BPS Analysis by End Use, 2025 and 2035
  • Figure 81: South Asia & Pacific Market Y-o-Y Growth Comparison by End Use, 2025-2035
  • Figure 82: South Asia & Pacific Market Attractiveness Analysis by End Use
  • Figure 83: Middle East and Africa Market Value Share and BPS Analysis by Country, 2025 and 2035
  • Figure 84: Middle East and Africa Market Value Share and BPS Analysis by Material, 2025 and 2035
  • Figure 85: Middle East and Africa Market Y-o-Y Growth Comparison by Material, 2025-2035
  • Figure 86: Middle East and Africa Market Attractiveness Analysis by Material
  • Figure 87: Middle East and Africa Market Value Share and BPS Analysis by Carrying Capacity, 2025 and 2035
  • Figure 88: Middle East and Africa Market Y-o-Y Growth Comparison by Carrying Capacity, 2025-2035
  • Figure 89: Middle East and Africa Market Attractiveness Analysis by Carrying Capacity
  • Figure 90: Middle East and Africa Market Value Share and BPS Analysis by End Use, 2025 and 2035
  • Figure 91: Middle East and Africa Market Y-o-Y Growth Comparison by End Use, 2025-2035
  • Figure 92: Middle East and Africa Market Attractiveness Analysis by End Use
  • Figure 93: Global Market - Tier Structure Analysis
  • Figure 94: Global Market - Company Share Analysis

Frequently Asked Questions

What is the expected CAGR of the global cup holder market from 2025 to 2035?

The cup holder market is projected to grow at a CAGR of 5.2% between 2025 and 2035.

Which material segment holds the largest market share in the cup holder market?

Paper-based cup holders lead the market with a 48% share in 2025.

What are the primary applications driving demand for cup holders?

Demand is mainly driven by the food service sector, including quick-service restaurants, hotels, cafes, and institutional users.

Which regions are key markets for cup holders?

North America, especially the United States, and the European Union are among the largest markets, with steady growth in Asia-Pacific and other regions.

Who are the leading companies in the cup holder market?

Key players include MULTIPAP, Huhtamaki Oyj, Georgia-Pacific Consumer Products LP, WestRock Company, and Sabert Corporation.

Explore Similar Insights

Future Market Insights

Cup Holder Market