Laminating Machines Market Snapshot (2022 to 2032)

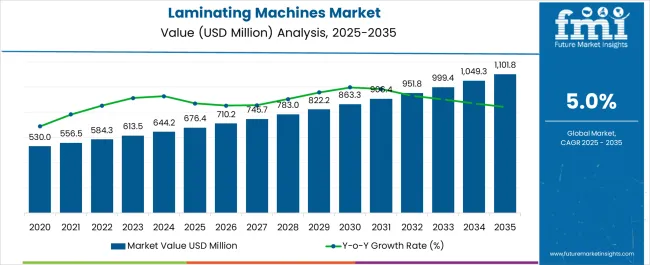
[240 Pages Report] According to Future Market Insights research, during the projected period, the global laminating machines market is set to enjoy a valuation of US$ 584.3 Million in 2022, and further expand at a CAGR of 5.0% to reach US$ 955.9 Million by the year 2032.

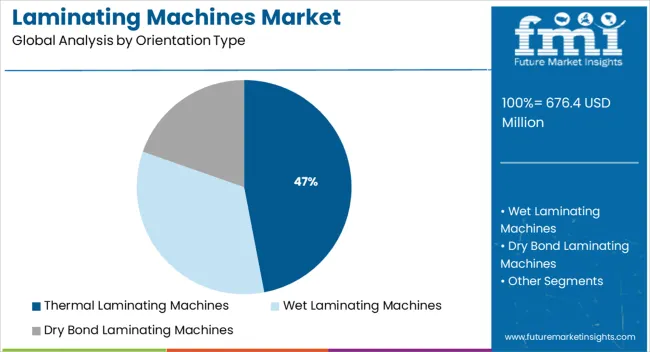
Based on the orientation, the wet laminating machines segment is projected to remain on the top. The reason behind the same is user friendly and cost-efficiency of the machine. The wet laminating machines are estimated to create an incremental opportunity of US$ 234.9 Million from 2022 to 2032.

Attribute Details
Market Size 2022 US$ 584.3 Million
Market Size 2032 US$ 955.9 Million
Value CAGR (2022 to 2032) 5.0%
Collective Value Share: Top 3 Countries (2022E) 35-40%

According to the FMI analysis, the laminating machines market revenue totaled US$ 560.2 Million in 2021. With the propelling demand from the end-use industries, the global laminating machines market is projected to reach US$ 955.9 Million by 2032, accelerating at a CAGR of 5.0% during the forecast period.

The laminating machines market is estimated to experience a growth outlook during the forecast period. A new forecast by FMI anticipates that the laminating machine sales will increase from 2022 to 2032 and are projected to create an absolute incremental growth opportunity of US$ 395.7 Million.

Don't pay for what you don't need

Customize your report by selecting specific countries or regions and save 30%!

Historic Market Outlook for Laminating Machines

The global laminating machines market witnessed a CAGR of 3.7% during the historic period with a market value of US$ 560.2 Million in 2021 from US$ 451.5 Million in 2015.

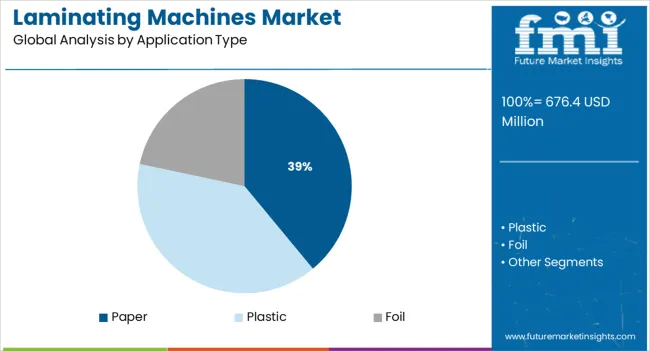
Laminating machines are used to produce a final flexible packaging with enhanced strength, durability, appearance, etc. Lamination helps in increasing the shelf life of the product by keeping them preserved from the external environment. Manufacturers are focusing on environment-friendly laminating machines. Paper is being used more as a base of the application segment in the laminating machines market. Thus, laminating machines are easy-to-use equipment that provides high-quality lamination to protect the products.

Laminating Machines Market

How Innovations and Advancements from the Manufacturers are Enhancing the Sales of the Laminating Machines?

The recent trend of automation in the packaging industry has brought innovations and advancements. The rising need for laminating machines in the various end-use industries attracted new players. Manufacturers are focusing on bringing changes and innovations to gain competitive advancement. New products are being launched with enhanced capabilities. Machines with improved machine accuracy and capabilities are being introduced to the market. Manufacturers are implementing automation techniques to reduce labour costs and increase productivity. Thus, various advancements and innovations brought by manufacturers are enhancing the demand for laminating machines.

Ismail Sutaria
Ismail Sutaria

Principal Consultant

Talk to Analyst

Find your sweet spots for generating winning opportunities in this market.

How the Demand for the Laminating Machines is Being Boosted by the Growing Food & Beverages Industry?

The laminating machines are used for the packaging of the items such as ready-to-eat meals, processed foods, and packed food. In the food industry, laminated flexible packaging is applied to both cooked and non-cooked foods. Laminating machines help in preventing food and beverages from being contaminated. The efficient lamination by the machines provides extended shelf life to the food products. One of the reasons for the growth of laminating machines is the fast worldwide growth of food outlets and the shift of consumers to higher-quality packaged foods as they have become more conscious of a healthy lifestyle. Thus, the growing food & beverages industry is boosting the laminating machines market.

Category-wise Insights

Why the Wet Laminating Machines Segment is projected to Experience Escalated Demand from the Laminating Machines Market?

Based on the orientation, the wet laminating machines segment holds the largest share of the global laminating machines market. The targeted segment is projected to hold around 43.6% of the market share in 2022. Wet laminating machines are the most preferred laminating machines among the end users as they provide effortless lamination. The wet laminating machines provide high production with low investment. In addition, the operating cost of the wet laminating machines is also low. It is generally used to produce a paper-foil laminate that is extensively used in flexible packaging. Thus, due to added advantages, as compared to other-oriented segments of laminating machines, the demand for wet laminating machines is very high and is projected to grow at a rate of 6.5% CAGR over the forecast period.

Which is the Leading End-Use Industry Segment in the Laminating Machines Market?

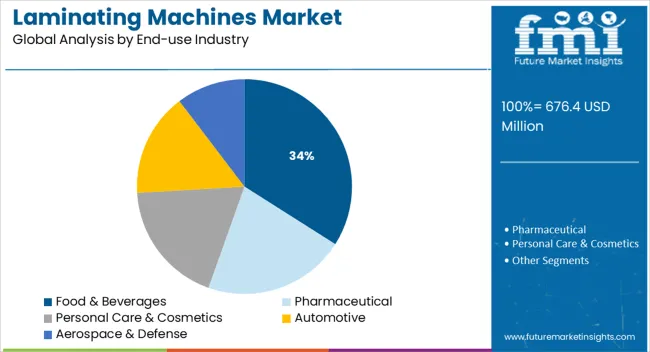
Food and beverages are the topmost end-use industry segment in the market for laminating machines. The food and beverages segment is estimated to have a market share of ~36% in laminating machines market for the year 2022. Laminating machines are used in the food & beverages industry to prevent the impact of the external environment, which helps in increasing the shelf life of the products. In addition, with the rising consumption of easy-to-use and carry packaged food & beverage products, the demand for laminating machines has increased. Thus, due to various benefits, laminating machines as an end-use industry are expected to provide an incremental opportunity of around US$ 164.7 Million in the forecasted period.

The above image represents the basis point (BPS) analysis for the orientation and end-use industry segment for the laminating machines market. The wet laminating machines segment under orientation is estimated to gain around 630 BPS whereas the dry bond laminating machines segment is estimated to lose around 530 BPS during the forecast period. Based on the end-use industry, the food & beverages segment is projected to gain around 200 BPS during the decade.
Get the data you need at a Fraction of the cost

Personalize your report by choosing insights you need
and save 40%!

Country-wise insights

Why is the USA Expected to be the Market Leader in the Laminating Machines Market?

Food & beverages are the top end-use industry of the laminating machines market. Packed and processed foods require efficient sealing for preservation. Laminating machines provide the best-automated laminating packaging solution in the food & beverages industry. According to the USA DEPARTMENT OF AGRICULTURE, the significant demand for processed food items in the USA is shown by the export value of the country's processed food products in 2021, which was US$ 34.24 Billion.

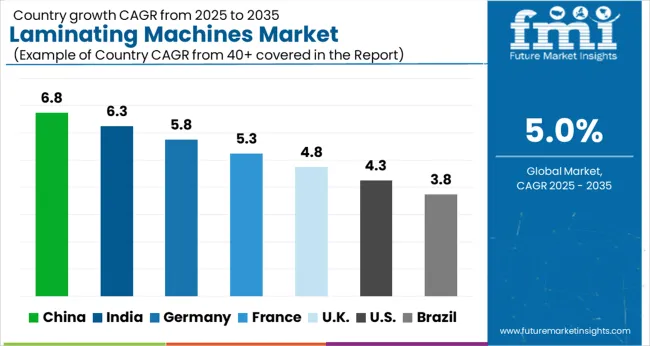
Thus, as per FMI analysis, the USA rising demand for food products is expected to drive the demand for laminating machines and is expected to grow the market at the rate of 4.5% CAGR in the forecast period.

Why is India Considered the Most Attractive Market for the Laminating Machines?

FMI analysis states that the Indian laminating machines market is estimated to grow at the rate of 6.0% CAGR from 2022 to 2032.

According to the data provided by the Ministry of Heavy Industries, the Indian government had launched six technology innovation platforms for the development of technologies for making Indian manufacturing compatible with the global market. These platforms would help in solving the technological challenges in India. It will help in transforming the manufacturing industries of India. Lamination is one of the growing packaging segments owing to the rising need for safe & secure packaging. Thus, due to such initiatives, industries such as laminating machines are projected to witness decent growth, as it would bring opportunities for the key players to set up their manufacturing plants in India.
Competitive Landscape

The key players operating in the laminating machines market are trying to focus on increasing their sales and revenues by expanding their capacities to cater to the growing demand. The key players are trying to adopt different strategies to expand their resources and are developing new products to meet upcoming customer requirements. Also, the players are upgrading their production facilities to cater to the demand. Some of the recent key developments in the market by the leading players are as follows -

  • In April 2022, Robert Bürkle GmbH increased its international competitiveness by expanding with the Debrecen plant. This expansion would help the company in improving its sustainability ratio and strengthen its market position. The Debrecen plant would be an integral part of the value chain and would play an important role in the success of the company.
  • In August 2021, Comexi Group Industries expanded its presence in Thailand with the trade of high-performance ML1 MC Laminator to Prepack. Prepack is a leading supplier of flexible packaging in the country. The acquisition of the laminator would help Prepack in offering the best printing quality. Comexi Group Industries with this expansion had made a diverse scope in Thailand and would get major supply chain benefits.

Scope of the Report

Attribute Details
Growth Rate CAGR of 5.0% from 2022 to 2032
Base Year for Estimation 2021
Historical Data 2015 to 2021
Forecast Period 2022 to 2032
Quantitative Units Revenue in USD Million, Volume in Units, and CAGR from 2022 to 2032
Report Coverage Revenue Forecast, Volume Forecast, Company Ranking, Competitive Landscape, Growth Factors, Trends, and Pricing Analysis
Segments Covered Orientation, Application, End-use Industry, Region
Regions Covered North America; Latin America; Europe; East Asia; South Asia; Middle East and Africa; Oceania
Key Countries Covered USA, Canada, Mexico, Brazil, Germany, UK, France, Italy, Spain, Russia, China, Japan, India, GCC countries, Australia
Key Companies Profiled D&K Group; KOMFI spol. s r. o.; Black Bros. Co.; Graphco; HMT Manufacturing, Inc.; Comexi Group Industries; Karl Menzel Maschinenfabrik GmbH; Monotech Systems Ltd.; ALEMO; Chongqing Sinstar Packaging Machinery Co., Ltd; L.R. Schmitt Nachfolger Sondermaschinenbaugesellschaft m.b.H.; WORLDLY INDUSTRIAL CO., LTD.; GMP; Robert Bürkle GmbH; VEIT GmbH; SAM Europe Srl; Reliant Machinery; HIP-MITSU srl
Customization & Pricing Available upon Request

Laminating Machines Market by Category

By Orientation, Laminating Machines Market is Segmented as:

  • Wet Laminating Machines
  • Thermal Laminating Machines
  • Dry Bond Laminating Machines

By Application, Laminating Machines Market is Segmented as:

  • Paper
  • Plastic
  • Foil

By End-use Industry, Laminating Machines Market is Segmented as:

  • Food & Beverages
  • Pharmaceutical
  • Personal Care & Cosmetics
  • Automotive
  • Aerospace & Defense

By Region, Global Laminating Machines Market is Segmented as:

  • North America
  • Latin America
  • Europe
  • South Asia
  • East Asia
  • Middle East & Africa
  • Oceania

Frequently Asked Questions

What was the value of the laminating machines market in 2021?

In 2021, the value of the global laminating machines market was US$ 560.2 Million.

At what rate is the global laminating machines market projected to expand during the forecast period?

During the forecast period, the global laminating machines market is projected to expand at a CAGR of 5.0%.

By the end of 2032, what will the value of the global laminating machines market?

The global laminating machines market is anticipated to reach US$ 955.9 Million by the end of 2032.

Which orientation segment is expected to lead the global laminating machines market during the forecast period?

During the forecast period, wet laminating machines is projected to be the fastest-growing orientation segment in the global laminating machines market.

Which are the top key players in the laminating machines market?

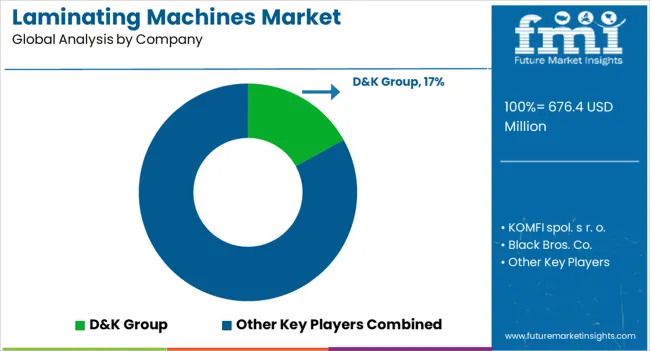
D&K Group, KOMFI spol. s r. o., Black Bros. Co., Graphco and Comexi Group Industries are the top 5 players supplementing the sales of laminating machines.

At what rate is the USA laminating machines market projected to grow?

As per the FMI analysis, the USA laminating machines market is projected to expand at a CAGR of 4.5% from 2022 to 2032.

Table of Content
1. Executive Summary | Laminating Machines Market
    1.1. Global Market Outlook
    1.2. Demand-side Trends
    1.3. Supply-side Trends
    1.4. Technology Roadmap Analysis
    1.5. Analysis and Recommendations
2. Market Overview
    2.1. Market Coverage / Taxonomy
    2.2. Market Definition / Scope / Limitations
3. Market Background
    3.1. Market Dynamics
        3.1.1. Drivers
        3.1.2. Restraints
        3.1.3. Opportunity
        3.1.4. Trends
    3.2. Impact of Covid-19
        3.2.1. Demand in Optimistic Scenario
        3.2.2. Demand in Likely Scenario
        3.2.3. Demand in Conservative Scenario
    3.3. Macro Factors and Forecast Factors
    3.4. Value Chain Analysis
        3.4.1. Profit Margin Analysis
        3.4.2. Raw Material Suppliers
        3.4.3. Manufacturers, Wholesalers, and Distributors
        3.4.4. End Users / Customers
    3.5. Regional Parent Market Outlook
    3.6. Production and Consumption Statistics
    3.7. Global Average Pricing Analysis Benchmark
4. Global Market Analysis 2015 to 2021 and Forecast, 2022 to 2032
    4.1. Historical Market Size Value (US$ Million) & Volume (Units) Analysis, 2015 to 2021
    4.2. Current and Future Market Size Value (US$ Million) & Volume (Units) Projections, 2022 to 2032
        4.2.1. Y-o-Y Growth Trend Analysis
        4.2.2. Absolute $ Opportunity Analysis
5. Global Market Analysis 2015 to 2021 and Forecast 2022 to 2032, By Orientation
    5.1. Introduction / Key Findings
    5.2. Historical Market Size Value (US$ Million) & Volume (Units) Analysis By Orientation, 2015 to 2021
    5.3. Current and Future Market Size Value (US$ Million) & Volume (Units) Analysis and Forecast By Orientation, 2022 to 2032
        5.3.1. Wet Laminating Machines
        5.3.2. Thermal Laminating Machines
        5.3.3. Dry Bond Laminating Machines
    5.4. Y-o-Y Growth Trend Analysis By Orientation, 2015 to 2021
    5.5. Absolute $ Opportunity Analysis By Orientation, 2022 to 2032
6. Global Market Analysis 2015 to 2021 and Forecast 2022 to 2032, By Application
    6.1. Introduction / Key Findings
    6.2. Historical Market Size Value (US$ Million) & Volume (Units) Analysis By Application, 2015 to 2021
    6.3. Current and Future Market Size Value (US$ Million) & Volume (Units) Analysis and Forecast By Application, 2022 to 2032
        6.3.1. Paper
        6.3.2. Plastic
        6.3.3. Foil
    6.4. Y-o-Y Growth Trend Analysis By Application, 2015 to 2021
    6.5. Absolute $ Opportunity Analysis By Application, 2022 to 2032
7. Global Market Analysis 2015 to 2021 and Forecast 2022 to 2032, By End-use Industry
    7.1. Introduction / Key Findings
    7.2. Historical Market Size Value (US$ Million) & Volume (Units) Analysis By End-use Industry, 2015 to 2021
    7.3. Current and Future Market Size Value (US$ Million) & Volume (Units) Analysis and Forecast By End-use Industry, 2022 to 2032
        7.3.1. Food & Beverages
        7.3.2. Pharmaceutical
        7.3.3. Personal Care & Cosmetics
        7.3.4. Automotive
        7.3.5. Aerospace & Defense
    7.4. Y-o-Y Growth Trend Analysis By End-use Industry, 2015 to 2021
    7.5. Absolute $ Opportunity Analysis By End-use Industry, 2022 to 2032
8. Global Market Analysis 2015 to 2021 and Forecast 2022 to 2032, by Region
    8.1. Introduction / Key Findings
    8.2. Historical Market Size Value (US$ Million) & Volume (Units) Analysis By Region, 2015 to 2021
    8.3. Current and Future Market Size Value (US$ Million) & Volume (Units) Analysis and Forecast By Region, 2022 to 2032
        8.3.1. North America
        8.3.2. Latin America
        8.3.3. Europe
        8.3.4. East Asia
        8.3.5. South Asia
        8.3.6. Oceania
        8.3.7. Middle East and Africa (MEA)
    8.4. Market Attractiveness Analysis, by Region
9. North America Market Analysis 2015 to 2021 and Forecast 2022 to 2032, By Country
    9.1. Historical Market Size Value (US$ Million) & Volume (Units) Trend Analysis By Market Taxonomy, 2015 to 2021
    9.2. Market Size Value (US$ Million) & Volume (Units) Forecast By Market Taxonomy, 2022 to 2032
        9.2.1. By Country
            9.2.1.1. United States of America
            9.2.1.2. Canada
        9.2.2. By Orientation
        9.2.3. By Application
        9.2.4. By End-use Industry
    9.3. Market Attractiveness Analysis
        9.3.1. By Country
        9.3.2. By Orientation
        9.3.3. By Application
        9.3.4. By End-use Industry
    9.4. Key Takeaways
10. Latin America Market Analysis 2015 to 2021 and Forecast 2022 to 2032, By Country
    10.1. Historical Market Size Value (US$ Million) & Volume (Units) Trend Analysis By Market Taxonomy, 2015 to 2021
    10.2. Market Size Value (US$ Million) & Volume (Units) Forecast By Market Taxonomy, 2022 to 2032
        10.2.1. By Country
            10.2.1.1. Brazil
            10.2.1.2. Mexico
            10.2.1.3. Argentina
            10.2.1.4. Chile
            10.2.1.5. Peru
            10.2.1.6. Rest of Latin America
        10.2.2. By Orientation
        10.2.3. By Application
        10.2.4. By End-use Industry
    10.3. Market Attractiveness Analysis
        10.3.1. By Country
        10.3.2. By Orientation
        10.3.3. By Application
        10.3.4. By End-use Industry
    10.4. Key Takeaways
11. Europe Market Analysis 2015 to 2021 and Forecast 2022 to 2032, By Country
    11.1. Historical Market Size Value (US$ Million) & Volume (Units) Trend Analysis By Market Taxonomy, 2015 to 2021
    11.2. Market Size Value (US$ Million) & Volume (Units) Forecast By Market Taxonomy, 2022 to 2032
        11.2.1. By Country
            11.2.1.1. Germany
            11.2.1.2. Italy
            11.2.1.3. France
            11.2.1.4. United Kingdom
            11.2.1.5. Spain
            11.2.1.6. BENELUX
            11.2.1.7. Nordic
            11.2.1.8. Russia
            11.2.1.9. Poland
            11.2.1.10. Rest of Europe
        11.2.2. By Orientation
        11.2.3. By Application
        11.2.4. By End-use Industry
    11.3. Market Attractiveness Analysis
        11.3.1. By Country
        11.3.2. By Orientation
        11.3.3. By Application
        11.3.4. By End-use Industry
    11.4. Key Takeaways
12. East Asia Market Analysis 2015 to 2021 and Forecast 2022 to 2032, By Country
    12.1. Historical Market Size Value (US$ Million) & Volume (Units) Trend Analysis By Market Taxonomy, 2015 to 2021
    12.2. Market Size Value (US$ Million) & Volume (Units) Forecast By Market Taxonomy, 2022 to 2032
        12.2.1. By Country
            12.2.1.1. China
            12.2.1.2. Japan
            12.2.1.3. South Korea
        12.2.2. By Orientation
        12.2.3. By Application
        12.2.4. By End-use Industry
    12.3. Market Attractiveness Analysis
        12.3.1. By Country
        12.3.2. By Orientation
        12.3.3. By Application
        12.3.4. By End-use Industry
    12.4. Key Takeaways
13. South Asia Market Analysis 2015 to 2021 and Forecast 2022 to 2032, By Country
    13.1. Historical Market Size Value (US$ Million) & Volume (Units) Trend Analysis By Market Taxonomy, 2015 to 2021
    13.2. Market Size Value (US$ Million) & Volume (Units) Forecast By Market Taxonomy, 2022 to 2032
        13.2.1. By Country
            13.2.1.1. India
            13.2.1.2. Thailand
            13.2.1.3. Malaysia
            13.2.1.4. Indonesia
            13.2.1.5. Rest of South Asia
        13.2.2. By Orientation
        13.2.3. By Application
        13.2.4. By End-use Industry
    13.3. Market Attractiveness Analysis
        13.3.1. By Country
        13.3.2. By Orientation
        13.3.3. By Application
        13.3.4. By End-use Industry
    13.4. Key Takeaways
14. Oceania Market Analysis 2015 to 2021 and Forecast 2022 to 2032, By Country
    14.1. Historical Market Size Value (US$ Million) & Volume (Units) Trend Analysis By Market Taxonomy, 2015 to 2021
    14.2. Market Size Value (US$ Million) & Volume (Units) Forecast By Market Taxonomy, 2022 to 2032
        14.2.1. By Country
            14.2.1.1. Australia
            14.2.1.2. New Zealand
        14.2.2. By Orientation
        14.2.3. By Application
        14.2.4. By End-use Industry
    14.3. Market Attractiveness Analysis
        14.3.1. By Country
        14.3.2. By Orientation
        14.3.3. By Application
        14.3.4. By End-use Industry
    14.4. Key Takeaways
15. Middle East & Africa Market Analysis 2015 to 2021 and Forecast 2022 to 2032, By Country
    15.1. Historical Market Size Value (US$ Million) & Volume (Units) Trend Analysis By Market Taxonomy, 2015 to 2021
    15.2. Market Size Value (US$ Million) & Volume (Units) Forecast By Market Taxonomy, 2022 to 2032
        15.2.1. By Country
            15.2.1.1. GCC Countries
            15.2.1.2. Turkey
            15.2.1.3. Northern Africa
            15.2.1.4. South Africa
            15.2.1.5. Rest of MEA
        15.2.2. By Orientation
        15.2.3. By Application
        15.2.4. By End-use Industry
    15.3. Market Attractiveness Analysis
        15.3.1. By Country
        15.3.2. By Orientation
        15.3.3. By Application
        15.3.4. By End-use Industry
    15.4. Key Takeaways
16. Country-wise Market Analysis
    16.1. United States (USA)
        16.1.1. Market Share Analysis, 2022
        16.1.2. By Orientation
        16.1.3. By Application
        16.1.4. By End-use Industry
    16.2. Canada
        16.2.1. Market Share Analysis, 2022
        16.2.2. By Orientation
        16.2.3. By Application
        16.2.4. By End-use Industry
    16.3. Brazil
        16.3.1. Market Share Analysis, 2022
        16.3.2. By Orientation
        16.3.3. By Application
        16.3.4. By End-use Industry
    16.4. Mexico
        16.4.1. Market Share Analysis, 2022
        16.4.2. By Orientation
        16.4.3. By Application
        16.4.4. By End-use Industry
    16.5. Germany
        16.5.1. Market Share Analysis, 2022
        16.5.2. By Orientation
        16.5.3. By Application
        16.5.4. By End-use Industry
    16.6. Italy
        16.6.1. Market Share Analysis, 2022
        16.6.2. By Orientation
        16.6.3. By Application
        16.6.4. By End-use Industry
    16.7. France
        16.7.1. Market Share Analysis, 2022
        16.7.2. By Orientation
        16.7.3. By Application
        16.7.4. By End-use Industry
    16.8. Spain
        16.8.1. Market Share Analysis, 2022
        16.8.2. By Orientation
        16.8.3. By Application
        16.8.4. By End-use Industry
    16.9. United Kingdom
        16.9.1. Market Share Analysis, 2022
        16.9.2. By Orientation
        16.9.3. By Application
        16.9.4. By End-use Industry
    16.10. Russia
        16.10.1. Market Share Analysis, 2022
        16.10.2. By Orientation
        16.10.3. By Application
        16.10.4. By End-use Industry
    16.11. China
        16.11.1. Market Share Analysis, 2022
        16.11.2. By Orientation
        16.11.3. By Application
        16.11.4. By End-use Industry
    16.12. Japan
        16.12.1. Market Share Analysis, 2022
        16.12.2. By Orientation
        16.12.3. By Application
        16.12.4. By End-use Industry
    16.13. India
        16.13.1. Market Share Analysis, 2022
        16.13.2. By Orientation
        16.13.3. By Application
        16.13.4. By End-use Industry
    16.14. GCC Countries
        16.14.1. Market Share Analysis, 2022
        16.14.2. By Orientation
        16.14.3. By Application
        16.14.4. By End-use Industry
    16.15. Australia
        16.15.1. Market Share Analysis, 2022
        16.15.2. By Orientation
        16.15.3. By Application
        16.15.4. By End-use Industry
17. Market Structure Analysis
    17.1. Competition Dashboard
    17.2. Competition Benchmarking
    17.3. Market Share Analysis of Top Players
        17.3.1. By Region
        17.3.2. By Product Portfolio
18. Competition Analysis
    18.1. Competition Deep Dive
        18.1.1. D&K Group
            18.1.1.1. Overview
            18.1.1.2. Product Portfolio
            18.1.1.3. Profitability by Market Segments (Product/Channel/Region)
            18.1.1.4. Sales Footprint
            18.1.1.5. Strategy Overview
                18.1.1.5.1. Marketing Strategy
                18.1.1.5.2. Product Strategy
                18.1.1.5.3. Channel Strategy
        18.1.2. KOMFI spol. s r. o.
            18.1.2.1. Overview
            18.1.2.2. Product Portfolio
            18.1.2.3. Profitability by Market Segments (Product/Channel/Region)
            18.1.2.4. Sales Footprint
            18.1.2.5. Strategy Overview
                18.1.2.5.1. Marketing Strategy
                18.1.2.5.2. Product Strategy
                18.1.2.5.3. Channel Strategy
        18.1.3. Black Bros. Co.
            18.1.3.1. Overview
            18.1.3.2. Product Portfolio
            18.1.3.3. Profitability by Market Segments (Product/Channel/Region)
            18.1.3.4. Sales Footprint
            18.1.3.5. Strategy Overview
                18.1.3.5.1. Marketing Strategy
                18.1.3.5.2. Product Strategy
                18.1.3.5.3. Channel Strategy
        18.1.4. Graphco
            18.1.4.1. Overview
            18.1.4.2. Product Portfolio
            18.1.4.3. Profitability by Market Segments (Product/Channel/Region)
            18.1.4.4. Sales Footprint
            18.1.4.5. Strategy Overview
                18.1.4.5.1. Marketing Strategy
                18.1.4.5.2. Product Strategy
                18.1.4.5.3. Channel Strategy
        18.1.5. HMT Manufacturing, Inc.
            18.1.5.1. Overview
            18.1.5.2. Product Portfolio
            18.1.5.3. Profitability by Market Segments (Product/Channel/Region)
            18.1.5.4. Sales Footprint
            18.1.5.5. Strategy Overview
                18.1.5.5.1. Marketing Strategy
                18.1.5.5.2. Product Strategy
                18.1.5.5.3. Channel Strategy
        18.1.6. Comexi Group Industries
            18.1.6.1. Overview
            18.1.6.2. Product Portfolio
            18.1.6.3. Profitability by Market Segments (Product/Channel/Region)
            18.1.6.4. Sales Footprint
            18.1.6.5. Strategy Overview
                18.1.6.5.1. Marketing Strategy
                18.1.6.5.2. Product Strategy
                18.1.6.5.3. Channel Strategy
        18.1.7. Karl Menzel Maschinenfabrik GmbH
            18.1.7.1. Overview
            18.1.7.2. Product Portfolio
            18.1.7.3. Profitability by Market Segments (Product/Channel/Region)
            18.1.7.4. Sales Footprint
            18.1.7.5. Strategy Overview
                18.1.7.5.1. Marketing Strategy
                18.1.7.5.2. Product Strategy
                18.1.7.5.3. Channel Strategy
        18.1.8. Monotech Systems Ltd.
            18.1.8.1. Overview
            18.1.8.2. Product Portfolio
            18.1.8.3. Profitability by Market Segments (Product/Channel/Region)
            18.1.8.4. Sales Footprint
            18.1.8.5. Strategy Overview
                18.1.8.5.1. Marketing Strategy
                18.1.8.5.2. Product Strategy
                18.1.8.5.3. Channel Strategy
        18.1.9. ALEMO
            18.1.9.1. Overview
            18.1.9.2. Product Portfolio
            18.1.9.3. Profitability by Market Segments (Product/Channel/Region)
            18.1.9.4. Sales Footprint
            18.1.9.5. Strategy Overview
                18.1.9.5.1. Marketing Strategy
                18.1.9.5.2. Product Strategy
                18.1.9.5.3. Channel Strategy
        18.1.10. Chongqing Sinstar Packaging Machinery Co., Ltd
            18.1.10.1. Overview
            18.1.10.2. Product Portfolio
            18.1.10.3. Profitability by Market Segments (Product/Channel/Region)
            18.1.10.4. Sales Footprint
            18.1.10.5. Strategy Overview
                18.1.10.5.1. Marketing Strategy
                18.1.10.5.2. Product Strategy
                18.1.10.5.3. Channel Strategy
        18.1.11. L.R. Schmitt Nachfolger Sondermaschinenbaugesellschaft m.b.H.
            18.1.11.1. Overview
            18.1.11.2. Product Portfolio
            18.1.11.3. Profitability by Market Segments (Product/Channel/Region)
            18.1.11.4. Sales Footprint
            18.1.11.5. Strategy Overview
                18.1.11.5.1. Marketing Strategy
                18.1.11.5.2. Product Strategy
                18.1.11.5.3. Channel Strategy
        18.1.12. WORLDLY INDUSTRIAL CO., LTD.
            18.1.12.1. Overview
            18.1.12.2. Product Portfolio
            18.1.12.3. Profitability by Market Segments (Product/Channel/Region)
            18.1.12.4. Sales Footprint
            18.1.12.5. Strategy Overview
                18.1.12.5.1. Marketing Strategy
                18.1.12.5.2. Product Strategy
                18.1.12.5.3. Channel Strategy
        18.1.13. GMP
            18.1.13.1. Overview
            18.1.13.2. Product Portfolio
            18.1.13.3. Profitability by Market Segments (Product/Channel/Region)
            18.1.13.4. Sales Footprint
            18.1.13.5. Strategy Overview
                18.1.13.5.1. Marketing Strategy
                18.1.13.5.2. Product Strategy
                18.1.13.5.3. Channel Strategy
        18.1.14. Robert Bürkle GmbH
            18.1.14.1. Overview
            18.1.14.2. Product Portfolio
            18.1.14.3. Profitability by Market Segments (Product/Channel/Region)
            18.1.14.4. Sales Footprint
            18.1.14.5. Strategy Overview
                18.1.14.5.1. Marketing Strategy
                18.1.14.5.2. Product Strategy
                18.1.14.5.3. Channel Strategy
        18.1.15. VEIT GmbH
            18.1.15.1. Overview
            18.1.15.2. Product Portfolio
            18.1.15.3. Profitability by Market Segments (Product/Channel/Region)
            18.1.15.4. Sales Footprint
            18.1.15.5. Strategy Overview
                18.1.15.5.1. Marketing Strategy
                18.1.15.5.2. Product Strategy
                18.1.15.5.3. Channel Strategy
        18.1.16. SAM Europe Srl
            18.1.16.1. Overview
            18.1.16.2. Product Portfolio
            18.1.16.3. Profitability by Market Segments (Product/Channel/Region)
            18.1.16.4. Sales Footprint
            18.1.16.5. Strategy Overview
                18.1.16.5.1. Marketing Strategy
                18.1.16.5.2. Product Strategy
                18.1.16.5.3. Channel Strategy
        18.1.17. Reliant Machinery
            18.1.17.1. Overview
            18.1.17.2. Product Portfolio
            18.1.17.3. Profitability by Market Segments (Product/Channel/Region)
            18.1.17.4. Sales Footprint
            18.1.17.5. Strategy Overview
                18.1.17.5.1. Marketing Strategy
                18.1.17.5.2. Product Strategy
                18.1.17.5.3. Channel Strategy
        18.1.18. HIP-MITSU srl
            18.1.18.1. Overview
            18.1.18.2. Product Portfolio
            18.1.18.3. Profitability by Market Segments (Product/Channel/Region)
            18.1.18.4. Sales Footprint
            18.1.18.5. Strategy Overview
                18.1.18.5.1. Marketing Strategy
                18.1.18.5.2. Product Strategy
                18.1.18.5.3. Channel Strategy
19. Assumptions and Acronyms Used
20. Research Methodology
Recommendations

Packaging

Soft Touch Lamination Film Market

June 2024

REP-GB-9310

324 pages

Packaging

Packaging Laminate Market

March 2024

REP-GB-12540

500 pages

Packaging

Packaging Machinery Market

October 2023

REP-GB-15187

348 pages

Explore Packaging Insights

View Reports
Future Market Insights

Laminating Machines Market

Schedule a Call