

- Market Size (2026)
- USD 17.6 Bn
- Forecast (2036)
- USD 25.3 Bn
- CAGR (2026 to 2036)
- 3.7%
Cutting Fluid Market Size, Market Forecast and Outlook By FMI
Summary of the Cutting Fluid Market
- Demand and Growth Drivers
- Expansion of precision machining in automotive, aerospace, and electronics manufacturing is supporting sustained demand for high-performance cutting fluids that improve tool life and surface finish quality.
- Sustainability mandates and worker safety regulations are accelerating the shift toward bio-based and low-toxicity cutting fluid formulations across developed manufacturing economies.
- Growth in CNC machining adoption across Asia Pacific is creating incremental volume demand for synthetic and semi-synthetic fluid products that meet tighter machining tolerances.
- Product and Segment View
- Emulsions (soluble oil) are projected to hold 41.0% of the product type segment in 2026, supported by their cost-effectiveness and balanced performance across cooling, lubrication, and corrosion protection.
- Synthetic-based fluids account for 52.0% of the source segment, reflecting growing preference for longer fluid life and reduced bacterial contamination in closed-loop machining systems.
- Grinding applications represent 47.0% of the application segment, driven by the need for consistent surface finish quality and thermal management in precision component manufacturing.
- Geography and Competitive Outlook
- The USA leads growth at 3.9% CAGR, supported by advanced manufacturing infrastructure, automotive production recovery, and adoption of sustainable machining practices.
- South Korea at 3.8% reflects demand from electronics and semiconductor fabrication, where cutting fluid precision is a production quality requirement.
- Companies that combine formulation expertise with regulatory compliance capabilities and large-scale manufacturing customer access are positioned to capture share in both developed and emerging markets.
- Analyst Opinion
- 'The cutting fluid market is transitioning from commodity chemical supply toward performance-engineered fluid systems. Formulation complexity is increasing as manufacturers require fluids that balance cooling efficiency, tool life extension, and environmental compliance. Companies that invest in bio-based formulation development while maintaining cost competitiveness across emulsion, synthetic, and neat oil categories are expected to strengthen their position over the forecast period.'
- Demand growth reflects the convergence of manufacturing precision requirements and sustainability mandates in metalworking operations.
- Bio-based cutting fluids are gaining procurement preference in EU and North American markets where environmental regulations influence industrial chemical selection.
- The aftermarket fluid management segment presents margin opportunities through fluid recycling, monitoring, and life-extension services.
Key Takeaways, Market Size, and Forecast
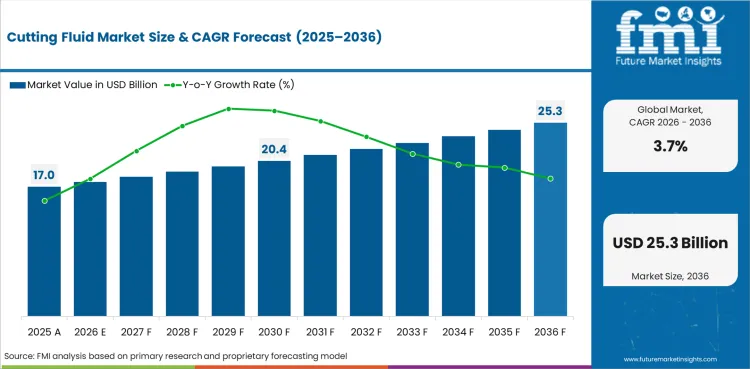
- The cutting fluid market was valued at USD 17.0 billion in 2025 and is expected to reach USD 17.6 billion by the end of 2026.
- The market is projected to grow at a CAGR of 3.7% from 2026 to 2036, reaching USD 25.3 billion by 2036.
- The market was valued at USD 16.98 billion in 2025.
- By 2036, the market is expected to reach approximately USD 25.32 billion.
- From 2026 to 2036, the market is projected to expand at a CAGR of 3.7%.
- The market is expected to create an incremental opportunity of USD 7.71 billion between 2026 and 2036.
- In 2026, emulsions (soluble oil) are expected to account for 41.0% of the product type segment, driven by demand from precision machining and metalworking operations requiring balanced cooling and lubrication.
- The USA (3.9%) and South Korea (3.8%) are among the fastest-growing markets globally.
Cutting Fluid Market Definition
The cutting fluid market includes industrial fluids used in metal cutting, grinding, milling, turning, and drilling operations to provide cooling, lubrication, chip removal, and corrosion protection. Products span emulsions (soluble oils), synthetic fluids, semi-synthetic fluids, and neat oils formulated from mineral, bio-based, and synthetic feedstocks.
Cutting Fluid Market Inclusions
Market scope covers all commercially traded cutting fluids segmented by product type (emulsions, synthetic fluids, neat oils), source (synthetic-based, bio-based), end use (metalworking industry, automotive industry, general manufacturing, oil and gas, others), and application (grinding, milling, turning, drilling, others). Revenue coverage spans 2026 to 2036.
Cutting Fluid Market Exclusions
The scope does not include metalworking fluids used exclusively for corrosion protection without machining application, general-purpose industrial lubricants, or metal cleaning solvents.
Cutting Fluid Market Research Methodology
- Primary Research: FMI analysts conducted interviews with cutting fluid manufacturers, metalworking facility procurement managers, and industrial chemical distributors across key manufacturing economies.
- Desk Research: Desk research combined data from manufacturing output statistics, industrial chemical trade databases, and environmental regulation filings on metalworking fluid standards.
- Market Sizing and Forecasting: Market sizing used a bottom-up approach aggregating demand across product type, application, and end-use industry, with regional manufacturing output adjustments.
- Data Validation: Data validation included quarterly cross-checks against industrial chemical production data, manufacturer revenue disclosures, and trade flow databases.
Why is the Cutting Fluid Market Growing?
- Expansion of precision machining in automotive and aerospace manufacturing requires fluids that deliver tighter tolerances, longer tool life, and improved surface finish consistency.
- Environmental regulations on metalworking fluid disposal and worker exposure limits are driving reformulation toward synthetic and bio-based products with lower toxicity profiles.
The cutting fluid market is expanding in line with global manufacturing output growth and the increasing complexity of machining operations. Automotive production recovery, aerospace component demand, and electronics miniaturization are requiring cutting fluids that perform under tighter tolerances and higher spindle speeds. Emulsions continue to dominate product demand due to their balanced cooling and lubrication properties, but synthetic and semi-synthetic alternatives are gaining share in precision applications where fluid life, bacterial resistance, and environmental compliance are procurement priorities.
Sustainability pressures are reshaping product mix across developed manufacturing economies. EU REACH regulations and US OSHA worker exposure standards are creating compliance requirements that favor low-toxicity, recyclable, and bio-based fluid formulations. Manufacturers in Germany, the UK, and the USA are increasingly specifying cutting fluids based on environmental and health criteria alongside machining performance. This regulatory environment is creating differentiation opportunities for fluid producers that can demonstrate both performance and compliance.
In Asia Pacific, growth is shaped by industrialization pace and CNC machining adoption. China, Japan, South Korea, and India represent the largest volume markets, with demand expanding as manufacturing moves toward higher-precision operations. The region's price sensitivity creates competitive dynamics that favor established global producers with local manufacturing presence, while also supporting domestic fluid producers that compete on cost in commodity segments.
Market Segmentation Analysis
- Emulsions (soluble oil) hold the leading position in the product type segment at 41.0%, reflecting their versatile performance across cooling, lubrication, and chip evacuation in general machining.
- Metalworking industry accounts for 44.0% of the end-use segment, representing the core demand base for cutting fluid consumption across global manufacturing operations.
- Grinding applications represent 47.0% of the application segment, driven by thermal management and surface finish requirements in precision component production.
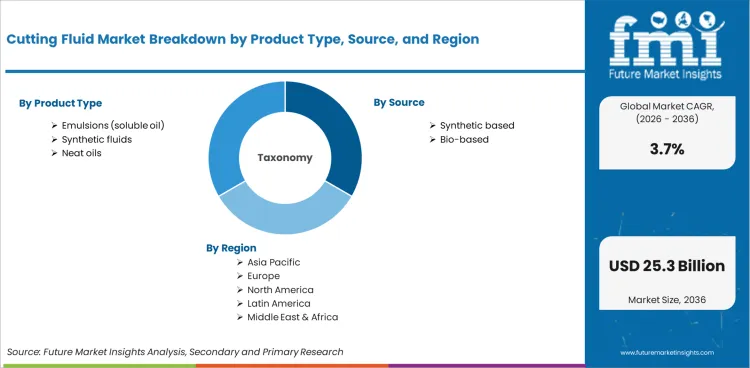
The cutting fluid market is segmented by product type, source, end use, and application. Product types include water-based cutting fluids (emulsions, synthetic fluids) and neat oils (mineral oils, fatty oils, composed oils, extreme pressure oils). Sources span synthetic-based and bio-based. End-use industries include metalworking, automotive, oil and gas, general manufacturing, and others. Applications cover grinding, milling, turning, drilling, and others.
Insights into the Emulsions (Soluble Oil) Product Segment
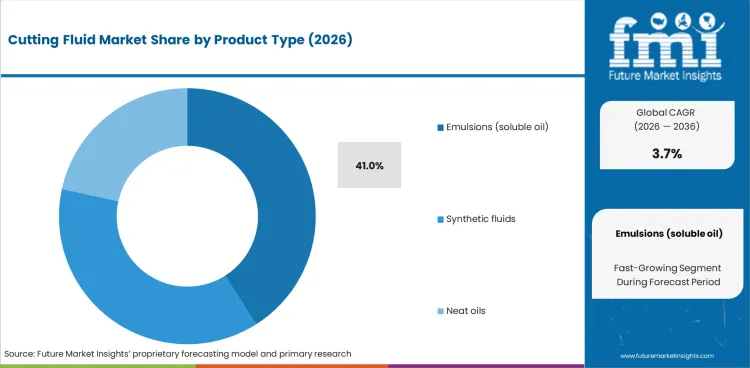
In 2026, emulsions are expected to hold 41.0% of the product type segment. Soluble oils remain the most widely used cutting fluid category due to their cost-effective formulation, broad machining compatibility, and balanced performance across cooling, lubrication, and corrosion protection. General metalworking and automotive component manufacturing represent the primary demand base.
Formulation advances are improving emulsion stability and bacterial resistance, extending fluid life and reducing maintenance costs in large-scale machining operations. Manufacturers are developing micro-emulsion variants that offer improved surface finish quality while maintaining cost competitiveness against synthetic alternatives.
Insights into the Grinding Application Segment
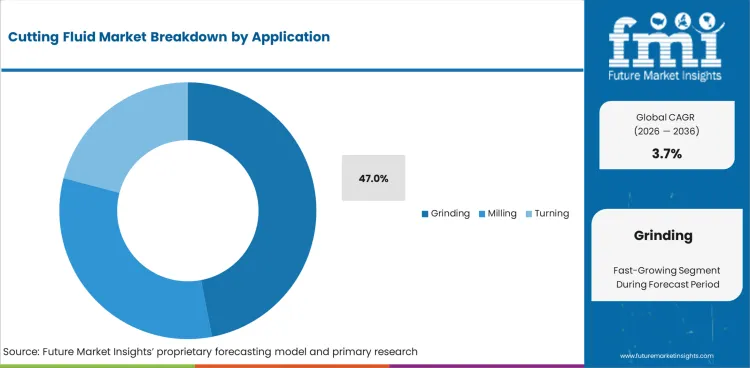
Grinding applications are projected to represent 47.0% of application demand in 2026. Precision grinding operations require cutting fluids that manage heat generation, maintain dimensional accuracy, and deliver consistent surface finish quality. These performance requirements favor synthetic and semi-synthetic formulations with superior thermal stability.
The automotive and aerospace sectors are the primary drivers of grinding fluid demand, with engine components, turbine parts, and bearing surfaces requiring fluid systems that support tight tolerance manufacturing.
Cutting Fluid Market Drivers, Restraints, and Opportunities
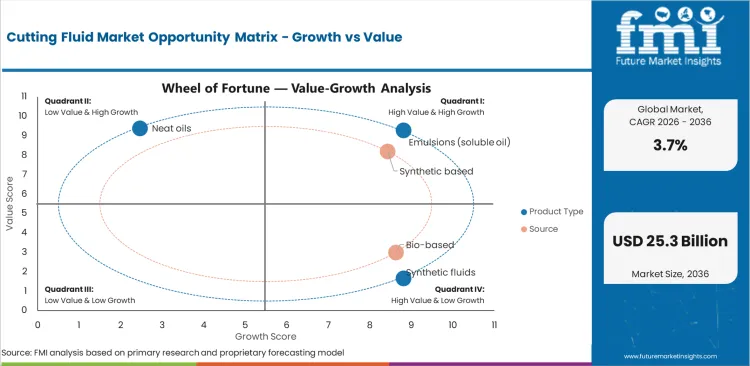
- Precision machining expansion in automotive and aerospace manufacturing is sustaining demand for high-performance cutting fluid formulations that extend tool life and improve surface quality.
- Raw material price volatility and environmental disposal regulations increase operational costs for fluid users, particularly in regions with strict waste management requirements.
- Bio-based cutting fluid development is creating differentiation opportunities for producers that can meet both performance and sustainability procurement criteria.
The cutting fluid market is shaped by manufacturing output trends, machining precision requirements, environmental regulations, and raw material cost dynamics. While demand continues to expand with global manufacturing activity, competitive dynamics are shifting toward performance-engineered, sustainable formulations.
Precision Machining Demand Expansion
Demand is shaped by the growing complexity of metal cutting operations in automotive, aerospace, and electronics manufacturing. Tighter tolerances, higher spindle speeds, and advanced materials such as titanium alloys and composites require cutting fluids with superior cooling and lubrication performance.
Environmental and Safety Regulations
Adoption of sustainable formulations is increasing due to regulatory pressure on fluid disposal, worker exposure limits, and environmental impact reporting. EU REACH compliance and US OSHA standards are creating procurement criteria that favor low-toxicity, bio-based, and recyclable fluid systems.
Raw Material Cost Volatility
Growth faces margin pressure from fluctuating petroleum and bio-feedstock prices that affect formulation costs. Producers with diversified sourcing strategies and backward-integrated supply chains are better positioned to absorb price volatility and maintain competitive pricing.
Fluid Management and Recycling Services
Adoption is increasing due to demand for fluid lifecycle management services that extend fluid life, reduce disposal costs, and improve machining consistency. Monitoring, filtration, and recycling solutions represent margin expansion opportunities for fluid producers.
Analysis of Cutting Fluid Market By Key Countries
.webp "Top Country Growth Comparison Cutting Fluid Market Cagr (2026 2036)")
| Country | CAGR |
|---|---|
| USA | 3.9% |
| South Korea | 3.8% |
| European Union | 3.7% |
| UK | 3.5% |
| Japan | 3.4% |
Source: FMI analysis based on primary research and proprietary forecasting model
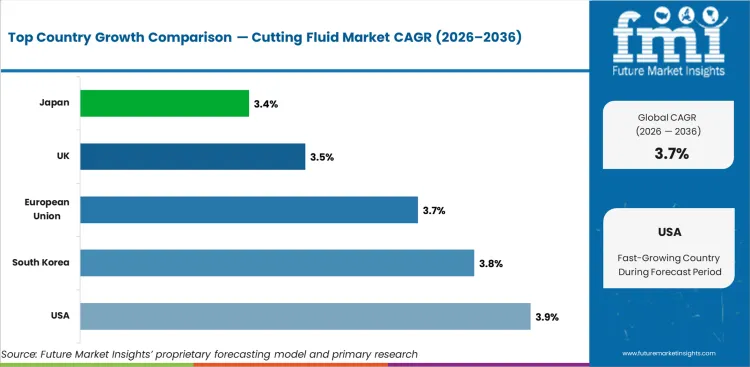
- The USA leads growth at 3.9% CAGR, supported by advanced manufacturing infrastructure and increasing adoption of sustainable machining practices.
- South Korea at 3.8% reflects demand from semiconductor and electronics fabrication requiring precision fluid systems.
- The European Union (3.7%) and the UK (3.5%) show stable demand shaped by environmental regulations and automotive manufacturing requirements.
- Japan at 3.4% reflects a mature but innovation-oriented market focused on high-precision machining fluid development.
The global cutting fluid market is projected to grow at 3.7% CAGR from 2026 to 2036. Regional growth reflects manufacturing output, machining precision requirements, and regulatory conditions influencing product selection.
Demand Outlook for Cutting Fluid Market in the USA
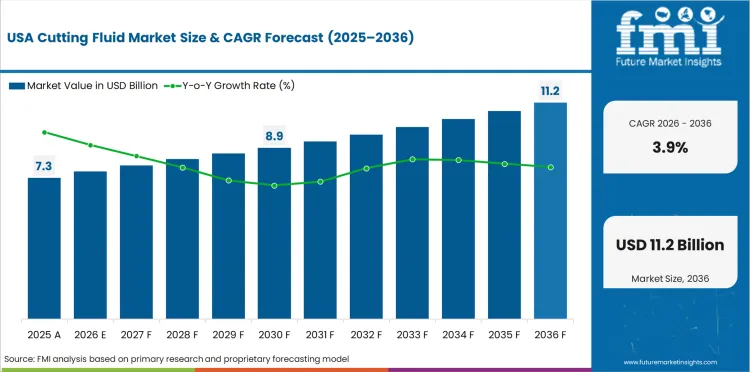
The USA is projected to grow at 3.9% CAGR through 2036. Advanced manufacturing infrastructure, automotive production, and aerospace component demand sustain cutting fluid consumption. Sustainability mandates are accelerating adoption of bio-based and low-toxicity formulations.
- Automotive and aerospace manufacturing sustain core demand for high-performance cutting fluids.
- OSHA worker safety standards influence procurement criteria toward low-toxicity formulations.
- Fluid management services are gaining traction as manufacturers seek to reduce waste and extend fluid life.
Future Outlook for Cutting Fluid Market in South Korea
South Korea is projected to grow at 3.8% CAGR through 2036. Semiconductor fabrication, electronics manufacturing, and precision engineering operations require cutting fluids with tight performance specifications and contamination control.
- Semiconductor and electronics fabrication drives demand for ultra-clean synthetic fluid systems.
- Precision engineering in automotive components requires consistent cooling and lubrication performance.
- Government investment in advanced manufacturing supports fluid technology adoption.
Opportunity Analysis of Cutting Fluid Market in the European Union
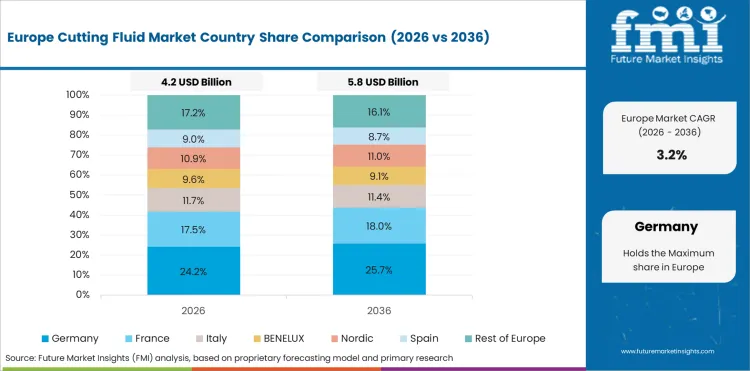
The European Union is projected to grow at 3.7% CAGR through 2036. EU REACH regulations and environmental sustainability targets are shaping product demand toward bio-based and recyclable cutting fluid formulations across the manufacturing base.
- REACH compliance requirements favor bio-based and low-toxicity fluid formulations.
- Automotive sector electrification is shifting machining requirements toward lightweight material processing.
- Germany and France lead fluid innovation with advanced formulation technology infrastructure.
In-depth Analysis of Cutting Fluid Market in the UK
The UK is projected to grow at 3.5% CAGR through 2036. Aerospace manufacturing, particularly for engine components and precision parts, sustains demand for high-performance cutting fluids. Environmental regulations support sustainable fluid adoption.
- Aerospace component manufacturing drives demand for precision grinding and milling fluids.
- Environmental waste management regulations influence fluid disposal and recycling practices.
- Fluid life extension and monitoring technologies are gaining procurement interest.
Sales Analysis of Cutting Fluid Market in Japan
Japan is projected to grow at 3.4% CAGR through 2036. The country's precision manufacturing heritage and advanced machine tool industry support demand for premium cutting fluid formulations with tight performance specifications.
- Precision machine tool industry sustains demand for high-specification cutting fluids.
- Automotive and electronics manufacturing maintain core fluid consumption volumes.
- Fluid formulation innovation focuses on extending tool life and reducing environmental impact.
Competitive Landscape and Strategic Positioning
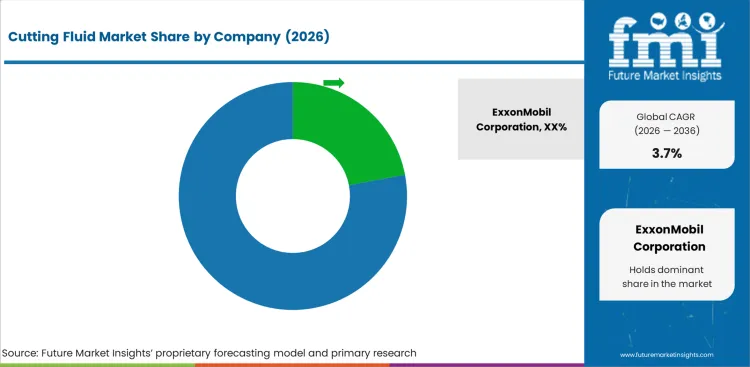
- ExxonMobil Corporation holds the leading market position at 22.0%, supported by its broad industrial lubricant and metalworking fluid portfolio and global distribution infrastructure.
- FUCHS Group, BP (Castrol), and TotalEnergies maintain strong positions through formulation expertise and established relationships with automotive and industrial manufacturing customers.
- Regional and specialty producers compete through bio-based formulations and fluid management service offerings in niche applications.
ExxonMobil Corporation maintains market leadership through its Mobil Industrial range, which spans emulsions, synthetic fluids, and neat oils for metalworking applications. The company's global manufacturing and distribution infrastructure provides procurement access across automotive, aerospace, and general manufacturing end-use industries.
FUCHS Group competes through deep formulation expertise and a product portfolio tailored to precision machining requirements. The company's focus on specialty and high-performance fluids supports its positioning in premium segments across Europe and Asia Pacific.
BP (Castrol) leverages its industrial lubricant brand recognition and manufacturing customer relationships to maintain cutting fluid market share across general manufacturing and automotive applications. TotalEnergies offers a broad fluid range with growing emphasis on sustainable formulations.
Quaker Houghton holds a differentiated position through its combined fluid supply and fluid management service model, offering monitoring, recycling, and lifecycle optimization alongside product sales.
Key Companies in the Cutting Fluid Market
Key global companies leading the cutting fluid market include:
- ExxonMobil Corporation (USA), FUCHS Group (Germany), and BP plc/Castrol (UK) maintain leadership through global distribution infrastructure, broad product portfolios, and established manufacturing customer relationships.
- TotalEnergies SE (France) and Quaker Houghton (USA) hold strong positions through formulation innovation and fluid management service models that extend customer relationships beyond product supply.
- Blaser Swisslube (Switzerland), Houghton International (USA), and Master Fluid Solutions (USA) compete as specialty producers focused on high-performance and bio-based fluid segments.
Competitive Benchmarking: Cutting Fluid Market
| Company | Product Range Breadth | Formulation Technology | Manufacturing Customer Access | Geographic Footprint |
|---|---|---|---|---|
| ExxonMobil Corporation | High | Strong | Strong | Global |
| FUCHS Group | High | Strong | Strong | Europe, Asia, Global |
| BP plc (Castrol) | High | Strong | Strong | Global |
| TotalEnergies SE | High | Medium | Strong | Global |
| Quaker Houghton | Medium | Strong | Strong | North America, Europe |
| Blaser Swisslube | Medium | High | Moderate | Europe |
| Houghton International | Medium | Strong | Moderate | North America, Europe |
| Master Fluid Solutions | Medium | Strong | Moderate | North America |
| Yushiro Chemical | Medium | High | Moderate | Asia |
| Idemitsu Kosan | Medium | Medium | Moderate | Asia |
Source: Future Market Insights competitive analysis, 2026.
Key Developments in Cutting Fluid Market
- In 2025, FUCHS Group launched a bio-based cutting fluid range designed for CNC machining applications in the European automotive sector, targeting EU environmental compliance requirements.
- In 2025, Quaker Houghton expanded its fluid management service platform to include real-time fluid monitoring and automated recycling for large-scale metalworking operations in North America.
Key Players in the Cutting Fluid Market
Major Global Players
- ExxonMobil Corporation
- FUCHS Group
- BP plc (Castrol Limited)
- TotalEnergies SE
- Quaker Houghton
Emerging Players/Startups
- Blaser Swisslube
- Houghton International
- Master Fluid Solutions
- Yushiro Chemical Industry
- Idemitsu Kosan
- Rhenus Lub
Report Scope and Coverage
| Parameter | Details |
|---|---|
| Quantitative Units | USD 17.61 billion to USD 25.32 billion, at a CAGR of 3.7% |
| Market Definition | The cutting fluid market includes industrial fluids used in metal cutting, grinding, milling, turning, and drilling operations to provide cooling, lubrication, chip removal, and corrosion protection across manufacturing industries. |
| Regions Covered | North America, Latin America, Europe, East Asia, South Asia and Pacific, Middle East and Africa |
| Countries Covered | USA, UK, Germany, France, Japan, South Korea, China, India, 30 plus countries |
| Key Companies Profiled | ExxonMobil Corporation, FUCHS Group, BP plc (Castrol Limited), TotalEnergies SE, Quaker Houghton, Blaser Swisslube, Houghton International, Master Fluid Solutions, Yushiro Chemical Industry, Idemitsu Kosan, Rhenus Lub |
| Forecast Period | 2026 to 2036 |
| Approach | Hybrid bottom-up and top-down methodology starting with verified manufacturing output and industrial chemical trade data, projecting demand across product types, applications, and regional manufacturing segments. |
Segmentation
Cutting Fluid Market Market Segmented by Product Type:
- Emulsions (soluble oil)
- Synthetic fluids
- Neat oils
Cutting Fluid Market Market Segmented by Source:
- Synthetic based
- Bio-based
Cutting Fluid Market Market Segmented by End-Use:
- Metal working industry
- Automotive industry
- General manufacturing industry
Cutting Fluid Market Market Segmented by Application:
- Grinding
- Milling
- Turning
Cutting Fluid Market Market by Region:
- North America
- USA
- Canada
- Mexico
- Latin America
- Brazil
- Chile
- Rest of Latin America
- Western Europe
- Germany
- UK
- Italy
- Spain
- France
- Nordic
- BENELUX
- Rest of Western Europe
- Eastern Europe
- Russia
- Poland
- Hungary
- Balkan & Baltic
- Rest of Eastern Europe
- East Asia
- China
- Japan
- South Korea
- South Asia and Pacific
- India
- ASEAN
- Australia & New Zealand
- Rest of South Asia and Pacific
- Middle East & Africa
- Kingdom of Saudi Arabia
- Other GCC Countries
- Turkiye
- South Africa
- Other African Union
- Rest of Middle East & Africa
Research Sources and Bibliography
- 1. USA Occupational Safety and Health Administration. (2024). OSHA Metalworking Fluid Standards: Worker Exposure Limits. OSHA.
- 2. European Chemicals Agency. (2025). REACH Regulation: Industrial Chemical Registration and Compliance. ECHA.
- 3. International Organization for Standardization. (2024). ISO 6743: Metalworking Fluid Classification Standards. ISO.
- 4. World Bank. (2025). Global Manufacturing Output Index: Regional Production Trends. World Bank.
- 5. Japan Machine Tool Builders Association. (2025). JMTBA Annual Report: Machine Tool Production and Fluid Consumption. JMTBA.
This bibliography is provided for reader reference. The full Future Market Insights report contains the complete reference list with publication dates, URLs, and supporting data for all cited works.
This Report Answers
- Estimating the market size and revenue projections from 2026 to 2036.
- Segmentation by product type, source, end use, and application.
- Regional and country-level demand analysis across more than 30 markets.
- Assessment of regulatory impact on fluid formulation and disposal practices.
- Competitive landscape and strategic positioning of leading and emerging players.
- Analysis of bio-based and sustainable fluid adoption trends.
- Identification of investment opportunities across product categories and geographic markets.
- Delivery of data in PDF and Excel formats.
Frequently Asked Questions
What is the global market demand for Cutting Fluid in 2026?
In 2026, the global cutting fluid market is expected to be worth USD 17.61 billion.
How big will the Cutting Fluid Market be in 2036?
By 2036, the cutting fluid market is expected to be worth USD 25.32 billion.
How much is demand for Cutting Fluid expected to grow between 2026 and 2036?
Between 2026 and 2036, demand for cutting fluid is expected to grow at a CAGR of 3.7%.
Which product type segment is expected to lead in 2026?
Emulsions (soluble oil) are expected to account for 41.0% of the product type segment in 2026, reflecting their balanced cooling and lubrication performance across general machining and metalworking applications.
What is causing demand to rise in the USA?
The USA is projected to grow at 3.9% CAGR through 2036, supported by advanced manufacturing infrastructure, automotive production recovery, and increasing adoption of sustainable machining practices.
What is causing demand to rise in South Korea?
South Korea is projected to grow at 3.8% CAGR through 2036, driven by semiconductor fabrication, electronics manufacturing, and precision engineering operations requiring high-specification fluid systems.
What does this report mean by cutting fluid market definition?
The cutting fluid market includes industrial fluids used in metal cutting, grinding, milling, turning, and drilling operations to provide cooling, lubrication, chip removal, and corrosion protection across manufacturing industries.
How does FMI make the Cutting Fluid forecast and check it?
Forecasting models use a hybrid bottom-up and top-down approach, starting with verified manufacturing output data and checking against industrial chemical production statistics and trade databases.
Preview the report firsthand - request a free sample
Get SampleGet the brochure for pricing and purchase details.
Get PDFTable of Content
- Executive Summary
- Global Market Outlook
- Demand-side Trends
- Supply-side Trends
- Technology Roadmap Analysis
- Analysis and Recommendations
- Market Overview
- Market Coverage / Taxonomy
- Market Definition / Scope / Limitations
- Research Methodology
- Chapter Orientation
- Analytical Lens and Working Hypotheses
- Market Structure, Signals, and Trend Drivers
- Benchmarking and Cross-market Comparability
- Market Sizing, Forecasting, and Opportunity Mapping
- Research Design and Evidence Framework
- Desk Research Programme (Secondary Evidence)
- Company Annual and Sustainability Reports
- Peer-reviewed Journals and Academic Literature
- Corporate Websites, Product Literature, and Technical Notes
- Earnings Decks and Investor Briefings
- Statutory Filings and Regulatory Disclosures
- Technical White Papers and Standards Notes
- Trade Journals, Industry Magazines, and Analyst Briefs
- Conference Proceedings, Webinars, and Seminar Materials
- Government Statistics Portals and Public Data Releases
- Press Releases and Reputable Media Coverage
- Specialist Newsletters and Curated Briefings
- Sector Databases and Reference Repositories
- FMI Internal Proprietary Databases and Historical Market Datasets
- Subscription Datasets and Paid Sources
- Social Channels, Communities, and Digital Listening Inputs
- Additional Desk Sources
- Expert Input and Fieldwork (Primary Evidence)
- Primary Modes
- Qualitative Interviews and Expert Elicitation
- Quantitative Surveys and Structured Data Capture
- Blended Approach
- Why Primary Evidence is Used
- Field Techniques
- Interviews
- Surveys
- Focus Groups
- Observational and In-context Research
- Social and Community Interactions
- Stakeholder Universe Engaged
- C-suite Leaders
- Board Members
- Presidents and Vice Presidents
- R&D and Innovation Heads
- Technical Specialists
- Domain Subject-matter Experts
- Scientists
- Physicians and Other Healthcare Professionals
- Governance, Ethics, and Data Stewardship
- Research Ethics
- Data Integrity and Handling
- Primary Modes
- Tooling, Models, and Reference Databases
- Desk Research Programme (Secondary Evidence)
- Data Engineering and Model Build
- Data Acquisition and Ingestion
- Cleaning, Normalisation, and Verification
- Synthesis, Triangulation, and Analysis
- Quality Assurance and Audit Trail
- Market Background
- Market Dynamics
- Drivers
- Restraints
- Opportunity
- Trends
- Scenario Forecast
- Demand in Optimistic Scenario
- Demand in Likely Scenario
- Demand in Conservative Scenario
- Opportunity Map Analysis
- Product Life Cycle Analysis
- Supply Chain Analysis
- Investment Feasibility Matrix
- Value Chain Analysis
- PESTLE and Porter’s Analysis
- Regulatory Landscape
- Regional Parent Market Outlook
- Production and Consumption Statistics
- Import and Export Statistics
- Market Dynamics
- Global Market Analysis 2021 to 2025 and Forecast, 2026 to 2036
- Historical Market Size Value (USD Million) Analysis, 2021 to 2025
- Current and Future Market Size Value (USD Million) Projections, 2026 to 2036
- Y-o-Y Growth Trend Analysis
- Absolute $ Opportunity Analysis
- Global Market Pricing Analysis 2021 to 2025 and Forecast 2026 to 2036
- Global Market Analysis 2021 to 2025 and Forecast 2026 to 2036, By Product Type
- Introduction / Key Findings
- Historical Market Size Value (USD Million) Analysis By Product Type , 2021 to 2025
- Current and Future Market Size Value (USD Million) Analysis and Forecast By Product Type , 2026 to 2036
- Emulsions (soluble oil)
- Synthetic fluids
- Neat oils
- Emulsions (soluble oil)
- Y-o-Y Growth Trend Analysis By Product Type , 2021 to 2025
- Absolute $ Opportunity Analysis By Product Type , 2026 to 2036
- Global Market Analysis 2021 to 2025 and Forecast 2026 to 2036, By Source
- Introduction / Key Findings
- Historical Market Size Value (USD Million) Analysis By Source, 2021 to 2025
- Current and Future Market Size Value (USD Million) Analysis and Forecast By Source, 2026 to 2036
- Synthetic based
- Bio-based
- Synthetic based
- Y-o-Y Growth Trend Analysis By Source, 2021 to 2025
- Absolute $ Opportunity Analysis By Source, 2026 to 2036
- Global Market Analysis 2021 to 2025 and Forecast 2026 to 2036, By End-Use
- Introduction / Key Findings
- Historical Market Size Value (USD Million) Analysis By End-Use, 2021 to 2025
- Current and Future Market Size Value (USD Million) Analysis and Forecast By End-Use, 2026 to 2036
- Metal working industry
- Automotive industry
- General manufacturing industry
- Metal working industry
- Y-o-Y Growth Trend Analysis By End-Use, 2021 to 2025
- Absolute $ Opportunity Analysis By End-Use, 2026 to 2036
- Global Market Analysis 2021 to 2025 and Forecast 2026 to 2036, By Application
- Introduction / Key Findings
- Historical Market Size Value (USD Million) Analysis By Application, 2021 to 2025
- Current and Future Market Size Value (USD Million) Analysis and Forecast By Application, 2026 to 2036
- Grinding
- Milling
- Turning
- Grinding
- Y-o-Y Growth Trend Analysis By Application, 2021 to 2025
- Absolute $ Opportunity Analysis By Application, 2026 to 2036
- Global Market Analysis 2021 to 2025 and Forecast 2026 to 2036, By Region
- Introduction
- Historical Market Size Value (USD Million) Analysis By Region, 2021 to 2025
- Current Market Size Value (USD Million) Analysis and Forecast By Region, 2026 to 2036
- North America
- Latin America
- Western Europe
- Eastern Europe
- East Asia
- South Asia and Pacific
- Middle East & Africa
- Market Attractiveness Analysis By Region
- North America Market Analysis 2021 to 2025 and Forecast 2026 to 2036, By Country
- Historical Market Size Value (USD Million) Trend Analysis By Market Taxonomy, 2021 to 2025
- Market Size Value (USD Million) Forecast By Market Taxonomy, 2026 to 2036
- By Country
- USA
- Canada
- Mexico
- By Product Type
- By Source
- By End-Use
- By Application
- By Country
- Market Attractiveness Analysis
- By Country
- By Product Type
- By Source
- By End-Use
- By Application
- Key Takeaways
- Latin America Market Analysis 2021 to 2025 and Forecast 2026 to 2036, By Country
- Historical Market Size Value (USD Million) Trend Analysis By Market Taxonomy, 2021 to 2025
- Market Size Value (USD Million) Forecast By Market Taxonomy, 2026 to 2036
- By Country
- Brazil
- Chile
- Rest of Latin America
- By Product Type
- By Source
- By End-Use
- By Application
- By Country
- Market Attractiveness Analysis
- By Country
- By Product Type
- By Source
- By End-Use
- By Application
- Key Takeaways
- Western Europe Market Analysis 2021 to 2025 and Forecast 2026 to 2036, By Country
- Historical Market Size Value (USD Million) Trend Analysis By Market Taxonomy, 2021 to 2025
- Market Size Value (USD Million) Forecast By Market Taxonomy, 2026 to 2036
- By Country
- Germany
- UK
- Italy
- Spain
- France
- Nordic
- BENELUX
- Rest of Western Europe
- By Product Type
- By Source
- By End-Use
- By Application
- By Country
- Market Attractiveness Analysis
- By Country
- By Product Type
- By Source
- By End-Use
- By Application
- Key Takeaways
- Eastern Europe Market Analysis 2021 to 2025 and Forecast 2026 to 2036, By Country
- Historical Market Size Value (USD Million) Trend Analysis By Market Taxonomy, 2021 to 2025
- Market Size Value (USD Million) Forecast By Market Taxonomy, 2026 to 2036
- By Country
- Russia
- Poland
- Hungary
- Balkan & Baltic
- Rest of Eastern Europe
- By Product Type
- By Source
- By End-Use
- By Application
- By Country
- Market Attractiveness Analysis
- By Country
- By Product Type
- By Source
- By End-Use
- By Application
- Key Takeaways
- East Asia Market Analysis 2021 to 2025 and Forecast 2026 to 2036, By Country
- Historical Market Size Value (USD Million) Trend Analysis By Market Taxonomy, 2021 to 2025
- Market Size Value (USD Million) Forecast By Market Taxonomy, 2026 to 2036
- By Country
- China
- Japan
- South Korea
- By Product Type
- By Source
- By End-Use
- By Application
- By Country
- Market Attractiveness Analysis
- By Country
- By Product Type
- By Source
- By End-Use
- By Application
- Key Takeaways
- South Asia and Pacific Market Analysis 2021 to 2025 and Forecast 2026 to 2036, By Country
- Historical Market Size Value (USD Million) Trend Analysis By Market Taxonomy, 2021 to 2025
- Market Size Value (USD Million) Forecast By Market Taxonomy, 2026 to 2036
- By Country
- India
- ASEAN
- Australia & New Zealand
- Rest of South Asia and Pacific
- By Product Type
- By Source
- By End-Use
- By Application
- By Country
- Market Attractiveness Analysis
- By Country
- By Product Type
- By Source
- By End-Use
- By Application
- Key Takeaways
- Middle East & Africa Market Analysis 2021 to 2025 and Forecast 2026 to 2036, By Country
- Historical Market Size Value (USD Million) Trend Analysis By Market Taxonomy, 2021 to 2025
- Market Size Value (USD Million) Forecast By Market Taxonomy, 2026 to 2036
- By Country
- Kingdom of Saudi Arabia
- Other GCC Countries
- Turkiye
- South Africa
- Other African Union
- Rest of Middle East & Africa
- By Product Type
- By Source
- By End-Use
- By Application
- By Country
- Market Attractiveness Analysis
- By Country
- By Product Type
- By Source
- By End-Use
- By Application
- Key Takeaways
- Key Countries Market Analysis
- USA
- Pricing Analysis
- Market Share Analysis, 2025
- By Product Type
- By Source
- By End-Use
- By Application
- Canada
- Pricing Analysis
- Market Share Analysis, 2025
- By Product Type
- By Source
- By End-Use
- By Application
- Mexico
- Pricing Analysis
- Market Share Analysis, 2025
- By Product Type
- By Source
- By End-Use
- By Application
- Brazil
- Pricing Analysis
- Market Share Analysis, 2025
- By Product Type
- By Source
- By End-Use
- By Application
- Chile
- Pricing Analysis
- Market Share Analysis, 2025
- By Product Type
- By Source
- By End-Use
- By Application
- Germany
- Pricing Analysis
- Market Share Analysis, 2025
- By Product Type
- By Source
- By End-Use
- By Application
- UK
- Pricing Analysis
- Market Share Analysis, 2025
- By Product Type
- By Source
- By End-Use
- By Application
- Italy
- Pricing Analysis
- Market Share Analysis, 2025
- By Product Type
- By Source
- By End-Use
- By Application
- Spain
- Pricing Analysis
- Market Share Analysis, 2025
- By Product Type
- By Source
- By End-Use
- By Application
- France
- Pricing Analysis
- Market Share Analysis, 2025
- By Product Type
- By Source
- By End-Use
- By Application
- India
- Pricing Analysis
- Market Share Analysis, 2025
- By Product Type
- By Source
- By End-Use
- By Application
- ASEAN
- Pricing Analysis
- Market Share Analysis, 2025
- By Product Type
- By Source
- By End-Use
- By Application
- Australia & New Zealand
- Pricing Analysis
- Market Share Analysis, 2025
- By Product Type
- By Source
- By End-Use
- By Application
- China
- Pricing Analysis
- Market Share Analysis, 2025
- By Product Type
- By Source
- By End-Use
- By Application
- Japan
- Pricing Analysis
- Market Share Analysis, 2025
- By Product Type
- By Source
- By End-Use
- By Application
- South Korea
- Pricing Analysis
- Market Share Analysis, 2025
- By Product Type
- By Source
- By End-Use
- By Application
- Russia
- Pricing Analysis
- Market Share Analysis, 2025
- By Product Type
- By Source
- By End-Use
- By Application
- Poland
- Pricing Analysis
- Market Share Analysis, 2025
- By Product Type
- By Source
- By End-Use
- By Application
- Hungary
- Pricing Analysis
- Market Share Analysis, 2025
- By Product Type
- By Source
- By End-Use
- By Application
- Kingdom of Saudi Arabia
- Pricing Analysis
- Market Share Analysis, 2025
- By Product Type
- By Source
- By End-Use
- By Application
- Turkiye
- Pricing Analysis
- Market Share Analysis, 2025
- By Product Type
- By Source
- By End-Use
- By Application
- South Africa
- Pricing Analysis
- Market Share Analysis, 2025
- By Product Type
- By Source
- By End-Use
- By Application
- USA
- Market Structure Analysis
- Competition Dashboard
- Competition Benchmarking
- Market Share Analysis of Top Players
- By Regional
- By Product Type
- By Source
- By End-Use
- By Application
- Competition Analysis
- Competition Deep Dive
- ExxonMobil Corporation
- Overview
- Product Portfolio
- Profitability by Market Segments (Product/Age /Sales Channel/Region)
- Sales Footprint
- Strategy Overview
- Marketing Strategy
- Product Strategy
- Channel Strategy
- FUCHS Group
- BP plc (Castrol Limited)
- TotalEnergies SE
- Other Companies & Regional Players
- Quaker Houghton
- ExxonMobil Corporation
- Competition Deep Dive
- Assumptions & Acronyms Used


