- Global Locations -
Headquarters
Future Market Insights, Inc.
Christiana Corporate, 200 Continental Drive, Suite 401, Newark, Delaware - 19713, United States
T: +1-845-579-5705
Americas
Future Market Insights, Inc.
616 Corporate Way, Suite 2-9018,
Valley Cottage, NY 10989,
United States
T: +1-347-918-3531
MEA
Future Market Insights

1602-6 Jumeirah Bay X2 Tower, Plot No: JLT-PH2-X2A,

Jumeirah Lakes Towers, Dubai,

United Arab Emirates

Europe
Future Market Insights
3rd Floor, 207 Regent Street,
London W1B 3HH
United Kingdom
T: + 44 (0) 20 8123 9659
D: +44 (0) 20 3287 4268
Asia Pacific
Future Market Insights Global & Consulting Pvt. Ltd.
Office No. 401-A, 4th Floor,
VANTAGE 9, S.No. 36/1/1,
Baner, Pune 411045 India

Fluid Couplings Market

Market Survey on Fluid Couplings Market Covering Sales Outlook, Up-to-date Key Trends, Production and Consumption Statistics, Market Size and Forecast Including New and Replacement Sales, Import and Export Analysis, Installed Base Analysis, Trade Scenario Analysis, Company Share and Pricing Analysis

An In-depth Market Insights of Fluid Couplings Market including Constant Fill Fluid Couplings, Variable Fill Fluid Couplings, Slip Fluid Couplings, and Scoop Control Fluid Couplings Covering 30+ Countries like United States, United Kingdom, Germany, France, Norway, Sweden, Saudi Arabia, United Arab Emirates, Japan, Korea, Australia, New Zealand, and Others

Request Sample

Fluid Couplings Market Outlook (2023 to 2033)

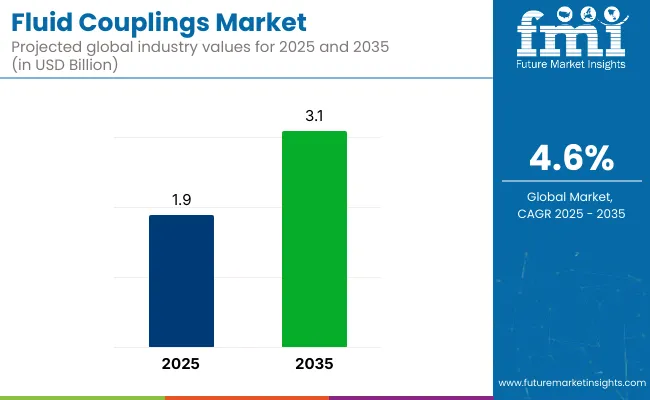
The global fluid couplings market size is forecast to expand from US$ 1.8 billion in 2023 to US$ 2.8 billion by 2033. Over the forecast period from 2023 to 2033, global fluid coupling sales are anticipated to surge at 4.6% CAGR.

In 2022, the worldwide fluid couplings industry totaled a valuation of about US$ 1.7 billion. Between 2023 and 2033, it is predicted to generate an absolute $ opportunity of US$ 1.0 billion.

The future of the target market looks bright with global sales of fluid couplings set to thrive at a steady CAGR. Sales are expected to remain high for constant fill fluid couplings due to their widening usage across diverse sectors.

As per Future Market Insights (FMI), the constant fill fluid couplings segment is anticipated to thrive at a CAGR of around 4.2% CAGR through 2033. To meet this demand and improve revenues, key companies are focusing on strengthening their portfolio of constant fill fluid couplings.

Key Market Shaping Factors:

  • Burgeoning demand for fluid couplings across sectors such as oil & gas, construction, mining, automotive, and others is driving the market forward
  • Growing usage of mixers, centrifuges, reciprocating pumps, mills, and other equipment in various sectors is likely to bolster fluid coupling sales
  • Usage of fluid couplings in semi-automatic or fully automatic transmission systems in the automotive sector will likely boost the market
  • Increasing on-shore and off-shore oil & gas explorations activities across the globe is anticipated to boost the fluid couplings industry
  • Growing demand for smaller-capacity fluid couplings is an emerging trend boosting the target market
  • Improvements in coupling technology is projected to further boost growth in the global fluid couplings industry through 2033

The hydrodynamic devices used to transmit rotating mechanical power are called hydraulic couplings or fluid couplings. These couplings use transmission fluid to transfer rotational power from one shaft to another.

Fluid couplings have widespread application in industrial and marine machine drives, where variable speed orientation and controlled start-up without shock loading of the power transmission equipment are essential.

Growing usage of fluid couplings in marine propulsion systems, automotive transmission systems, and in industries for smooth power transmission is expected to drive the target market.

Fluid couplings are preferred by consumers in belt conveyors, ball mills, slurry pumps, extruders, centrifuges, boiler feed pumps, dryers, reciprocating pumps, diesel locomotives, etc. Rising usage of these equipment in several sectors will create a high demand for fluid coupling.

Fluid couplings facilitate smooth power transmission even in extreme conditions, reduce vibration & noise, and provide overload protection.

Few of the key benefits offered by fluid couplings in various kinds of power transmission that are making them popular and widening their application area include:

  • Start-up control
  • Almost frictionless clutch
  • Smooth acceleration
  • Energy saving
  • Overload safety
  • Speed control
  • Others

Fluid couplings are used in various industrial applications involving rotational power, especially in machine drives. They find applications in sectors such as mining, textile, oil & gas, and other material handling industries.

Robust expansion of mining sector will play a key role in boosting the fluid couplings industry. This is due to increasing adoption of equipment such as conveyors and crushers that use fluid couplings.

The exponential rise in the number of power plants due to escalating energy demand is expected to create a high demand for fluid couplings during the assessment period.

Attributes Key Insights

Estimated Global Fluid Couplings Market Value (2023)

US$ 1.8 billion

Projected Market Size (2033)

US$ 2.8 billion

Value-based CAGR (2023 to 2033)

4.6%

United States Market CAGR (2023 to 2033)

4.6%

Don't pay for what you don't need

Customize your report by selecting specific countries or regions and save 30%!

2018 to 2022 Global Fluid Couplings Sales Outlook Compared to Demand Forecast from 2023 to 2033

According to Future Market Insights’ (FMI) latest analysis, global sales of fluid guns grew at around 5.5% CAGR historically from 2018 to 2022. Total market value reached about US$ 1.7 billion at the end of 2022.

Looking forward, the global fluid couplings industry is expected to progress at a CAGR of 4.6% through 2033. It is set to generate an absolute $ opportunity of US$ 1.0 billion during the projection period.

Growing usage of fluid couplings across sectors such as oil & gas, power generation, chemical, etc. is providing impetus for market expansion.

Fluid couplings are used as alternatives to a mechanical clutch to provide variable speed & avoid shock loading. They play a critical role in equipment such as mixers, belt conveyors, compressors, process pumps, cranes, centrifuges, agitators, crushers, etc. High adoption of these equipment will therefore bolster fluid coupling sales during the assessment period.

Fluid couplings, for instance, are used in conveyor belts to gently accelerate belt drives. They provide load sharing upon start-up, dampen torsional vibrations, and limit torque, thereby increasing a conveyor system’s productivity & longevity.

Rapid expansion of power generation sector is expected to uplift demand for fluid couplings during the assessment period.

Advancements in fluid couplings coupled with integration of novel technologies such as sensors are creating new prospects for the market. Leading companies are using sensors in fluid couplings to quickly and effectively detect abnormalities.

Comparative View of Adjacent Markets

Hydraulic Intensifiers Market:

Attributes Hydraulic Intensifiers Market

CAGR (2023 to 2033)

3.3%

Market Value (2023)

US$ 43 billion

Growth Factor

Increasing usage of hydraulic intensifiers in various sectors including construction, manufacturing, and automotive is driving growth in the target market.

Key Trend

Rising demand for fuel-efficient vehicles and shift towards renewable energy sources are expected to boost hydraulic intensifier sales through 2033.

Industrial Coupling Market:

Attributes Industrial Coupling Market

CAGR (2023 to 2033)

11.0%

Market Value (2023)

US$ 0.268 billion

Growth Factor

Robust growth of automotive, mining, aerospace, and chemical sectors is expected to boost the industrial coupling market.

Key Trend

New product breakthroughs & innovations is likely to open new growth prospects for the industrial coupling industry through 2033.

Nikhil Kaitwade
Nikhil Kaitwade
Principal Consultant
LinkedIn
Talk to Analyst

Find your sweet spots for generating winning opportunities in this market.

Country-wise Insights

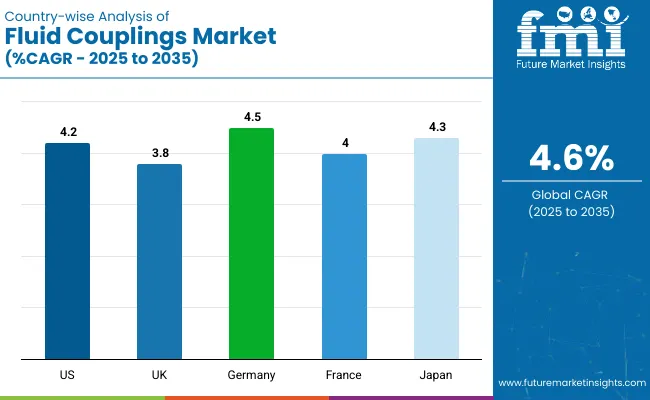
Countries Projected CAGR (2023 to 2033)

United States

4.6%

United Kingdom

4.3%

China

4.5%

Japan

4.5%

South Korea

4.2%

Countries Market Value (2033)

United States

~US$ 0.513 billion

United Kingdom

~US$ 0.104 billion

China

~US$ 0.606 billion

Japan

~US$ 0.508 billion

South Korea

~US$ 0.145 billion

Countries Historical CAGR (2018 to 2022)

United States

5.4%

United Kingdom

5.3%

China

5.4%

Japan

5.3%

South Korea

4.6%

What is the Demand Outlook for the United States Fluid Couplings Market?

Flourishing Power Generation Sector Propelling Fluid Coupling Demand in the United States

According to Future Market Insights’ (FMI) latest report, the United States fluid coupling market expanded at a CAGR of 5.4% during the historical period. Looking forward, fluid coupling demand in the United States is set to rise at 4.6% CAGR.

By the end of 2033, the United States fluid couplings industry is projected to cross a valuation of US$ 0.513 billion. Hence, it will remain one of the key markets for fluid coupling manufacturers.

Rising applications of fluid coupling across the thriving power generation and oil & gas sectors is a key factor expected to drive the United States market forward.

There has been a dramatic rise in the number of power plants across the United States during the last few years. This is due to growing energy demand from industrial, commercial, and residential sectors.

As per the U.S. Energy Information Administration (EIA), there are around 11,925 utility-scale electric power plants in the United States in 2021. This rising number of power plants is playing a crucial role in fostering development of the fluid coupling industry.

Fluid couplings are being widely used in power plants because there is no mechanical connection between the input and output shaft which reduces chances of wear and tear. These coupling also provide smooth and controlled acceleration as well as effective damping due to load variations or shock.

Heavy presence of leading fluid coupling manufacturers is another key factor improving the United States fluid coupling market share in the global market.

What is Fueling Sales of Fluid Couplings in China?

Rising Mining Activities and Growth in Chemical Sector Fueling Fluid Coupling Sales in China

China is anticipated to remain the most lucrative market for fuel couplings during the assessment period. This is due to rapid growth of end-use sectors such as chemical, mining, automotive, etc.

As per Future Market Insights (FMI), China fluid couplings market is projected to thrive at 4.5% CAGR over the forecast period in comparison to 5.4% CAGR during the historical period. By 2033, total market value in China is likely to reach US$ 0.606 billion.

China is home to one of the leading mining sectors in the world. The country has over 1500 major mining operations. Further, China’s mining sector produces around US$ 400 billion/year as per Canada.ca.

Increasing mining activities in China is expected to fuel fluid coupling sales during the assessment period. This is attributable to rising usage of conveyors, mills, misers, pumps, and other equipment that use fluid couplings.

Favorable government support and availability of a variety of fluid couplings with cost-effective features will further boost the target market in China.

Category-wise Insights

Top Segment (Type) Historical CAGR (2018 to 2022)

Constant Fill Fluid Couplings

5.3%

Top Segment (Type) Projected CAGR (2023 to 2033)

Constant Fill Fluid Couplings

4.2%

Top Segment (End Use) Historical CAGR (2018 to 2022)

Oil & Gas

5.4%

Top Segment (End Use) Projected CAGR (2023 to 2033)

Oil & Gas

4.4%

Which is the Highly Sought-after Fluid Coupling Type in the Market?

Constant Fill Fluid Couplings to Remain the Highly Sought-after Type Through 2033

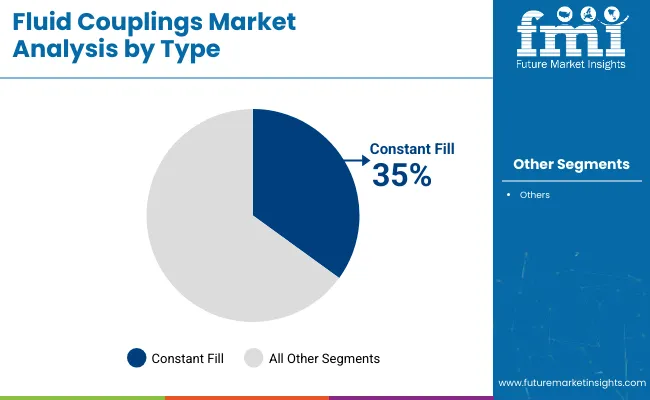
Based on type, the global fluid couplings industry is segmented into constant fill fluid couplings, variable fill fluid couplings, slip fluid couplings, and scoop control fluid couplings. Among these, demand is predicted to remain high for constant fill fluid couplings.

As per Future Market Insights (FMI), the constant fill fluid couplings segment is projected to expand at 4.2% CAGR during the assessment period in comparison to 5.3% CAGR registered from 2018 to 2022.

Constant fill fluid couplings are being widely used across various sectors. They are self-contained, surface-cooled units mostly used to limit start-up torque, torsional vibration, and maximum torque. In this coupling type, oil filling is fixed.

Usage of constant fill fluid couplings offers various benefits ranging from very gradual start-ups, limited energy consumption, and reduction of current absorption. They also protect both machine and motor from vibrations, overloads, and blockages.

Rising usage of constant fill fluid couplings in industrial equipment and other applications will boost growth of the target market during the assessment period.

Which End-use Sector Will Likely Create Lucrative Growth Prospects for the Target Market?

Oil & Gas Sector to Create Ample Growth Opportunities for the Target Market

Based on end use, the target market is categorized into oil & gas, chemical, metals & mining, power plants, and others. Fluid couplings are being widely in these sectors which in turn is boosting the overall market.

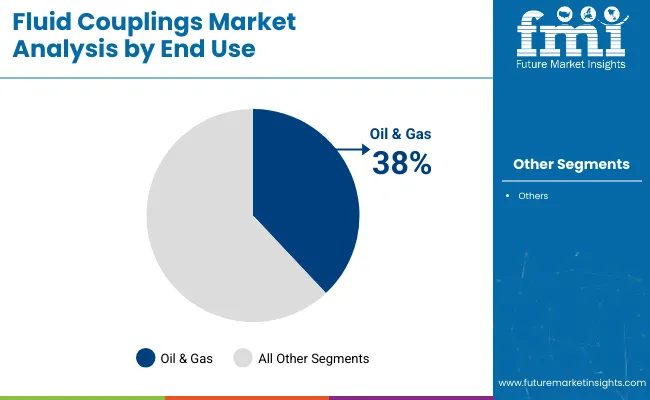
According to Future Market Insights’ (FMI) latest analysis, oil & gas segment will create lucrative growth opportunities for the fluid coupling industry. This is due to rising usage of fluid couplings in oil & gas sector.

The oil & gas segment witnessed a CAGR of 5.4% during the historical timeframe and for the projection period, it is likely to thrive at 4.4% CAGR.

Fluid couplings are being increasingly used in the oil & gas sector to transmit power in gas turbines, compressors, pumps, and other equipment. This is because they fulfill the torque requirements of the oil and gas sectors and facilitate improvements in turbomachinery equipment.

Development of high-performance fluid couplings with greater stability and higher speed suitable for oil & gas applications will further boost the target segment.

Get the data you need at a Fraction of the cost

Personalize your report by choosing insights you need
and save 40%!

Competitive Landscape

Leading fluid coupling manufacturers listed in the report include ABB Group, Altra Industrial Motion Corporation, Fluid Hose & Coupling Inc., Hackforth Holding GmbH, Ningbo Parmicro Fluids Technology Co., Ltd., Rexnord Industries LLC, Siemens AG, Voith GmbH & Co. KGaA, Transfluid S.p.A., and Vulkan Drive Tech.

These key fluid coupling manufacturing companies are continuously innovative to develop high performance solutions that meet industrial requirements. They also use tactics such as acquisitions, mergers, partnerships, agreements, facility expansions, and collaborations to gain a competitive edge in the market.

Recent developments:

  • In May 2023, Siemens announced the acquisition of Mass-Tech Controls PEV division to strengthen its presence across India as well as meet fast-growing demand for electric vehicle charging infrastructure.
  • In May 2023, ABB Group completed acquisition of Siemens’ low voltage NEMAS motor business to strengthen its presence and expand its offerings.
  • In May 2021, new force-guided coupling relays for safety related applications were introduced by Siemens.
  • In February 2019, Regal Rexnord Corporation completed the acquisition of Altra Industrial Motion Corp.
  • In 2021, new Hydrodynamic fluid couplings were introduced by FLUDEX.
  • In 2017, the latest edition of TurboBelt TPXL range of fill-controlled coupling was introduced by Voith. The new extended TurboBelt TPXL family of fluid couplings is designed for belt conveyor systems.

Scope of the Report

Attributes Details

Estimated Market Value (2023)

US$ 1.8 billion

Projected Market Value (2033)

US$ 2.8 billion

Anticipated Growth Rate (2023 to 2033)

4.6% CAGR

Historical Data

2018 to 2022

Forecast Period

2023 to 2033

Quantitative Units

Revenue in US$ Billion, Volume in Units, and CAGR from 2023 to 2033

Report Coverage

Revenue Forecast, Volume Forecast, Company Ranking, Competitive Landscape, Growth Factors, Trends and Pricing Analysis

Segments Covered

Type, End Use, and Region

Regions Covered

North America, Latin America, Western Europe, Eastern Europe, South Asia and Pacific, East Asia, and the Middle East & Africa

Key Countries Covered

United States, Canada, Brazil, Mexico, Germany, United Kingdom, France, Italy, Spain, Nordic, Russia, Poland, China, India, Thailand, Indonesia, Australia and New Zealand, Japan, GCC countries, North Africa, South Africa, and others.

Key Companies Profiled

  • ABB Group
  • Altra Industrial Motion Corporation
  • Fluid Hose & Coupling Inc.
  • Hackforth Holding GmbH
  • Ningbo Parmicro Fluids Technology Co., Ltd.
  • Rexnord Industries LLC
  • Siemens AG
  • Voith GmbH & Co. KGaA
  • Transfluid S.p.A.
  • Vulkan Drive Tech

Global Fluid Couplings Market Segmentation

By Type:

  • Constant Fill Fluid Couplings
  • Variable Fill Fluid Couplings
  • Slip Fluid Couplings
  • Scoop Control Fluid Couplings

By End Use:

  • Oil & Gas
  • Chemical
  • Metals & Mining
  • Power Plants
  • Others

By Region:

  • North America
  • Latin America
  • Western Europe
  • Eastern Europe
  • East Asia
  • South Asia and Pacific
  • Middle East and Africa

Frequently Asked Questions

Japan, the United States, and the United Kingdom may witness significant growth in the market.

The United Kingdom, China, and the United States dominate the global market.

The market is forecast to register a CAGR of 4.6% through 2033.

From 2018 to 2022, the market expanded at a CAGR of 5.5%.

Technological advancement disrupts the current market trends.

Table of Content

1. Executive Summary

    1.1. Global Market Outlook

    1.2. Demand-side Trends

    1.3. Supply-side Trends

    1.4. Technology Roadmap Analysis

    1.5. Analysis and Recommendations

2. Market Overview

    2.1. Market Coverage / Taxonomy

    2.2. Market Definition / Scope / Limitations

3. Market Background

    3.1. Market Dynamics

        3.1.1. Drivers

        3.1.2. Restraints

        3.1.3. Opportunity

        3.1.4. Trends

    3.2. Scenario Forecast

        3.2.1. Demand in Optimistic Scenario

        3.2.2. Demand in Likely Scenario

        3.2.3. Demand in Conservative Scenario

    3.3. Opportunity Map Analysis

    3.4. Product Life Cycle Analysis

    3.5. Supply Chain Analysis

        3.5.1. Supply Side Participants and their Roles

            3.5.1.1. Producers

            3.5.1.2. Mid-Level Participants (Traders/ Agents/ Brokers)

            3.5.1.3. Wholesalers and Distributors

        3.5.2. Value Added and Value Created at Node in the Supply Chain

        3.5.3. List of Raw Material Suppliers

        3.5.4. List of Existing and Potential Buyer’s

    3.6. Investment Feasibility Matrix

    3.7. Value Chain Analysis

        3.7.1. Profit Margin Analysis

        3.7.2. Wholesalers and Distributors

        3.7.3. Retailers

    3.8. PESTLE and Porter’s Analysis

    3.9. Regulatory Landscape

        3.9.1. By Key Regions

        3.9.2. By Key Countries

    3.10. Regional Parent Market Outlook

    3.11. Production and Consumption Statistics

    3.12. Import and Export Statistics

4. Global Market Analysis 2018 to 2022 and Forecast, 2023 to 2033

    4.1. Historical Market Size Value (US$ Billion) & Volume (Units) Analysis, 2018 to 2022

    4.2. Current and Future Market Size Value (US$ Billion) & Volume (Units) Projections, 2023 to 2033

        4.2.1. Y-o-Y Growth Trend Analysis

        4.2.2. Absolute $ Opportunity Analysis

5. Global Market Analysis 2018 to 2022 and Forecast 2023 to 2033, By End Use

    5.1. Introduction / Key Findings

    5.2. Historical Market Size Value (US$ Billion) & Volume (Units) Analysis By End Use, 2018 to 2022

    5.3. Current and Future Market Size Value (US$ Billion) & Volume (Units) Analysis and Forecast By End Use, 2023 to 2033

        5.3.1. Oil & Gas

        5.3.2. Chemical

        5.3.3. Metals & Mining

        5.3.4. Power Plants

        5.3.5. Others

    5.4. Y-o-Y Growth Trend Analysis By End Use, 2018 to 2022

    5.5. Absolute $ Opportunity Analysis By End Use, 2023 to 2033

6. Global Market Analysis 2018 to 2022 and Forecast 2023 to 2033, By Type

    6.1. Introduction / Key Findings

    6.2. Historical Market Size Value (US$ Billion) & Volume (Units) Analysis By Type, 2018 to 2022

    6.3. Current and Future Market Size Value (US$ Billion) & Volume (Units) Analysis and Forecast By Type, 2023 to 2033

        6.3.1. Constant Fill Fluid Couplings

        6.3.2. Variable Fill Fluid Couplings

        6.3.3. Slip Fluid Couplings

        6.3.4. Scoop Control Fluid Couplings

    6.4. Y-o-Y Growth Trend Analysis By Type, 2018 to 2022

    6.5. Absolute $ Opportunity Analysis By Type, 2023 to 2033

7. Global Market Analysis 2018 to 2022 and Forecast 2023 to 2033, By Region

    7.1. Introduction

    7.2. Historical Market Size Value (US$ Billion) & Volume (Units) Analysis By Region, 2018 to 2022

    7.3. Current Market Size Value (US$ Billion) & Volume (Units) Analysis and Forecast By Region, 2023 to 2033

        7.3.1. North America

        7.3.2. Latin America

        7.3.3. Western Europe

        7.3.4. Eastern Europe

        7.3.5. South Asia and Pacific

        7.3.6. East Asia

        7.3.7. Middle East and Africa

    7.4. Market Attractiveness Analysis By Region

8. North America Market Analysis 2018 to 2022 and Forecast 2023 to 2033, By Country

    8.1. Historical Market Size Value (US$ Billion) & Volume (Units) Trend Analysis By Market Taxonomy, 2018 to 2022

    8.2. Market Size Value (US$ Billion) & Volume (Units) Forecast By Market Taxonomy, 2023 to 2033

        8.2.1. By Country

            8.2.1.1. United States

            8.2.1.2. Canada

        8.2.2. By End Use

        8.2.3. By Type

    8.3. Market Attractiveness Analysis

        8.3.1. By Country

        8.3.2. By End Use

        8.3.3. By Type

    8.4. Key Takeaways

9. Latin America Market Analysis 2018 to 2022 and Forecast 2023 to 2033, By Country

    9.1. Historical Market Size Value (US$ Billion) & Volume (Units) Trend Analysis By Market Taxonomy, 2018 to 2022

    9.2. Market Size Value (US$ Billion) & Volume (Units) Forecast By Market Taxonomy, 2023 to 2033

        9.2.1. By Country

            9.2.1.1. Brazil

            9.2.1.2. Mexico

            9.2.1.3. Rest of Latin America

        9.2.2. By End Use

        9.2.3. By Type

    9.3. Market Attractiveness Analysis

        9.3.1. By Country

        9.3.2. By End Use

        9.3.3. By Type

    9.4. Key Takeaways

10. Western Europe Market Analysis 2018 to 2022 and Forecast 2023 to 2033, By Country

    10.1. Historical Market Size Value (US$ Billion) & Volume (Units) Trend Analysis By Market Taxonomy, 2018 to 2022

    10.2. Market Size Value (US$ Billion) & Volume (Units) Forecast By Market Taxonomy, 2023 to 2033

        10.2.1. By Country

            10.2.1.1. Germany

            10.2.1.2. United Kingdom

            10.2.1.3. France

            10.2.1.4. Spain

            10.2.1.5. Italy

            10.2.1.6. Rest of Western Europe

        10.2.2. By End Use

        10.2.3. By Type

    10.3. Market Attractiveness Analysis

        10.3.1. By Country

        10.3.2. By End Use

        10.3.3. By Type

    10.4. Key Takeaways

11. Eastern Europe Market Analysis 2018 to 2022 and Forecast 2023 to 2033, By Country

    11.1. Historical Market Size Value (US$ Billion) & Volume (Units) Trend Analysis By Market Taxonomy, 2018 to 2022

    11.2. Market Size Value (US$ Billion) & Volume (Units) Forecast By Market Taxonomy, 2023 to 2033

        11.2.1. By Country

            11.2.1.1. Poland

            11.2.1.2. Russia

            11.2.1.3. Czech Republic

            11.2.1.4. Romania

            11.2.1.5. Rest of Eastern Europe

        11.2.2. By End Use

        11.2.3. By Type

    11.3. Market Attractiveness Analysis

        11.3.1. By Country

        11.3.2. By End Use

        11.3.3. By Type

    11.4. Key Takeaways

12. South Asia and Pacific Market Analysis 2018 to 2022 and Forecast 2023 to 2033, By Country

    12.1. Historical Market Size Value (US$ Billion) & Volume (Units) Trend Analysis By Market Taxonomy, 2018 to 2022

    12.2. Market Size Value (US$ Billion) & Volume (Units) Forecast By Market Taxonomy, 2023 to 2033

        12.2.1. By Country

            12.2.1.1. India

            12.2.1.2. Bangladesh

            12.2.1.3. Australia

            12.2.1.4. New Zealand

            12.2.1.5. Rest of South Asia and Pacific

        12.2.2. By End Use

        12.2.3. By Type

    12.3. Market Attractiveness Analysis

        12.3.1. By Country

        12.3.2. By End Use

        12.3.3. By Type

    12.4. Key Takeaways

13. East Asia Market Analysis 2018 to 2022 and Forecast 2023 to 2033, By Country

    13.1. Historical Market Size Value (US$ Billion) & Volume (Units) Trend Analysis By Market Taxonomy, 2018 to 2022

    13.2. Market Size Value (US$ Billion) & Volume (Units) Forecast By Market Taxonomy, 2023 to 2033

        13.2.1. By Country

            13.2.1.1. China

            13.2.1.2. Japan

            13.2.1.3. South Korea

        13.2.2. By End Use

        13.2.3. By Type

    13.3. Market Attractiveness Analysis

        13.3.1. By Country

        13.3.2. By End Use

        13.3.3. By Type

    13.4. Key Takeaways

14. Middle East and Africa Market Analysis 2018 to 2022 and Forecast 2023 to 2033, By Country

    14.1. Historical Market Size Value (US$ Billion) & Volume (Units) Trend Analysis By Market Taxonomy, 2018 to 2022

    14.2. Market Size Value (US$ Billion) & Volume (Units) Forecast By Market Taxonomy, 2023 to 2033

        14.2.1. By Country

            14.2.1.1. GCC Countries

            14.2.1.2. South Africa

            14.2.1.3. Israel

            14.2.1.4. Rest of Middle East & Africa

        14.2.2. By End Use

        14.2.3. By Type

    14.3. Market Attractiveness Analysis

        14.3.1. By Country

        14.3.2. By End Use

        14.3.3. By Type

    14.4. Key Takeaways

15. Key Countries Market Analysis

    15.1. United States

        15.1.1. Pricing Analysis

        15.1.2. Market Share Analysis, 2023

            15.1.2.1. By End Use

            15.1.2.2. By Type

    15.2. Canada

        15.2.1. Pricing Analysis

        15.2.2. Market Share Analysis, 2023

            15.2.2.1. By End Use

            15.2.2.2. By Type

    15.3. Brazil

        15.3.1. Pricing Analysis

        15.3.2. Market Share Analysis, 2023

            15.3.2.1. By End Use

            15.3.2.2. By Type

    15.4. Mexico

        15.4.1. Pricing Analysis

        15.4.2. Market Share Analysis, 2023

            15.4.2.1. By End Use

            15.4.2.2. By Type

    15.5. Germany

        15.5.1. Pricing Analysis

        15.5.2. Market Share Analysis, 2023

            15.5.2.1. By End Use

            15.5.2.2. By Type

    15.6. United Kingdom

        15.6.1. Pricing Analysis

        15.6.2. Market Share Analysis, 2023

            15.6.2.1. By End Use

            15.6.2.2. By Type

    15.7. France

        15.7.1. Pricing Analysis

        15.7.2. Market Share Analysis, 2023

            15.7.2.1. By End Use

            15.7.2.2. By Type

    15.8. Spain

        15.8.1. Pricing Analysis

        15.8.2. Market Share Analysis, 2023

            15.8.2.1. By End Use

            15.8.2.2. By Type

    15.9. Italy

        15.9.1. Pricing Analysis

        15.9.2. Market Share Analysis, 2023

            15.9.2.1. By End Use

            15.9.2.2. By Type

    15.10. Poland

        15.10.1. Pricing Analysis

        15.10.2. Market Share Analysis, 2023

            15.10.2.1. By End Use

            15.10.2.2. By Type

    15.11. Russia

        15.11.1. Pricing Analysis

        15.11.2. Market Share Analysis, 2023

            15.11.2.1. By End Use

            15.11.2.2. By Type

    15.12. Czech Republic

        15.12.1. Pricing Analysis

        15.12.2. Market Share Analysis, 2023

            15.12.2.1. By End Use

            15.12.2.2. By Type

    15.13. Romania

        15.13.1. Pricing Analysis

        15.13.2. Market Share Analysis, 2023

            15.13.2.1. By End Use

            15.13.2.2. By Type

    15.14. India

        15.14.1. Pricing Analysis

        15.14.2. Market Share Analysis, 2023

            15.14.2.1. By End Use

            15.14.2.2. By Type

    15.15. Bangladesh

        15.15.1. Pricing Analysis

        15.15.2. Market Share Analysis, 2023

            15.15.2.1. By End Use

            15.15.2.2. By Type

    15.16. Australia

        15.16.1. Pricing Analysis

        15.16.2. Market Share Analysis, 2023

            15.16.2.1. By End Use

            15.16.2.2. By Type

    15.17. New Zealand

        15.17.1. Pricing Analysis

        15.17.2. Market Share Analysis, 2023

            15.17.2.1. By End Use

            15.17.2.2. By Type

    15.18. China

        15.18.1. Pricing Analysis

        15.18.2. Market Share Analysis, 2023

            15.18.2.1. By End Use

            15.18.2.2. By Type

    15.19. Japan

        15.19.1. Pricing Analysis

        15.19.2. Market Share Analysis, 2023

            15.19.2.1. By End Use

            15.19.2.2. By Type

    15.20. South Korea

        15.20.1. Pricing Analysis

        15.20.2. Market Share Analysis, 2023

            15.20.2.1. By End Use

            15.20.2.2. By Type

    15.21. GCC Countries

        15.21.1. Pricing Analysis

        15.21.2. Market Share Analysis, 2023

            15.21.2.1. By End Use

            15.21.2.2. By Type

    15.22. South Africa

        15.22.1. Pricing Analysis

        15.22.2. Market Share Analysis, 2023

            15.22.2.1. By End Use

            15.22.2.2. By Type

    15.23. Israel

        15.23.1. Pricing Analysis

        15.23.2. Market Share Analysis, 2023

            15.23.2.1. By End Use

            15.23.2.2. By Type

16. Market Structure Analysis

    16.1. Competition Dashboard

    16.2. Competition Benchmarking

    16.3. Market Share Analysis of Top Players

        16.3.1. By Regional

        16.3.2. By End Use

        16.3.3. By Type

17. Competition Analysis

    17.1. Competition Deep Dive

        17.1.1. ABB Group

            17.1.1.1. Overview

            17.1.1.2. Product Portfolio

            17.1.1.3. Profitability by Market Segments

            17.1.1.4. Sales Footprint

            17.1.1.5. Strategy Overview

                17.1.1.5.1. Marketing Strategy

                17.1.1.5.2. Product Strategy

                17.1.1.5.3. Channel Strategy

        17.1.2. Altra Industrial Motion Corporation

            17.1.2.1. Overview

            17.1.2.2. Product Portfolio

            17.1.2.3. Profitability by Market Segments

            17.1.2.4. Sales Footprint

            17.1.2.5. Strategy Overview

                17.1.2.5.1. Marketing Strategy

                17.1.2.5.2. Product Strategy

                17.1.2.5.3. Channel Strategy

        17.1.3. Fluid Hose & Coupling Inc.

            17.1.3.1. Overview

            17.1.3.2. Product Portfolio

            17.1.3.3. Profitability by Market Segments

            17.1.3.4. Sales Footprint

            17.1.3.5. Strategy Overview

                17.1.3.5.1. Marketing Strategy

                17.1.3.5.2. Product Strategy

                17.1.3.5.3. Channel Strategy

        17.1.4. Hackforth Holding GmbH

            17.1.4.1. Overview

            17.1.4.2. Product Portfolio

            17.1.4.3. Profitability by Market Segments

            17.1.4.4. Sales Footprint

            17.1.4.5. Strategy Overview

                17.1.4.5.1. Marketing Strategy

                17.1.4.5.2. Product Strategy

                17.1.4.5.3. Channel Strategy

        17.1.5. Ningbo Parmicro Fluids Technology Co., Ltd.

            17.1.5.1. Overview

            17.1.5.2. Product Portfolio

            17.1.5.3. Profitability by Market Segments

            17.1.5.4. Sales Footprint

            17.1.5.5. Strategy Overview

                17.1.5.5.1. Marketing Strategy

                17.1.5.5.2. Product Strategy

                17.1.5.5.3. Channel Strategy

        17.1.6. Rexnord Industries LLC

            17.1.6.1. Overview

            17.1.6.2. Product Portfolio

            17.1.6.3. Profitability by Market Segments

            17.1.6.4. Sales Footprint

            17.1.6.5. Strategy Overview

                17.1.6.5.1. Marketing Strategy

                17.1.6.5.2. Product Strategy

                17.1.6.5.3. Channel Strategy

        17.1.7. Siemens AG

            17.1.7.1. Overview

            17.1.7.2. Product Portfolio

            17.1.7.3. Profitability by Market Segments

            17.1.7.4. Sales Footprint

            17.1.7.5. Strategy Overview

                17.1.7.5.1. Marketing Strategy

                17.1.7.5.2. Product Strategy

                17.1.7.5.3. Channel Strategy

        17.1.8. Voith GmbH & Co. KGaA

            17.1.8.1. Overview

            17.1.8.2. Product Portfolio

            17.1.8.3. Profitability by Market Segments

            17.1.8.4. Sales Footprint

            17.1.8.5. Strategy Overview

                17.1.8.5.1. Marketing Strategy

                17.1.8.5.2. Product Strategy

                17.1.8.5.3. Channel Strategy

        17.1.9. Transfluid S.p.A.

            17.1.9.1. Overview

            17.1.9.2. Product Portfolio

            17.1.9.3. Profitability by Market Segments

            17.1.9.4. Sales Footprint

            17.1.9.5. Strategy Overview

                17.1.9.5.1. Marketing Strategy

                17.1.9.5.2. Product Strategy

                17.1.9.5.3. Channel Strategy

        17.1.10. Vulkan Drive Tech

            17.1.10.1. Overview

            17.1.10.2. Product Portfolio

            17.1.10.3. Profitability by Market Segments

            17.1.10.4. Sales Footprint

            17.1.10.5. Strategy Overview

                17.1.10.5.1. Marketing Strategy

                17.1.10.5.2. Product Strategy

                17.1.10.5.3. Channel Strategy

18. Assumptions & Acronyms Used

19. Research Methodology

Don't pay for what you don't need

Customize your report by selecting specific countries or regions and save 30%!

List of Tables

Table 1: Global Market Value (US$ Billion) Forecast by Region, 2018 to 2033

Table 2: Global Market Volume (Units) Forecast by Region, 2018 to 2033

Table 3: Global Market Value (US$ Billion) Forecast by End Use, 2018 to 2033

Table 4: Global Market Volume (Units) Forecast by End Use, 2018 to 2033

Table 5: Global Market Value (US$ Billion) Forecast by Type, 2018 to 2033

Table 6: Global Market Volume (Units) Forecast by Type, 2018 to 2033

Table 7: North America Market Value (US$ Billion) Forecast by Country, 2018 to 2033

Table 8: North America Market Volume (Units) Forecast by Country, 2018 to 2033

Table 9: North America Market Value (US$ Billion) Forecast by End Use, 2018 to 2033

Table 10: North America Market Volume (Units) Forecast by End Use, 2018 to 2033

Table 11: North America Market Value (US$ Billion) Forecast by Type, 2018 to 2033

Table 12: North America Market Volume (Units) Forecast by Type, 2018 to 2033

Table 13: Latin America Market Value (US$ Billion) Forecast by Country, 2018 to 2033

Table 14: Latin America Market Volume (Units) Forecast by Country, 2018 to 2033

Table 15: Latin America Market Value (US$ Billion) Forecast by End Use, 2018 to 2033

Table 16: Latin America Market Volume (Units) Forecast by End Use, 2018 to 2033

Table 17: Latin America Market Value (US$ Billion) Forecast by Type, 2018 to 2033

Table 18: Latin America Market Volume (Units) Forecast by Type, 2018 to 2033

Table 19: Western Europe Market Value (US$ Billion) Forecast by Country, 2018 to 2033

Table 20: Western Europe Market Volume (Units) Forecast by Country, 2018 to 2033

Table 21: Western Europe Market Value (US$ Billion) Forecast by End Use, 2018 to 2033

Table 22: Western Europe Market Volume (Units) Forecast by End Use, 2018 to 2033

Table 23: Western Europe Market Value (US$ Billion) Forecast by Type, 2018 to 2033

Table 24: Western Europe Market Volume (Units) Forecast by Type, 2018 to 2033

Table 25: Eastern Europe Market Value (US$ Billion) Forecast by Country, 2018 to 2033

Table 26: Eastern Europe Market Volume (Units) Forecast by Country, 2018 to 2033

Table 27: Eastern Europe Market Value (US$ Billion) Forecast by End Use, 2018 to 2033

Table 28: Eastern Europe Market Volume (Units) Forecast by End Use, 2018 to 2033

Table 29: Eastern Europe Market Value (US$ Billion) Forecast by Type, 2018 to 2033

Table 30: Eastern Europe Market Volume (Units) Forecast by Type, 2018 to 2033

Table 31: South Asia and Pacific Market Value (US$ Billion) Forecast by Country, 2018 to 2033

Table 32: South Asia and Pacific Market Volume (Units) Forecast by Country, 2018 to 2033

Table 33: South Asia and Pacific Market Value (US$ Billion) Forecast by End Use, 2018 to 2033

Table 34: South Asia and Pacific Market Volume (Units) Forecast by End Use, 2018 to 2033

Table 35: South Asia and Pacific Market Value (US$ Billion) Forecast by Type, 2018 to 2033

Table 36: South Asia and Pacific Market Volume (Units) Forecast by Type, 2018 to 2033

Table 37: East Asia Market Value (US$ Billion) Forecast by Country, 2018 to 2033

Table 38: East Asia Market Volume (Units) Forecast by Country, 2018 to 2033

Table 39: East Asia Market Value (US$ Billion) Forecast by End Use, 2018 to 2033

Table 40: East Asia Market Volume (Units) Forecast by End Use, 2018 to 2033

Table 41: East Asia Market Value (US$ Billion) Forecast by Type, 2018 to 2033

Table 42: East Asia Market Volume (Units) Forecast by Type, 2018 to 2033

Table 43: Middle East and Africa Market Value (US$ Billion) Forecast by Country, 2018 to 2033

Table 44: Middle East and Africa Market Volume (Units) Forecast by Country, 2018 to 2033

Table 45: Middle East and Africa Market Value (US$ Billion) Forecast by End Use, 2018 to 2033

Table 46: Middle East and Africa Market Volume (Units) Forecast by End Use, 2018 to 2033

Table 47: Middle East and Africa Market Value (US$ Billion) Forecast by Type, 2018 to 2033

Table 48: Middle East and Africa Market Volume (Units) Forecast by Type, 2018 to 2033
Nikhil Kaitwade
Nikhil Kaitwade
Principal Consultant
LinkedIn
Talk to Analyst

Find your sweet spots for generating winning opportunities in this market.

List of Charts

Figure 1: Global Market Value (US$ Billion) by End Use, 2023 to 2033

Figure 2: Global Market Value (US$ Billion) by Type, 2023 to 2033

Figure 3: Global Market Value (US$ Billion) by Region, 2023 to 2033

Figure 4: Global Market Value (US$ Billion) Analysis by Region, 2018 to 2033

Figure 5: Global Market Volume (Units) Analysis by Region, 2018 to 2033

Figure 6: Global Market Value Share (%) and BPS Analysis by Region, 2023 to 2033

Figure 7: Global Market Y-o-Y Growth (%) Projections by Region, 2023 to 2033

Figure 8: Global Market Value (US$ Billion) Analysis by End Use, 2018 to 2033

Figure 9: Global Market Volume (Units) Analysis by End Use, 2018 to 2033

Figure 10: Global Market Value Share (%) and BPS Analysis by End Use, 2023 to 2033

Figure 11: Global Market Y-o-Y Growth (%) Projections by End Use, 2023 to 2033

Figure 12: Global Market Value (US$ Billion) Analysis by Type, 2018 to 2033

Figure 13: Global Market Volume (Units) Analysis by Type, 2018 to 2033

Figure 14: Global Market Value Share (%) and BPS Analysis by Type, 2023 to 2033

Figure 15: Global Market Y-o-Y Growth (%) Projections by Type, 2023 to 2033

Figure 16: Global Market Attractiveness by End Use, 2023 to 2033

Figure 17: Global Market Attractiveness by Type, 2023 to 2033

Figure 18: Global Market Attractiveness by Region, 2023 to 2033

Figure 19: North America Market Value (US$ Billion) by End Use, 2023 to 2033

Figure 20: North America Market Value (US$ Billion) by Type, 2023 to 2033

Figure 21: North America Market Value (US$ Billion) by Country, 2023 to 2033

Figure 22: North America Market Value (US$ Billion) Analysis by Country, 2018 to 2033

Figure 23: North America Market Volume (Units) Analysis by Country, 2018 to 2033

Figure 24: North America Market Value Share (%) and BPS Analysis by Country, 2023 to 2033

Figure 25: North America Market Y-o-Y Growth (%) Projections by Country, 2023 to 2033

Figure 26: North America Market Value (US$ Billion) Analysis by End Use, 2018 to 2033

Figure 27: North America Market Volume (Units) Analysis by End Use, 2018 to 2033

Figure 28: North America Market Value Share (%) and BPS Analysis by End Use, 2023 to 2033

Figure 29: North America Market Y-o-Y Growth (%) Projections by End Use, 2023 to 2033

Figure 30: North America Market Value (US$ Billion) Analysis by Type, 2018 to 2033

Figure 31: North America Market Volume (Units) Analysis by Type, 2018 to 2033

Figure 32: North America Market Value Share (%) and BPS Analysis by Type, 2023 to 2033

Figure 33: North America Market Y-o-Y Growth (%) Projections by Type, 2023 to 2033

Figure 34: North America Market Attractiveness by End Use, 2023 to 2033

Figure 35: North America Market Attractiveness by Type, 2023 to 2033

Figure 36: North America Market Attractiveness by Country, 2023 to 2033

Figure 37: Latin America Market Value (US$ Billion) by End Use, 2023 to 2033

Figure 38: Latin America Market Value (US$ Billion) by Type, 2023 to 2033

Figure 39: Latin America Market Value (US$ Billion) by Country, 2023 to 2033

Figure 40: Latin America Market Value (US$ Billion) Analysis by Country, 2018 to 2033

Figure 41: Latin America Market Volume (Units) Analysis by Country, 2018 to 2033

Figure 42: Latin America Market Value Share (%) and BPS Analysis by Country, 2023 to 2033

Figure 43: Latin America Market Y-o-Y Growth (%) Projections by Country, 2023 to 2033

Figure 44: Latin America Market Value (US$ Billion) Analysis by End Use, 2018 to 2033

Figure 45: Latin America Market Volume (Units) Analysis by End Use, 2018 to 2033

Figure 46: Latin America Market Value Share (%) and BPS Analysis by End Use, 2023 to 2033

Figure 47: Latin America Market Y-o-Y Growth (%) Projections by End Use, 2023 to 2033

Figure 48: Latin America Market Value (US$ Billion) Analysis by Type, 2018 to 2033

Figure 49: Latin America Market Volume (Units) Analysis by Type, 2018 to 2033

Figure 50: Latin America Market Value Share (%) and BPS Analysis by Type, 2023 to 2033

Figure 51: Latin America Market Y-o-Y Growth (%) Projections by Type, 2023 to 2033

Figure 52: Latin America Market Attractiveness by End Use, 2023 to 2033

Figure 53: Latin America Market Attractiveness by Type, 2023 to 2033

Figure 54: Latin America Market Attractiveness by Country, 2023 to 2033

Figure 55: Western Europe Market Value (US$ Billion) by End Use, 2023 to 2033

Figure 56: Western Europe Market Value (US$ Billion) by Type, 2023 to 2033

Figure 57: Western Europe Market Value (US$ Billion) by Country, 2023 to 2033

Figure 58: Western Europe Market Value (US$ Billion) Analysis by Country, 2018 to 2033

Figure 59: Western Europe Market Volume (Units) Analysis by Country, 2018 to 2033

Figure 60: Western Europe Market Value Share (%) and BPS Analysis by Country, 2023 to 2033

Figure 61: Western Europe Market Y-o-Y Growth (%) Projections by Country, 2023 to 2033

Figure 62: Western Europe Market Value (US$ Billion) Analysis by End Use, 2018 to 2033

Figure 63: Western Europe Market Volume (Units) Analysis by End Use, 2018 to 2033

Figure 64: Western Europe Market Value Share (%) and BPS Analysis by End Use, 2023 to 2033

Figure 65: Western Europe Market Y-o-Y Growth (%) Projections by End Use, 2023 to 2033

Figure 66: Western Europe Market Value (US$ Billion) Analysis by Type, 2018 to 2033

Figure 67: Western Europe Market Volume (Units) Analysis by Type, 2018 to 2033

Figure 68: Western Europe Market Value Share (%) and BPS Analysis by Type, 2023 to 2033

Figure 69: Western Europe Market Y-o-Y Growth (%) Projections by Type, 2023 to 2033

Figure 70: Western Europe Market Attractiveness by End Use, 2023 to 2033

Figure 71: Western Europe Market Attractiveness by Type, 2023 to 2033

Figure 72: Western Europe Market Attractiveness by Country, 2023 to 2033

Figure 73: Eastern Europe Market Value (US$ Billion) by End Use, 2023 to 2033

Figure 74: Eastern Europe Market Value (US$ Billion) by Type, 2023 to 2033

Figure 75: Eastern Europe Market Value (US$ Billion) by Country, 2023 to 2033

Figure 76: Eastern Europe Market Value (US$ Billion) Analysis by Country, 2018 to 2033

Figure 77: Eastern Europe Market Volume (Units) Analysis by Country, 2018 to 2033

Figure 78: Eastern Europe Market Value Share (%) and BPS Analysis by Country, 2023 to 2033

Figure 79: Eastern Europe Market Y-o-Y Growth (%) Projections by Country, 2023 to 2033

Figure 80: Eastern Europe Market Value (US$ Billion) Analysis by End Use, 2018 to 2033

Figure 81: Eastern Europe Market Volume (Units) Analysis by End Use, 2018 to 2033

Figure 82: Eastern Europe Market Value Share (%) and BPS Analysis by End Use, 2023 to 2033

Figure 83: Eastern Europe Market Y-o-Y Growth (%) Projections by End Use, 2023 to 2033

Figure 84: Eastern Europe Market Value (US$ Billion) Analysis by Type, 2018 to 2033

Figure 85: Eastern Europe Market Volume (Units) Analysis by Type, 2018 to 2033

Figure 86: Eastern Europe Market Value Share (%) and BPS Analysis by Type, 2023 to 2033

Figure 87: Eastern Europe Market Y-o-Y Growth (%) Projections by Type, 2023 to 2033

Figure 88: Eastern Europe Market Attractiveness by End Use, 2023 to 2033

Figure 89: Eastern Europe Market Attractiveness by Type, 2023 to 2033

Figure 90: Eastern Europe Market Attractiveness by Country, 2023 to 2033

Figure 91: South Asia and Pacific Market Value (US$ Billion) by End Use, 2023 to 2033

Figure 92: South Asia and Pacific Market Value (US$ Billion) by Type, 2023 to 2033

Figure 93: South Asia and Pacific Market Value (US$ Billion) by Country, 2023 to 2033

Figure 94: South Asia and Pacific Market Value (US$ Billion) Analysis by Country, 2018 to 2033

Figure 95: South Asia and Pacific Market Volume (Units) Analysis by Country, 2018 to 2033

Figure 96: South Asia and Pacific Market Value Share (%) and BPS Analysis by Country, 2023 to 2033

Figure 97: South Asia and Pacific Market Y-o-Y Growth (%) Projections by Country, 2023 to 2033

Figure 98: South Asia and Pacific Market Value (US$ Billion) Analysis by End Use, 2018 to 2033

Figure 99: South Asia and Pacific Market Volume (Units) Analysis by End Use, 2018 to 2033

Figure 100: South Asia and Pacific Market Value Share (%) and BPS Analysis by End Use, 2023 to 2033

Figure 101: South Asia and Pacific Market Y-o-Y Growth (%) Projections by End Use, 2023 to 2033

Figure 102: South Asia and Pacific Market Value (US$ Billion) Analysis by Type, 2018 to 2033

Figure 103: South Asia and Pacific Market Volume (Units) Analysis by Type, 2018 to 2033

Figure 104: South Asia and Pacific Market Value Share (%) and BPS Analysis by Type, 2023 to 2033

Figure 105: South Asia and Pacific Market Y-o-Y Growth (%) Projections by Type, 2023 to 2033

Figure 106: South Asia and Pacific Market Attractiveness by End Use, 2023 to 2033

Figure 107: South Asia and Pacific Market Attractiveness by Type, 2023 to 2033

Figure 108: South Asia and Pacific Market Attractiveness by Country, 2023 to 2033

Figure 109: East Asia Market Value (US$ Billion) by End Use, 2023 to 2033

Figure 110: East Asia Market Value (US$ Billion) by Type, 2023 to 2033

Figure 111: East Asia Market Value (US$ Billion) by Country, 2023 to 2033

Figure 112: East Asia Market Value (US$ Billion) Analysis by Country, 2018 to 2033

Figure 113: East Asia Market Volume (Units) Analysis by Country, 2018 to 2033

Figure 114: East Asia Market Value Share (%) and BPS Analysis by Country, 2023 to 2033

Figure 115: East Asia Market Y-o-Y Growth (%) Projections by Country, 2023 to 2033

Figure 116: East Asia Market Value (US$ Billion) Analysis by End Use, 2018 to 2033

Figure 117: East Asia Market Volume (Units) Analysis by End Use, 2018 to 2033

Figure 118: East Asia Market Value Share (%) and BPS Analysis by End Use, 2023 to 2033

Figure 119: East Asia Market Y-o-Y Growth (%) Projections by End Use, 2023 to 2033

Figure 120: East Asia Market Value (US$ Billion) Analysis by Type, 2018 to 2033

Figure 121: East Asia Market Volume (Units) Analysis by Type, 2018 to 2033

Figure 122: East Asia Market Value Share (%) and BPS Analysis by Type, 2023 to 2033

Figure 123: East Asia Market Y-o-Y Growth (%) Projections by Type, 2023 to 2033

Figure 124: East Asia Market Attractiveness by End Use, 2023 to 2033

Figure 125: East Asia Market Attractiveness by Type, 2023 to 2033

Figure 126: East Asia Market Attractiveness by Country, 2023 to 2033

Figure 127: Middle East and Africa Market Value (US$ Billion) by End Use, 2023 to 2033

Figure 128: Middle East and Africa Market Value (US$ Billion) by Type, 2023 to 2033

Figure 129: Middle East and Africa Market Value (US$ Billion) by Country, 2023 to 2033

Figure 130: Middle East and Africa Market Value (US$ Billion) Analysis by Country, 2018 to 2033

Figure 131: Middle East and Africa Market Volume (Units) Analysis by Country, 2018 to 2033

Figure 132: Middle East and Africa Market Value Share (%) and BPS Analysis by Country, 2023 to 2033

Figure 133: Middle East and Africa Market Y-o-Y Growth (%) Projections by Country, 2023 to 2033

Figure 134: Middle East and Africa Market Value (US$ Billion) Analysis by End Use, 2018 to 2033

Figure 135: Middle East and Africa Market Volume (Units) Analysis by End Use, 2018 to 2033

Figure 136: Middle East and Africa Market Value Share (%) and BPS Analysis by End Use, 2023 to 2033

Figure 137: Middle East and Africa Market Y-o-Y Growth (%) Projections by End Use, 2023 to 2033

Figure 138: Middle East and Africa Market Value (US$ Billion) Analysis by Type, 2018 to 2033

Figure 139: Middle East and Africa Market Volume (Units) Analysis by Type, 2018 to 2033

Figure 140: Middle East and Africa Market Value Share (%) and BPS Analysis by Type, 2023 to 2033

Figure 141: Middle East and Africa Market Y-o-Y Growth (%) Projections by Type, 2023 to 2033

Figure 142: Middle East and Africa Market Attractiveness by End Use, 2023 to 2033

Figure 143: Middle East and Africa Market Attractiveness by Type, 2023 to 2033

Figure 144: Middle East and Africa Market Attractiveness by Country, 2023 to 2033

Recommendations

Industrial Automation

Hydraulic Gear Pumps Market

Published : August 2023

Industrial Automation

Hydraulic Intensifiers Market

Published : February 2023

Technology

Industrial Coupling Market

Published : October 2022

Industrial Automation

Torque Limiting Couplings Market

Published : March 2018

Explore Industrial Automation Insights

View Reports

Fluid Couplings Market

We value your privacy

We use cookies to enhance your browsing experience, serve personalized ads or content, and analyze our traffic.

By clicking "Accept All", you consent to our use of cookies. Cookie Policy