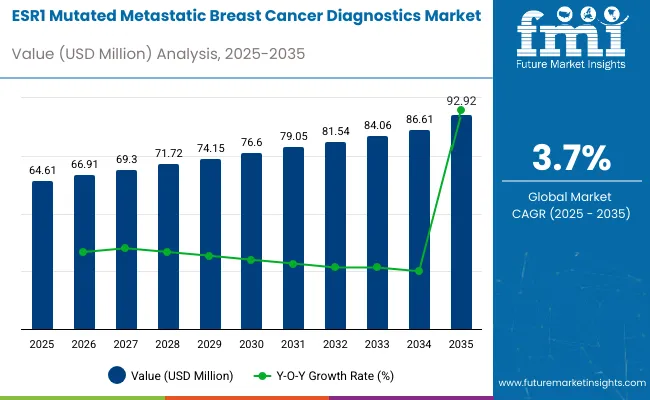
The ESR1 mutated metastatic breast cancer diagnostics market is valued at USD 64.61 million in 2025 and is slated to reach USD 92.92 million by 2035, registering a compound annual growth rate (CAGR) of 3.7%. This growth is driven by the increasing prevalence of ESR1 mutations in metastatic breast cancer patients and the rising demand for early and accurate diagnostics.

As the understanding of genetic mutations in breast cancer improves, personalized treatment strategies are becoming more common, leading to a higher adoption of diagnostic tests focused on identifying ESR1 mutations. Early detection of these mutations is critical for tailoring therapies, further boosting market growth.
Technological advancements in diagnostic tools are significantly influencing the market, with innovations in liquid biopsy techniques, next-generation sequencing (NGS), and PCR-based methods enhancing the ability to detect ESR1 mutations with greater precision and speed.
These technologies allow for less invasive testing, quicker results, and improved accuracy in identifying genetic mutations associated with metastatic breast cancer. The integration of artificial intelligence (AI) and machine learning in diagnostic platforms is improving the interpretation of complex genetic data, advancing personalized treatment plans for patients.
Government regulations and healthcare policies are playing a key role in the growth of this market by ensuring the availability and accessibility of cutting-edge diagnostic technologies. Many countries are strengthening guidelines for cancer diagnosis and treatment, encouraging the adoption of precision medicine.
Regulatory bodies are also focusing on making these diagnostics more affordable and accessible to a broader patient population. As healthcare systems continue to prioritize early diagnosis and personalized treatments, the ESR1 mutated metastatic breast cancer diagnostics market is expected to grow steadily, improving patient outcomes.
Breast cancer continues to be one of the most prevalent and concerning health challenges worldwide. The rising number of new cases each year highlights the urgent need for improved awareness, early detection, and effective treatment strategies. With a significant portion of cancer diagnoses among women attributed to breast cancer, the burden on healthcare systems is growing rapidly. This increasing incidence underscores the importance of continued research, accessible care, and public health initiatives aimed at reducing its impact and improving patient outcomes.
Companies in the ESR1 mutated metastatic breast cancer diagnostics space are advancing smart diagnostic technologies such as liquid biopsies, high-sensitivity PCR kits, and next-generation sequencing to support early mutation detection and more effective treatment planning. These innovations are enabling non-invasive, real-time monitoring of resistance-related mutations in hormone therapy patients.
The market is segmented based on region, test type, sample type, end user, and region. In terms of test type, the market is divided into NGS based and PCR based tests. Based on sample type, the market is categorized into tissue and plasma.
In terms of end user, the market is divided into hospital associated labs, independent diagnostic laboratories, diagnostic imaging centers, and cancer research institutes. By region, the market is classified into North America, Latin America, East Asia, South Asia & Pacific, Western Europe, Eastern Europe, and the Middle East & Africa.
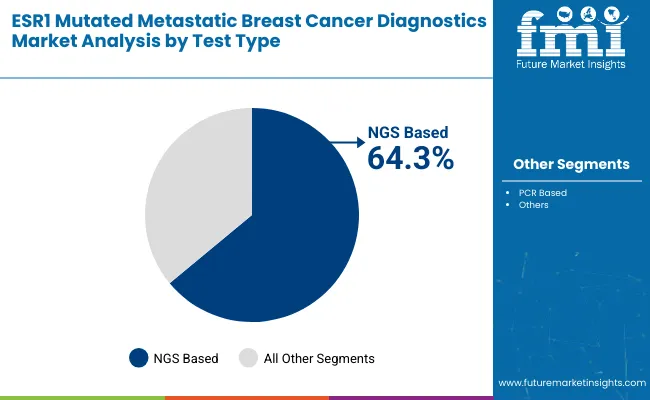
NGS-based (Next-Generation Sequencing) tests are expected to capture 64.3% of the market share in 2025. NGS technology has revolutionized cancer diagnostics by offering high-throughput, precise genetic testing, enabling the identification of mutations and alterations in cancer cells. For ESR1-mutated metastatic breast cancer, NGS allows for the identification of specific genetic alterations that can guide treatment decisions and personalize therapies.
NGS tests are favored for their ability to analyze multiple genes simultaneously, providing comprehensive genetic profiling and a more in-depth understanding of the cancer's molecular landscape. With an increasing demand for more accurate and comprehensive diagnostics, especially for precision medicine, NGS-based tests are increasingly being adopted in clinical settings.
Moreover, NGS provides greater sensitivity and specificity, which are crucial in detecting mutations at earlier stages, improving patient outcomes. As the market for personalized medicine and targeted therapies expands, the demand for NGS-based testing is expected to continue growing, making it the dominant test type in the ESR1-mutated metastatic breast cancer diagnostics market.

| Test Type Segment | Market Share (2025) |
|---|---|
| NGS Based | 64.3% |
The plasma sample type segment is projected to grow at a strong CAGR of 6.3% from 2025 to 2035. Plasma-based testing is gaining popularity due to its minimally invasive nature and ability to provide reliable diagnostic information.
For ESR1-mutated metastatic breast cancer, plasma samples are an ideal choice as they allow for liquid biopsy testing, which can detect circulating tumor DNA (ctDNA) and identify genetic mutations without the need for tissue biopsies. Liquid biopsy is particularly beneficial for patients who are not suitable candidates for invasive procedures or those who need continuous monitoring of their cancer's genetic profile. Plasma samples offer high sensitivity and can be easily obtained through routine blood draws, making them more accessible and less painful for patients.
The non-invasive nature of plasma-based testing, combined with its ability to provide real-time insights into tumor dynamics, is driving its adoption in clinical diagnostics. As advancements in liquid biopsy technologies continue, plasma-based tests are expected to become an essential tool for diagnosing and managing ESR1-mutated metastatic breast cancer.
| Sample Type Segment | CAGR (2025 to 2035) |
|---|---|
| Plasma | 6.3% |
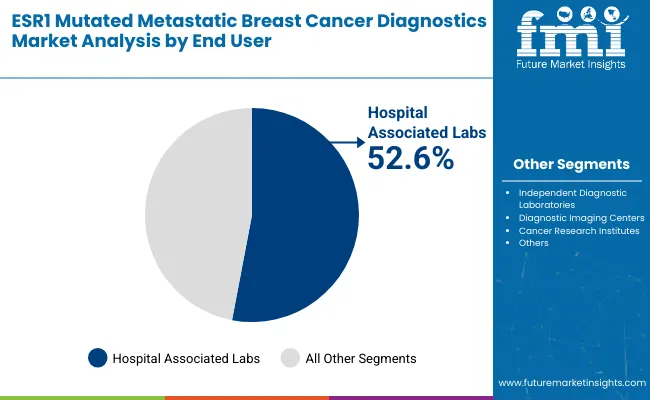
Hospital-associated labs are expected to capture 52.6% of the market share in 2025. These labs play a crucial role in the diagnosis and treatment of ESR1-mutated metastatic breast cancer, as they are typically equipped with advanced diagnostic tools and technologies required for accurate testing.
Hospital-associated labs are preferred by many patients due to the convenience and access to comprehensive healthcare services that they offer, including diagnostic imaging, genetic testing, and oncological care. Additionally, hospital labs are well-positioned to handle complex diagnostic tests such as NGS and PCR-based assays, which require high precision and specialized equipment.
These labs often work closely with oncologists to provide a detailed molecular diagnosis, which is essential for personalized cancer treatment and therapy decisions. As the need for rapid and accurate breast cancer diagnostics grows, hospital-associated labs are expected to remain the primary end users for ESR1-mutated metastatic breast cancer diagnostics, ensuring that these services are widely available and accessible to patients in need.

| End User Segment | Market Share (2025) |
|---|---|
| Hospital Associated Labs | 52.65% |
The global ESR1 mutated metastatic breast cancer diagnostics industry recorded a CAGR of 2.6% from 2020 to 2024. It attained a valuation of USD 62 million at the end of 2024. In the assessment period, the market for ESR1 mutated metastatic breast cancer diagnostics is poised to expand at a 3.7% CAGR.
| Historical CAGR (2020 to 2024) | Forecast CAGR (2025 to 2035) |
|---|---|
| 2.6% | 3.7% |
The increasing prevalence of metastatic breast cancer is a prominent factor expected to fuel demand for ESR1 mutated metastatic breast cancer diagnostic tools.
Despite progress in early detection and treatment, a subset of breast cancer cases progresses to metastatic stages. Factors such as delayed diagnosis, tumor heterogeneity, and resistance to therapies contribute to the rise in metastatic cases.
ESR1 mutations, particularly in the context of metastatic breast cancer, hold clinical significance. These mutations are associated with resistance to endocrine therapies, a standard treatment approach for hormone receptor-positive breast cancers. As a result, accurate and timely identification of ESR1 mutations is crucial for tailoring effective treatment strategies.
Robust biomarkers play a multifaceted role, serving as reliable indicators that offer insights into disease prognosis and guide treatment decisions. They facilitate patient stratification in the intricate landscape of clinical trials.
At the forefront of this endeavor is the recognition of ESR1 mutations as key biomarkers with clinical significance. These mutations are intricately linked to the hormonal landscape of breast cancer, notably influencing the response to endocrine therapies. By characterizing and validating ESR1 mutations, clinicians gain valuable information about the molecular intricacies of a patient's tumor, allowing for more informed prognostic assessments.
The screening and early detection programs create a conducive environment for the growth of the ESR1 mutated metastatic breast cancer diagnostics market. These programs foster awareness, facilitate routine screenings, and enable timely access to targeted therapies.
Growing need for minimally invasive cancer diagnostic procedures is expected to create opportunities for the target market. Subsequently, rising adoption of liquid biopsies will benefit the ESR1 mutated metastatic breast cancer diagnostics industry.
The advantages of liquid biopsies lie in their ability to offer a minimally invasive alternative to traditional tissue biopsies. They eliminate the need for invasive procedures and provide a more patient-friendly approach.
In the case of ESR1-mutant breast cancer, where disease progression and treatment response can be dynamic, the ability to conduct more frequent monitoring through liquid biopsies becomes a valuable tool in adapting treatment strategies. As a result, healthcare professionals often recommend liquid biopsies for early cancer detection.
Key players are investing rigorously in research and development to enhance the sensitivity and specificity of liquid biopsy technology. Ongoing innovations in next-generation sequencing (NGS) and other advanced molecular techniques aim to improve the ability to identify and characterize ESR1 mutations within the circulating DNA pool.
This continuous refinement is crucial for ensuring the reliability of liquid biopsy results and their utility in guiding clinical decisions.
Clinical trials represent another cornerstone of global collaboration, offering opportunities to test novel therapies and diagnostic technologies across diverse patient populations.
By pooling resources and expertise, international collaborations can accelerate the pace of clinical research, leading to more rapid advancements in targeted treatments and diagnostic tools for ESR1-mutant breast cancer.
Developing reliable methods for the early detection of ESR1 mutations holds the promise of identifying these genetic alterations at a stage where interventions can be more effective. This is particularly crucial in the context of metastatic breast cancer, where ESR1 mutations are associated with resistance to certain endocrine therapies.
The ability to pinpoint these mutations early in the disease trajectory provides a window of opportunity for healthcare providers to formulate personalized cancer treatment plans that consider the unique genetic profile of the cancer. Moreover, early detection of ESR1 mutations aligns with the paradigm of proactive and preventive healthcare.
Regular monitoring and screening for these mutations can facilitate the identification of potential genetic alterations before overt clinical symptoms manifest. Hence, more and more people opt for ESR1 mutated metastatic breast cancer diagnostic tests. This is expected to foster growth of the ESR1 mutated metastatic breast cancer testing market.
The interpretation of genetic variants, especially in the context of ESR1 mutations, introduces a layer of complexity in the landscape of cancer diagnostics and treatment decision-making. While immensely valuable, genetic information is subject to diverse interpretations, creating challenges for clinicians and researchers alike.
Variability in understanding the clinical significance of certain mutations, such as those within the ESR1 gene, can stem from evolving scientific knowledge. Similarly, differences in research findings and the lack of standardized guidelines can also contribute to this variability.
ESR1 mutations are particularly relevant in breast cancer, notably influencing responses to endocrine therapies. However, the clinical implications of specific ESR1 mutations are not universally agreed upon, leading to discrepancies in their interpretation.
Some mutations may confer resistance to certain therapies, while others might not have a discernible impact on treatment outcomes. The intricacies of these distinctions contribute to the challenges in translating genetic testing results into actionable insights for treatment decisions.
The complexity of ESR1 mutations and their role in breast cancer progression contributes to the intricacies of developing targeted therapies. While some drugs show promise in preclinical and early clinical trials, the transition to established and widely available treatments may take time.
The heterogeneity of ESR1 mutations further complicates drug development, as not all mutations may respond uniformly to the same therapeutic strategies.
The limitation in treatment options directly affects patient prognosis and overall disease management. Patients with ESR1-mutant breast cancer may face challenges in achieving optimal responses to standard therapies, potentially leading to disease progression and reduced survival rates.
The lack of specific and readily available targeted therapies may also impact the ability to tailor interventions based on the individual genetic profile of each patient, a cornerstone of precision medicine. These factors mentioned above could significantly limit the target industry's expansion.
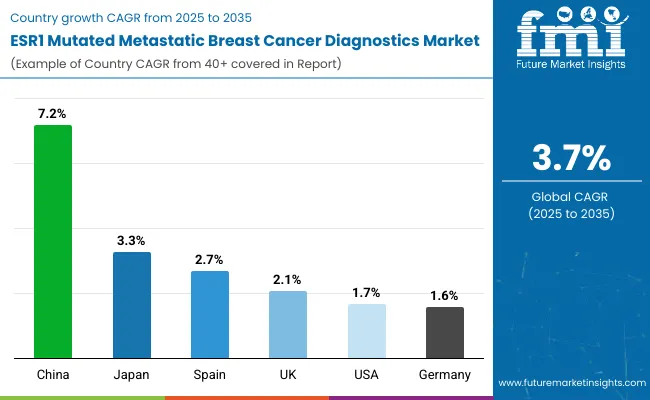
Below table shows the expected growth rates of top countries. China, Japan, and Spain are set to record higher CAGRs of 7.2%, 3.3%, and 2.7%, respectively from 2025 to 2035.
Market Growth Outlook by Key Countries

| Countries | Value CAGR |
|---|---|
| United States | 1.7% |
| Germany | 1.6% |
| United Kingdom | 2.1% |
| Japan | 3.3% |
| China | 7.2% |
| Spain | 2.7% |
The United States ESR1 mutated metastatic breast cancer diagnostics market value is estimated to total about USD 20.3 million in 2025. Over the forecast period, demand for ESR1 mutated metastatic breast cancer diagnostics demand in the United States is set to increase at 1.7% CAGR.
Several factors are anticipated to boost the growth of the ESR1 mutated metastatic breast cancer diagnostics market in the United States. These include rising cases of metastatic breast cancer, advancements in next-generation sequencing (NGS) technologies, increasing adoption of liquid biopsy techniques, particularly in cancer research institutions, growing popularity of precision medicine and targeted therapies, and the availability of advanced breast cancer mutation diagnostic tools.
The United States leads from the forefront when it comes to breast cancer diagnostics and research. It is home to several leading pharmaceutical companies, cancer research institutions, and cancer diagnostic centers.
Top players in the United States are constantly investing in developing new breast cancer diagnostic tools and treatments to reduce the overall burden. This is expected to improve the United States ESR1 mutated metastatic breast cancer diagnostics market share from 2025 to 2035.
There has also been an increasing interest in plasma-based cancer diagnostic tests due to their multiple advantages. The non-invasive nature of plasma-based diagnostics and the ability to monitor dynamic genomic profiles contribute to their prominence.
China is expected to become a highly lucrative market for manufacturers of ESR1 mutated metastatic breast cancer diagnostic kits. This is due to factors such as the rising incidence of breast cancer, growing awareness of personalized medicine, escalating emphasis on early cancer detection in China, increasing government initiatives for improving cancer control and promoting early diagnosis, and innovations in precision diagnostics for metastatic breast cancer.
China is witnessing a spike in breast cancer cases, particularly metastatic ones. This, in turn, is creating a high need for accurate and reliable diagnostic tools, thereby fostering growth of the ESR1 mutated metastatic breast cancer testing market.
The country's large and aging population, coupled with a rising incidence of breast cancer, underscores the demand for innovative diagnostic solutions. Strategic partnerships with local healthcare providers, research institutions, and regulatory compliance will be crucial for manufacturers looking to capitalize on this burgeoning market.
These factors will also contribute to improving breast cancer diagnostics and patient outcomes in China.
As per the latest analysis, China ESR1 mutated metastatic breast cancer diagnostics industry is poised to thrive at a 7.2% CAGR during the assessment period. Overall sales of ESR1 mutated metastatic breast cancer diagnostic solutions in China are estimated to total USD 5.36 million in 2025.
Spain is emerging as a promising market for ESR1 mutated metastatic breast cancer diagnostics companies. The healthcare landscape in Spain is witnessing a growing focus on precision medicine and advancements in cancer diagnostics.
With an increasing awareness of the significance of genetic profiling in breast cancer management, there is a demand for innovative diagnostic technologies. Spain's commitment to incorporating cutting-edge medical solutions into its healthcare system presents a strategic opportunity for manufacturers.
Collaborations with local healthcare providers, engagement in clinical research, and adherence to regulatory standards will be pivotal for successfully navigating and establishing a presence in this evolving market. This will contribute to enhanced diagnostic capabilities and personalized treatment approaches for metastatic breast cancer patients in Spain.

Partnerships and collaborations are a priority for leading ESR1 mutated metastatic breast cancer diagnostic kit manufacturers. They are also investing rigorously in research and development to introduce novel breast cancer diagnostic solutions.
| Attribute | Details |
|---|---|
| Current Total Market Size (2025) | USD 64.61 million |
| Projected Market Size (2035) | USD 92.92 million |
| CAGR (2025 to 2035) | 3.7% |
| Base Year for Estimation | 2024 |
| Historical Period | 2020 to 2024 |
| Projections Period | 2025 to 2035 |
| Report Parameter | USD million for value, million units for volume |
| By Test Type | NGS-Based and PCR-Based Tests |
| By Sample Type | Tissue and Plasma |
| By End User | Hospital Associated Labs, Independent Diagnostic Laboratories, Diagnostic Imaging Centers, Cancer Research Institutes |
| By Region | North America, Latin America, East Asia, South Asia & Pacific, Western Europe, Eastern Europe, Middle East & Africa |
| Countries Covered | United States, Germany, United Kingdom, Japan, China, Spain |
| Key Players | APIS Assay Technologies, Illumina, Inc., GENCURIX, RainSure Scientific, NeoGenomics Laboratories, Sysmex Corporation, ASURAGEN, INC., Guardant Health |
| Additional Attributes | Dollar sales by value, market share analysis by region, and country-wise analysis |
The market is projected to rise from USD 64.61 million in 2025 to USD 92.92 million by 2035, registering a CAGR of 3.7%.
NGS-based tests are expected to capture 64.3% of the market share in 2025 due to their ability to offer comprehensive genetic profiling and precision.
The plasma sample type is expected to witness a CAGR of 6.3% from 2025 to 2035, driven by its minimally invasive nature and ability to detect circulating tumor DNA.
Hospital-associated labs are expected to capture 52.6% of the market share in 2025, as they are equipped with advanced diagnostic tools and technologies.
China is expected to grow at a CAGR of 7.2% from 2025 to 2035, driven by increasing breast cancer incidence and government initiatives for early diagnosis.


Full Research Suite comprises of:
Market outlook & trends analysis
Interviews & case studies
Strategic recommendations
Vendor profiles & capabilities analysis
5-year forecasts
8 regions and 60+ country-level data splits
Market segment data splits
12 months of continuous data updates
DELIVERED AS:
PDF EXCEL ONLINE
DNA Diagnostics Market Growth - Trends & Forecast 2024 to 2034
HIV Diagnostics Market Overview - Trends & Forecast 2024 to 2034
Food Diagnostics Services Market Size, Growth, and Forecast for 2025–2035
Rabies Diagnostics Market Size and Share Forecast Outlook 2025 to 2035
Tissue Diagnostics Market Size and Share Forecast Outlook 2025 to 2035
Sepsis Diagnostics Market Growth - Trends & Forecast 2025 to 2035
Poultry Diagnostics Market - Demand, Growth & Forecast 2025 to 2035
Protein Diagnostics Market Share, Size and Forecast 2025 to 2035
In Vitro Diagnostics Market Insights - Trends & Forecast 2025 to 2035
Clinical Diagnostics Market Insights – Size, Share & Forecast 2025 to 2035
In-vitro Diagnostics Kit Market Growth & Forecast 2024-2034
Covid-19 Diagnostics Market – Demand, Growth & Forecast 2022-2032
In-Vitro Diagnostics Packaging Market
Connected Diagnostics Market Size and Share Forecast Outlook 2025 to 2035
Molecular Diagnostics In Pharmacogenomics Market Size and Share Forecast Outlook 2025 to 2035
Psychosis Diagnostics Market Size and Share Forecast Outlook 2025 to 2035
Pneumonia Diagnostics Market Size and Share Forecast Outlook 2025 to 2035
The Companion Diagnostics Market is segmented by product, technology, application and end user from 2025 to 2035
Bacterial Diagnostics in Aquaculture Market Insights - Growth & Forecast 2025 to 2035
Cognitive Diagnostics Market Analysis & Forecast by Diagnosis, Indication, End User and Region through 2035

Thank you!
You will receive an email from our Business Development Manager. Please be sure to check your SPAM/JUNK folder too.
Chat With
MaRIA