Aldosterone-Renin Screening Market Size & Share Forecast Outlook 2025 to 2035

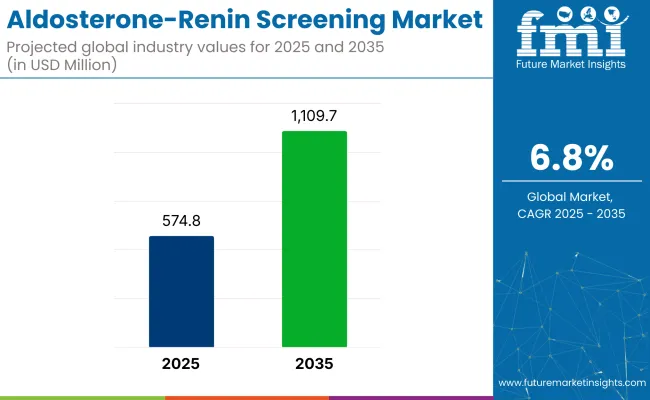
The aldosterone-renin screening market is forecasted to grow from USD 574.8 million in 2025 to USD 1,109.7 million by 2035, at a CAGR of 6.8% during the forecast period.
Aldosterone-Renin Screening Market Quick Stats

  • Market Value (2025): USD 574.8 million
  • Forecast Value (2035): USD 1,109.7 million
  • Forecast CAGR: 6.8%
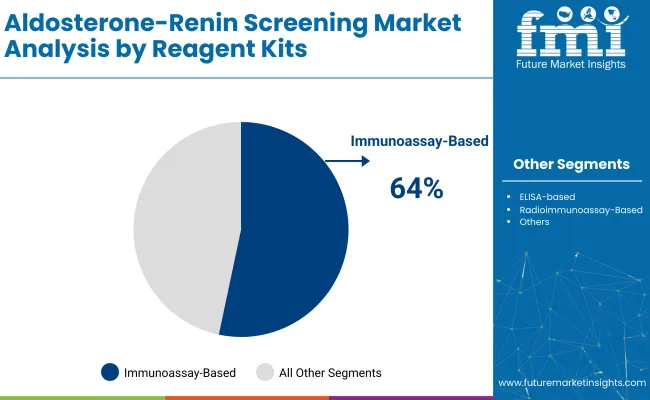
  • Leading Segment in 2025: Immunoassay-Based Kits (~64% share)
  • Key Growth Region: Asia (China)
  • Top Key Players: Thermo Fisher Scientific Inc., Enzo Biochem Inc., Wuhan Fine Biotech Co., Ltd., EagleBio, ALPCO

Aldosterone Renin Screening Market

This growth is being driven by the increasing demand for accurate diagnostic tools to detect primary aldosteronism (PA), a condition characterized by excessive aldosterone production. Clinical laboratories and healthcare facilities are expected to see growing demand for reliable screening solutions as the need for early detection of PA and related conditions rises globally.

In a Roche article titled “Improving Diagnosis of Primary Aldosteronism with Mass Spectrometry” (April 2025), a senior Roche laboratory leader stated, “The aldosterone-to-renin ratio (ARR) is the recommended biochemical screening tool. Development and improvement in the performance of aldosterone and renin determinations have permitted more reliable screening and diagnosis of PA.

Therefore, labs are turning to liquid chromatography-tandem mass spectrometry (LCMS/MS) in first-line testing. This technology has the potential to improve diagnostic accuracy for PA.” This reflects how mass spectrometry is being used to enhance the diagnostic accuracy of PA, which in turn is shaping market growth.

With growing regulatory pressures to improve the accuracy and reliability of diagnostic tools, increasing investments in liquid chromatography-tandem mass spectrometry (LC-MS/MS) and advanced immunoassay kits are expected to drive market expansion. Automation is also being integrated into laboratory workflows, increasing efficiency and accuracy. As diagnostic accuracy improves, the demand for aldosterone-renin screening is expected to continue rising through 2035, with Asia (particularly China) being recognized as a key growth region.

Analyzing Aldosterone-Renin Screening Market by top investment segments

The market is segmented by reagent kits, indication, sample type, end-user, and region. Reagent kits include immunoassay-based kits, ELISA-based kits, radioimmunoassay-based kits, aldosterone-to-renin ratio (ARR) panels, and LC-MS/MS-based assays. In terms of indication, the market covers primary aldosteronism (PA), resistant hypertension, secondary hypertension, adrenal adenoma, and others.

The sample segment includes plasma, serum, whole blood, urine, and other samples. End-users of the market are hospitals, pathology laboratories, endocrinology clinics, cardiology clinics, and diagnostic kit manufacturers/CROs. Geographically, the market spans North America, Western Europe, East Asia, and South Asia.

Immunoassay-Based Kits Lead Reagent Kits Segment in 2025

Immunoassay-based kits are projected to capture 64% of the aldosterone-renin screening market in 2025. These kits are preferred for their high sensitivity, ease of use, and accuracy in diagnosing primary aldosteronism and other endocrine disorders.
  • Companies like Abbott Laboratories, Siemens Healthineers, and Roche are leading the production of these reagent kits, integrating advanced technologies to enhance performance.
  • Immunoassays offer the ability to detect aldosterone and renin levels in plasma or urine samples quickly and accurately, making them essential in diagnosing conditions like hypertension and heart failure. These kits are becoming standard in clinical and research settings.

Aldosterone Renin Screening Market Analysis By Reagent Kits

Plasma Samples to Hold 51.9% of Sample Segment in 2025

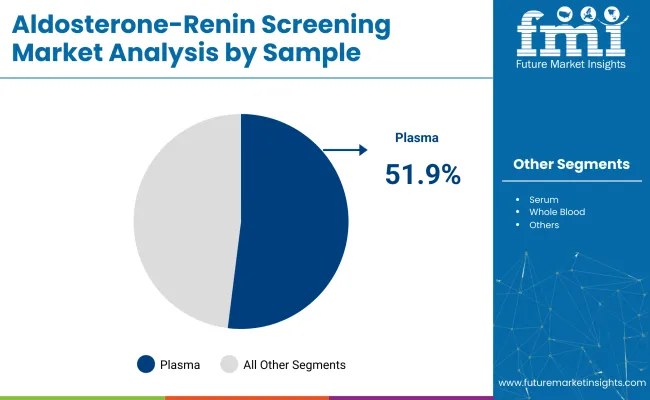
Plasma samples are projected to account for 51.9% of the aldosterone-renin screening market sample segment by 2025. Plasma is considered the preferred sample type for analyzing aldosterone and renin levels due to its stability, ease of collection, and the ability to obtain reliable results.
  • Many diagnostic companies, such as Bio-Rad Laboratories and Beckman Coulter, have developed specific assays for plasma samples. These assays have been optimized to provide high accuracy and reproducibility, especially in detecting primary aldosteronism (PA) and assessing the functionality of the adrenal glands.
  • Plasma samples are critical in ensuring optimal diagnostic accuracy for various conditions.

Aldosterone Renin Screening Market Analysis By Sample

Primary Aldosteronism (PA) to Dominate Indication Segment

Primary aldosteronism (PA) is expected to capture 32% of the aldosterone-renin screening market share in 2025. PA is a key indication in the aldosterone-renin screening market due to its association with hypertension, electrolyte imbalances, and cardiovascular diseases.

  • Diagnostic companies are increasingly focusing on developing specialized tests for PA to ensure early and accurate diagnosis. This condition is being recognized as a major contributor to secondary hypertension, which is driving demand for improved screening methods.
  • Companies such as Thermo Fisher Scientific and PerkinElmer are offering targeted screening solutions for PA, strengthening their presence in the market and advancing precision medicine in hypertension management.

Diagnostic Kit Manufacturers/CROs to Lead End-User Segment

Diagnostic kit manufacturers and contract research organizations (CROs) are expected to capture 35% of the aldosterone-renin screening market share by 2025. This segment is driven by the increasing demand for high-quality diagnostic kits and research-driven solutions for adrenal gland disorders.

  • Key players like Beckman Coulter and Labcorp are working closely with hospitals, research institutions, and pharmaceutical companies to develop more efficient and accurate aldosterone-renin screening kits.
  • As the prevalence of adrenal disorders rises, CROs are contributing to the growth of this segment by providing testing services, improving diagnostic methods, and supporting clinical trials that enhance the screening process.

Top Aldosterone-Renin Screening Market Dynamics

The aldosterone-renin screening market is being driven by increased recognition of primary aldosteronism and advancements in diagnostics. However, challenges such as diagnostic variability and equipment requirements are limiting widespread adoption.

Increasing recognition of primary aldosteronism as a significant cause of secondary hypertension is driving market growth

The recognition of primary aldosteronism as a prevalent cause of secondary hypertension is being significantly boosted. This condition is associated with increased risks of cardiovascular diseases, stroke, and kidney failure. As a result, aldosterone-renin screening is being prioritized for early detection, with the aldosterone-renin ratio (ARR) test considered the most reliable method.

Clinical guidelines are being updated to emphasize the importance of ARR testing, leading to higher screening rates. Physician awareness is also being enhanced, which is contributing to the growth of the aldosterone-renin screening market.

Variability in diagnostic protocols and the need for specialized equipment are limiting market growth

Despite the growing demand, challenges related to variability in diagnostic protocols and the need for specialized equipment are being faced by the aldosterone-renin screening market. Factors such as patient preparation and timing of blood collection are being identified as variables that influence test results, leading to inconsistencies.

The necessity for specialized equipment and trained personnel to perform the tests is limiting accessibility, particularly in resource-constrained environments. These barriers are restricting the widespread adoption of aldosterone-renin screening and may hinder market growth.
Analyzing Top Countries Manufacturing, Distributing, and Supplying Aldosterone-Renin Screening Solutions

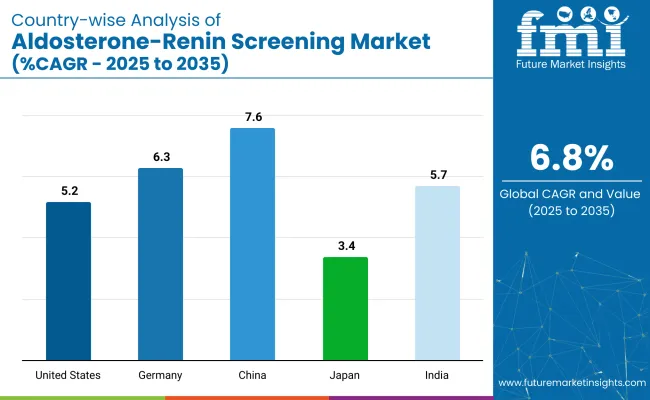
Country Wise Analysis Of Aldosterone Renin Screening Market

The aldosterone-renin screening market is expected to experience steady growth through 2035. Growth is driven by advancements in diagnostic technologies and increasing awareness of diseases related to aldosterone and renin imbalances. Rapid market expansion is being observed in China and India, while technological innovations and healthcare advancements are being focused on in developed markets such as the U.S. and Germany.

Countries Estimated CAGR (%)
United States 5.2%
Germany 6.3%
China 7.6%
Japan 3.4%
India 5.7%

In-depth Analysis of United States Aldosterone-Renin Screening Market

The United States aldosterone-renin screening market is expected to grow at a CAGR of 5.2% through 2035. The demand for aldosterone-renin screening solutions is being driven by advancements in diagnostic testing and increased awareness of aldosterone-renin imbalances.

  • Companies such as Siemens Healthineers, Abbott, and Roche are investing in the development of innovative solutions. Government regulations promoting healthcare access and funding for medical research are being implemented, further supporting market growth.
  • The demand for early diagnosis and personalized treatments is being fueled by the growing prevalence of hyperaldosteronism. Technological innovations in diagnostic devices are expected to drive market growth.

Demand Outlook for Aldosterone-Renin Screening Market in Germany

The Germany aldosterone-renin screening market is projected to grow at a CAGR of 6.3% through 2035. The market is being supported by the increasing demand for accurate diagnostic solutions and the growing focus on personalized medicine.

  • Companies like Siemens Healthineers and Roche are developing new technologies to improve the accuracy of aldosterone-renin screening.
  • Government policies supporting pharmaceutical research and quality standards are being enforced. Germany’s robust healthcare infrastructure and the adoption of advanced diagnostic systems are contributing to the market’s growth.
  • The rising prevalence of endocrine disorders is further fueling demand for effective screening solutions.

Aldosterone-Renin Screening Market Forecast in China

China’s aldosterone-renin screening market is expected to grow at a CAGR of 7.6% through 2035. Expansion is being driven by rapid industrialization, increasing healthcare awareness, and government initiatives to improve diagnostic capabilities.

  • Leading companies like Abbott and Roche are investing heavily in diagnostic technologies for aldosterone-renin screening.
  • Government policies are being implemented to improve pharmaceutical safety and packaging standards, contributing to market growth. The growing prevalence of hypertension and endocrine diseases is further supporting the demand for screening solutions.
  • The rapid development of healthcare infrastructure and technology is accelerating the adoption of these solutions in China.

Japan Aldosterone-Renin Screening Market Analysis

Japan’s aldosterone-renin screening market is projected to grow at a CAGR of 3.4% through 2035. The market is being supported by Japan’s advanced healthcare system, which emphasizes drug safety and diagnostic precision.

  • Companies like Toshiba and Roche are leading the development of high-quality screening tests. Government regulations mandating high-quality packaging and increasing pharmaceutical safety are contributing to the market’s growth.
  • Japan’s aging population and increasing prevalence of hypertension are driving demand for effective screening solutions.
  • The adoption of innovations in diagnostic methods and technologies is being prioritized, ensuring steady market growth.

Detailed Study of India Aldosterone-Renin Screening Market

Aldosterone-renin screening market in India is expected to grow at a CAGR of 5.7% through 2035. Growth is being driven by increasing health awareness, government initiatives promoting medical infrastructure, and rising incidences of hypertension and endocrine disorders.

Domestic and international companies like Abbott and Roche are focusing on introducing affordable and effective screening solutions. The government’s push for improving healthcare access and boosting the pharmaceutical industry’s global competitiveness is further driving market growth. The rising demand for pharmaceutical exports is also accelerating the adoption of effective aldosterone-renin screening solutions in India.

Leading Suppliers in the Aldosterone-Renin Screening Market

The aldosterone-renin screening market is characterized by a diverse range of suppliers. Key players like Quest Diagnostics, Labcorp, and ARUP Laboratories dominate the market due to their extensive product portfolios, technological advancements, and strong global presence in the laboratory testing sector.

Comprehensive testing services for primary aldosteronism, including aldosterone and renin assays, are offered by these companies, and automated solutions for determining the aldosterone-to-renin ratio (ARR) are provided. Tier 2 players, such as Diasorin and Mindray, focus on innovative solutions, while Tier 3 players target regional markets with cost-effective and niche product offerings.

Recent Aldosterone-Renin Screening Industry News

  • In May 2025, an enhanced primary aldosteronism test measuring plasma renin activity was introduced by Quest Diagnostics to screen for primary aldosteronism. The test is designed to be more accessible and efficient for patients and healthcare providers.
  • In June 2024, a new aldosterone-renin ratio blood test was launched by Labcorp utilizing liquid chromatography-mass spectrometry/mass spectrometry (LC-MS/MS) technology, improving the accuracy and reliability of primary aldosteronism diagnosis.
  • In July 2023, approval was received by ARUP Laboratories from the New York State Department of Health for its aldosterone-renin ratio test, expanding its service offerings. These advancements highlight ongoing progress in diagnostic technologies and the growing accessibility of aldosterone-renin screening tests.

Key Players in the Aldosterone-Renin Screening Market

  • Thermo Fisher Scientific Inc.
  • Enzo Biochem Inc.
  • Wuhan Fine Biotech Co., Ltd.
  • EagleBio
  • ALPCO
  • Bio-Techne
  • Immunodiagnostic Systems
  • Revvity
  • Gold Standard Diagnostics

Research Coverage and Scope Summary

Report Attributes Details
Current Total Market Size (2025) USD 574.8 million
Projected Market Size (2035) USD 1,109.7 million
CAGR (2025 to 2035) 6.8%
Base Year for Estimation 2024
Historical Period 2020 to 2024
Projections Period 2025 to 2035
Quantitative Units USD billion for value and Number of Tests/Units for volume
Reagent Kits Analyzed (Segment 1) Immunoassay-based kits; ELISA-based kits; Radioimmunoassay-based kits; Aldosterone-to-renin ratio (ARR) panels; LC-MS/MS-based assays
Indications Covered (Segment 2) Primary aldosteronism (PA); Resistant hypertension; Secondary hypertension; Adrenal adenoma; Others
Sample Types Covered (Segment 3) Plasma; Serum; Whole blood; Urine; Others
End-User Segments Covered (Segment 4) Hospitals; Pathology laboratories; Endocrinology clinics; Cardiology clinics; Diagnostic kit manufacturers/CROs
Regions Covered North America, Western Europe, East Asia, South Asia
Countries Covered North America: United States; Canada Western Europe: United Kingdom; Germany; France; Italy; Spain East Asia: China; Japan; South Korea South Asia: India; Pakistan; Bangladesh
Key Players Influencing the Market Thermo Fisher Scientific Inc.; Enzo Biochem Inc.; Wuhan Fine Biotech Co., Ltd.; EagleBio; ALPCO; Bio- Techne; Immunodiagnostic Systems; Revvity; Gold Standard Diagnostics
Additional Attributes Dollar sales by reagent kit type (immunoassay, ELISA, ARR panels, LC-MS/MS); Market growth in primary aldosteronism vs resistant hypertension; Regional adoption rates of screening tests; Advances in diagnostic technology and automation

Key Segments

By Reagent Kits:

The market is segmented into immunoassay-based kits, ELISA-based kits, radioimmunoassay-based kits, aldosterone-to-renin ratio (ARR) panels, and LC–MS/MS-based assays.

By Indication:

The market covers primary aldosteronism (PA), resistant hypertension, secondary hypertension, adrenal adenoma, and others.

By Sample:

The market includes plasma, serum, whole blood, urine, and others.

By End-User:

The market is categorized into hospitals, pathology laboratories, endocrinology clinics, cardiology clinics, and diagnostic kit manufacturers/CROs.

By Region:

The market spans North America, Western Europe, East Asia, and South Asia.

Table of Content

  1. Executive Summary
  2. Market Overview
  3. Market Background
  4. Global Market Analysis 2020 to 2024 and Forecast, 2025 to 2035
  5. Global Market Pricing Analysis 2020 to 2024 and Forecast 2025 to 2035
  6. Global Market Analysis 2020 to 2024 and Forecast 2025 to 2035, By Reagent Kits
    • Immunoassay-Based Kits
    • ELISA based Kits
    • Radioimmunoassay Based Kits
    • Aldosterone-to-Renin Ratio (ARR) Panels
    • LC–MS/MS-Based Assays
  7. Global Market Analysis 2020 to 2024 and Forecast 2025 to 2035, By Indication
    • Primary Aldosteronism (PA)
    • Resistant Hypertension
    • Secondary Hypertension
    • Adrenal Adenoma
    • Others
  8. Global Market Analysis 2020 to 2024 and Forecast 2025 to 2035, By Sample
    • Plasma
    • Serum
    • Whole Blood
    • Urine
  9. Global Market Analysis 2020 to 2024 and Forecast 2025 to 2035, By End User
    • Hospitals
    • Pathology Laboratories
    • Endocrinology Clinics
    • Cardiology Clinics
    • Diagnostic Kit Manufacturers/CRO
  10. Global Market Analysis 2020 to 2024 and Forecast 2025 to 2035, By Region
    • North America
    • Latin America
    • Western Europe
    • Eastern Europe
    • East Asia
    • South Asia & Pacific
    • Middle East and Africa
  11. North America Market Analysis 2020 to 2024 and Forecast 2025 to 2035, By Country
  12. Latin America Market Analysis 2020 to 2024 and Forecast 2025 to 2035, By Country
  13. Western Europe Market Analysis 2020 to 2024 and Forecast 2025 to 2035, By Country
  14. Eastern Europe Market Analysis 2020 to 2024 and Forecast 2025 to 2035, By Country
  15. East Asia Market Analysis 2020 to 2024 and Forecast 2025 to 2035, By Country
  16. South Asia & Pacific Market Analysis 2020 to 2024 and Forecast 2025 to 2035, By Country
  17. Middle East and Africa Market Analysis 2020 to 2024 and Forecast 2025 to 2035, By Country
  18. Competition Analysis
    • Thermo Fisher Scientific Inc.
    • Enzo Biochem Inc.
    • Wuhan Fine Biotech Co., Ltd.
    • EagleBio
    • ALPCO
    • Bio-Techne
    • Immunodiagnostic Systems
    • Revvity
    • Gold Standard Diagnostics
  19. Assumptions & Acronyms Used
  20. Research Methodology

List of Tables

  • Table 1: Global Market Value (USD Billion) Forecast by Region, 2020 to 2035
  • Table 2: Global Market Volume (Number of Tests) Forecast by Region, 2020 to 2035
  • Table 3: Global Market Value (USD Billion) Forecast by Reagent Kits, 2020 to 2035
  • Table 4: Global Market Volume (Number of Tests) Forecast by Reagent Kits, 2020 to 2035
  • Table 5: Global Market Value (USD Billion) Forecast by Indication, 2020 to 2035
  • Table 6: Global Market Volume (Number of Tests) Forecast by Indication, 2020 to 2035
  • Table 7: Global Market Value (USD Billion) Forecast by Sample, 2020 to 2035
  • Table 8: Global Market Volume (Number of Tests) Forecast by Sample, 2020 to 2035
  • Table 9: Global Market Value (USD Billion) Forecast by End User, 2020 to 2035
  • Table 10: Global Market Volume (Number of Tests) Forecast by End User, 2020 to 2035
  • Table 11: North America Market Value (USD Billion) Forecast by Country, 2020 to 2035
  • Table 12: North America Market Volume (Number of Tests) Forecast by Country, 2020 to 2035
  • Table 13: North America Market Value (USD Billion) Forecast by Reagent Kits, 2020 to 2035
  • Table 14: North America Market Volume (Number of Tests) Forecast by Reagent Kits, 2020 to 2035
  • Table 15: North America Market Value (USD Billion) Forecast by Indication, 2020 to 2035
  • Table 16: North America Market Volume (Number of Tests) Forecast by Indication, 2020 to 2035
  • Table 17: North America Market Value (USD Billion) Forecast by Sample, 2020 to 2035
  • Table 18: North America Market Volume (Number of Tests) Forecast by Sample, 2020 to 2035
  • Table 19: North America Market Value (USD Billion) Forecast by End User, 2020 to 2035
  • Table 20: North America Market Volume (Number of Tests) Forecast by End User, 2020 to 2035
  • Table 21: Latin America Market Value (USD Billion) Forecast by Country, 2020 to 2035
  • Table 22: Latin America Market Volume (Number of Tests) Forecast by Country, 2020 to 2035
  • Table 23: Latin America Market Value (USD Billion) Forecast by Reagent Kits, 2020 to 2035
  • Table 24: Latin America Market Volume (Number of Tests) Forecast by Reagent Kits, 2020 to 2035
  • Table 25: Latin America Market Value (USD Billion) Forecast by Indication, 2020 to 2035
  • Table 26: Latin America Market Volume (Number of Tests) Forecast by Indication, 2020 to 2035
  • Table 27: Latin America Market Value (USD Billion) Forecast by Sample, 2020 to 2035
  • Table 28: Latin America Market Volume (Number of Tests) Forecast by Sample, 2020 to 2035
  • Table 29: Latin America Market Value (USD Billion) Forecast by End User, 2020 to 2035
  • Table 30: Latin America Market Volume (Number of Tests) Forecast by End User, 2020 to 2035
  • Table 31: Western Europe Market Value (USD Billion) Forecast by Country, 2020 to 2035
  • Table 32: Western Europe Market Volume (Number of Tests) Forecast by Country, 2020 to 2035
  • Table 33: Western Europe Market Value (USD Billion) Forecast by Reagent Kits, 2020 to 2035
  • Table 34: Western Europe Market Volume (Number of Tests) Forecast by Reagent Kits, 2020 to 2035
  • Table 35: Western Europe Market Value (USD Billion) Forecast by Indication, 2020 to 2035
  • Table 36: Western Europe Market Volume (Number of Tests) Forecast by Indication, 2020 to 2035
  • Table 37: Western Europe Market Value (USD Billion) Forecast by Sample, 2020 to 2035
  • Table 38: Western Europe Market Volume (Number of Tests) Forecast by Sample, 2020 to 2035
  • Table 39: Western Europe Market Value (USD Billion) Forecast by End User, 2020 to 2035
  • Table 40: Western Europe Market Volume (Number of Tests) Forecast by End User, 2020 to 2035
  • Table 41: Eastern Europe Market Value (USD Billion) Forecast by Country, 2020 to 2035
  • Table 42: Eastern Europe Market Volume (Number of Tests) Forecast by Country, 2020 to 2035
  • Table 43: Eastern Europe Market Value (USD Billion) Forecast by Reagent Kits, 2020 to 2035
  • Table 44: Eastern Europe Market Volume (Number of Tests) Forecast by Reagent Kits, 2020 to 2035
  • Table 45: Eastern Europe Market Value (USD Billion) Forecast by Indication, 2020 to 2035
  • Table 46: Eastern Europe Market Volume (Number of Tests) Forecast by Indication, 2020 to 2035
  • Table 47: Eastern Europe Market Value (USD Billion) Forecast by Sample, 2020 to 2035
  • Table 48: Eastern Europe Market Volume (Number of Tests) Forecast by Sample, 2020 to 2035
  • Table 49: Eastern Europe Market Value (USD Billion) Forecast by End User, 2020 to 2035
  • Table 50: Eastern Europe Market Volume (Number of Tests) Forecast by End User, 2020 to 2035
  • Table 51: East Asia Market Value (USD Billion) Forecast by Country, 2020 to 2035
  • Table 52: East Asia Market Volume (Number of Tests) Forecast by Country, 2020 to 2035
  • Table 53: East Asia Market Value (USD Billion) Forecast by Reagent Kits, 2020 to 2035
  • Table 54: East Asia Market Volume (Number of Tests) Forecast by Reagent Kits, 2020 to 2035
  • Table 55: East Asia Market Value (USD Billion) Forecast by Indication, 2020 to 2035
  • Table 56: East Asia Market Volume (Number of Tests) Forecast by Indication, 2020 to 2035
  • Table 57: East Asia Market Value (USD Billion) Forecast by Sample, 2020 to 2035
  • Table 58: East Asia Market Volume (Number of Tests) Forecast by Sample, 2020 to 2035
  • Table 59: East Asia Market Value (USD Billion) Forecast by End User, 2020 to 2035
  • Table 60: East Asia Market Volume (Number of Tests) Forecast by End User, 2020 to 2035
  • Table 61: South Asia & Pacific Market Value (USD Billion) Forecast by Country, 2020 to 2035
  • Table 62: South Asia & Pacific Market Volume (Number of Tests) Forecast by Country, 2020 to 2035
  • Table 63: South Asia & Pacific Market Value (USD Billion) Forecast by Reagent Kits, 2020 to 2035
  • Table 64: South Asia & Pacific Market Volume (Number of Tests) Forecast by Reagent Kits, 2020 to 2035
  • Table 65: South Asia & Pacific Market Value (USD Billion) Forecast by Indication, 2020 to 2035
  • Table 66: South Asia & Pacific Market Volume (Number of Tests) Forecast by Indication, 2020 to 2035
  • Table 67: South Asia & Pacific Market Value (USD Billion) Forecast by Sample, 2020 to 2035
  • Table 68: South Asia & Pacific Market Volume (Number of Tests) Forecast by Sample, 2020 to 2035
  • Table 69: South Asia & Pacific Market Value (USD Billion) Forecast by End User, 2020 to 2035
  • Table 70: South Asia & Pacific Market Volume (Number of Tests) Forecast by End User, 2020 to 2035
  • Table 71: Middle East and Africa Market Value (USD Billion) Forecast by Country, 2020 to 2035
  • Table 72: Middle East and Africa Market Volume (Number of Tests) Forecast by Country, 2020 to 2035
  • Table 73: Middle East and Africa Market Value (USD Billion) Forecast by Reagent Kits, 2020 to 2035
  • Table 74: Middle East and Africa Market Volume (Number of Tests) Forecast by Reagent Kits, 2020 to 2035
  • Table 75: Middle East and Africa Market Value (USD Billion) Forecast by Indication, 2020 to 2035
  • Table 76: Middle East and Africa Market Volume (Number of Tests) Forecast by Indication, 2020 to 2035
  • Table 77: Middle East and Africa Market Value (USD Billion) Forecast by Sample, 2020 to 2035
  • Table 78: Middle East and Africa Market Volume (Number of Tests) Forecast by Sample, 2020 to 2035
  • Table 79: Middle East and Africa Market Value (USD Billion) Forecast by End User, 2020 to 2035
  • Table 80: Middle East and Africa Market Volume (Number of Tests) Forecast by End User, 2020 to 2035

List of Figures

  • Figure 1: Global Market Volume (Number of Tests) Forecast 2020 to 2035
  • Figure 2: Global Market Pricing Analysis
  • Figure 3: Global Market Value (USD Billion) Forecast 2020 to 2035
  • Figure 4: Global Market Value Share and BPS Analysis by Reagent Kits, 2025 and 2035
  • Figure 5: Global Market Y-o-Y Growth Comparison by Reagent Kits, 2025 to 2035
  • Figure 6: Global Market Attractiveness Analysis by Reagent Kits
  • Figure 7: Global Market Value Share and BPS Analysis by Indication, 2025 and 2035
  • Figure 8: Global Market Y-o-Y Growth Comparison by Indication, 2025 to 2035
  • Figure 9: Global Market Attractiveness Analysis by Indication
  • Figure 10: Global Market Value Share and BPS Analysis by Sample, 2025 and 2035
  • Figure 11: Global Market Y-o-Y Growth Comparison by Sample, 2025 to 2035
  • Figure 12: Global Market Attractiveness Analysis by Sample
  • Figure 13: Global Market Value Share and BPS Analysis by End User, 2025 and 2035
  • Figure 14: Global Market Y-o-Y Growth Comparison by End User, 2025 to 2035
  • Figure 15: Global Market Attractiveness Analysis by End User
  • Figure 16: Global Market Value (USD Billion) Share and BPS Analysis by Region, 2025 and 2035
  • Figure 17: Global Market Y-o-Y Growth Comparison by Region, 2025 to 2035
  • Figure 18: Global Market Attractiveness Analysis by Region
  • Figure 19: North America Market Incremental $ Opportunity, 2025 to 2035
  • Figure 20: Latin America Market Incremental $ Opportunity, 2025 to 2035
  • Figure 21: Western Europe Market Incremental $ Opportunity, 2025 to 2035
  • Figure 22: Eastern Europe Market Incremental $ Opportunity, 2025 to 2035
  • Figure 23: East Asia Market Incremental $ Opportunity, 2025 to 2035
  • Figure 24: South Asia & Pacific Market Incremental $ Opportunity, 2025 to 2035
  • Figure 25: Middle East and Africa Market Incremental $ Opportunity, 2025 to 2035
  • Figure 26: North America Market Value Share and BPS Analysis by Country, 2025 and 2035
  • Figure 27: North America Market Value Share and BPS Analysis by Reagent Kits, 2025 and 2035
  • Figure 28: North America Market Y-o-Y Growth Comparison by Reagent Kits, 2025 to 2035
  • Figure 29: North America Market Attractiveness Analysis by Reagent Kits
  • Figure 30: North America Market Value Share and BPS Analysis by Indication, 2025 and 2035
  • Figure 31: North America Market Y-o-Y Growth Comparison by Indication, 2025 to 2035
  • Figure 32: North America Market Attractiveness Analysis by Indication
  • Figure 33: North America Market Value Share and BPS Analysis by Sample, 2025 and 2035
  • Figure 34: North America Market Y-o-Y Growth Comparison by Sample, 2025 to 2035
  • Figure 35: North America Market Attractiveness Analysis by Sample
  • Figure 36: North America Market Value Share and BPS Analysis by End User, 2025 and 2035
  • Figure 37: North America Market Y-o-Y Growth Comparison by End User, 2025 to 2035
  • Figure 38: North America Market Attractiveness Analysis by End User
  • Figure 39: Latin America Market Value Share and BPS Analysis by Country, 2025 and 2035
  • Figure 40: Latin America Market Value Share and BPS Analysis by Reagent Kits, 2025 and 2035
  • Figure 41: Latin America Market Y-o-Y Growth Comparison by Reagent Kits, 2025 to 2035
  • Figure 42: Latin America Market Attractiveness Analysis by Reagent Kits
  • Figure 43: Latin America Market Value Share and BPS Analysis by Indication, 2025 and 2035
  • Figure 44: Latin America Market Y-o-Y Growth Comparison by Indication, 2025 to 2035
  • Figure 45: Latin America Market Attractiveness Analysis by Indication
  • Figure 46: Latin America Market Value Share and BPS Analysis by Sample, 2025 and 2035
  • Figure 47: Latin America Market Y-o-Y Growth Comparison by Sample, 2025 to 2035
  • Figure 48: Latin America Market Attractiveness Analysis by Sample
  • Figure 49: Latin America Market Value Share and BPS Analysis by End User, 2025 and 2035
  • Figure 50: Latin America Market Y-o-Y Growth Comparison by End User, 2025 to 2035
  • Figure 51: Latin America Market Attractiveness Analysis by End User
  • Figure 52: Western Europe Market Value Share and BPS Analysis by Country, 2025 and 2035
  • Figure 53: Western Europe Market Value Share and BPS Analysis by Reagent Kits, 2025 and 2035
  • Figure 54: Western Europe Market Y-o-Y Growth Comparison by Reagent Kits, 2025 to 2035
  • Figure 55: Western Europe Market Attractiveness Analysis by Reagent Kits
  • Figure 56: Western Europe Market Value Share and BPS Analysis by Indication, 2025 and 2035
  • Figure 57: Western Europe Market Y-o-Y Growth Comparison by Indication, 2025 to 2035
  • Figure 58: Western Europe Market Attractiveness Analysis by Indication
  • Figure 59: Western Europe Market Value Share and BPS Analysis by Sample, 2025 and 2035
  • Figure 60: Western Europe Market Y-o-Y Growth Comparison by Sample, 2025 to 2035
  • Figure 61: Western Europe Market Attractiveness Analysis by Sample
  • Figure 62: Western Europe Market Value Share and BPS Analysis by End User, 2025 and 2035
  • Figure 63: Western Europe Market Y-o-Y Growth Comparison by End User, 2025 to 2035
  • Figure 64: Western Europe Market Attractiveness Analysis by End User
  • Figure 65: Eastern Europe Market Value Share and BPS Analysis by Country, 2025 and 2035
  • Figure 66: Eastern Europe Market Value Share and BPS Analysis by Reagent Kits, 2025 and 2035
  • Figure 67: Eastern Europe Market Y-o-Y Growth Comparison by Reagent Kits, 2025 to 2035
  • Figure 68: Eastern Europe Market Attractiveness Analysis by Reagent Kits
  • Figure 69: Eastern Europe Market Value Share and BPS Analysis by Indication, 2025 and 2035
  • Figure 70: Eastern Europe Market Y-o-Y Growth Comparison by Indication, 2025 to 2035
  • Figure 71: Eastern Europe Market Attractiveness Analysis by Indication
  • Figure 72: Eastern Europe Market Value Share and BPS Analysis by Sample, 2025 and 2035
  • Figure 73: Eastern Europe Market Y-o-Y Growth Comparison by Sample, 2025 to 2035
  • Figure 74: Eastern Europe Market Attractiveness Analysis by Sample
  • Figure 75: Eastern Europe Market Value Share and BPS Analysis by End User, 2025 and 2035
  • Figure 76: Eastern Europe Market Y-o-Y Growth Comparison by End User, 2025 to 2035
  • Figure 77: Eastern Europe Market Attractiveness Analysis by End User
  • Figure 78: East Asia Market Value Share and BPS Analysis by Country, 2025 and 2035
  • Figure 79: East Asia Market Value Share and BPS Analysis by Reagent Kits, 2025 and 2035
  • Figure 80: East Asia Market Y-o-Y Growth Comparison by Reagent Kits, 2025 to 2035
  • Figure 81: East Asia Market Attractiveness Analysis by Reagent Kits
  • Figure 82: East Asia Market Value Share and BPS Analysis by Indication, 2025 and 2035
  • Figure 83: East Asia Market Y-o-Y Growth Comparison by Indication, 2025 to 2035
  • Figure 84: East Asia Market Attractiveness Analysis by Indication
  • Figure 85: East Asia Market Value Share and BPS Analysis by Sample, 2025 and 2035
  • Figure 86: East Asia Market Y-o-Y Growth Comparison by Sample, 2025 to 2035
  • Figure 87: East Asia Market Attractiveness Analysis by Sample
  • Figure 88: East Asia Market Value Share and BPS Analysis by End User, 2025 and 2035
  • Figure 89: East Asia Market Y-o-Y Growth Comparison by End User, 2025 to 2035
  • Figure 90: East Asia Market Attractiveness Analysis by End User
  • Figure 91: South Asia & Pacific Market Value Share and BPS Analysis by Country, 2025 and 2035
  • Figure 92: South Asia & Pacific Market Value Share and BPS Analysis by Reagent Kits, 2025 and 2035
  • Figure 93: South Asia & Pacific Market Y-o-Y Growth Comparison by Reagent Kits, 2025 to 2035
  • Figure 94: South Asia & Pacific Market Attractiveness Analysis by Reagent Kits
  • Figure 95: South Asia & Pacific Market Value Share and BPS Analysis by Indication, 2025 and 2035
  • Figure 96: South Asia & Pacific Market Y-o-Y Growth Comparison by Indication, 2025 to 2035
  • Figure 97: South Asia & Pacific Market Attractiveness Analysis by Indication
  • Figure 98: South Asia & Pacific Market Value Share and BPS Analysis by Sample, 2025 and 2035
  • Figure 99: South Asia & Pacific Market Y-o-Y Growth Comparison by Sample, 2025 to 2035
  • Figure 100: South Asia & Pacific Market Attractiveness Analysis by Sample
  • Figure 101: South Asia & Pacific Market Value Share and BPS Analysis by End User, 2025 and 2035
  • Figure 102: South Asia & Pacific Market Y-o-Y Growth Comparison by End User, 2025 to 2035
  • Figure 103: South Asia & Pacific Market Attractiveness Analysis by End User
  • Figure 104: Middle East and Africa Market Value Share and BPS Analysis by Country, 2025 and 2035
  • Figure 105: Middle East and Africa Market Value Share and BPS Analysis by Reagent Kits, 2025 and 2035
  • Figure 106: Middle East and Africa Market Y-o-Y Growth Comparison by Reagent Kits, 2025 to 2035
  • Figure 107: Middle East and Africa Market Attractiveness Analysis by Reagent Kits
  • Figure 108: Middle East and Africa Market Value Share and BPS Analysis by Indication, 2025 and 2035
  • Figure 109: Middle East and Africa Market Y-o-Y Growth Comparison by Indication, 2025 to 2035
  • Figure 110: Middle East and Africa Market Attractiveness Analysis by Indication
  • Figure 111: Middle East and Africa Market Value Share and BPS Analysis by Sample, 2025 and 2035
  • Figure 112: Middle East and Africa Market Y-o-Y Growth Comparison by Sample, 2025 to 2035
  • Figure 113: Middle East and Africa Market Attractiveness Analysis by Sample
  • Figure 114: Middle East and Africa Market Value Share and BPS Analysis by End User, 2025 and 2035
  • Figure 115: Middle East and Africa Market Y-o-Y Growth Comparison by End User, 2025 to 2035
  • Figure 116: Middle East and Africa Market Attractiveness Analysis by End User
  • Figure 117: Global Market - Tier Structure Analysis
  • Figure 118: Global Market - Company Share Analysis

Frequently Asked Questions

What is the projected market value of the aldosterone-renin screening market in 2025?

It is expected to be valued at USD 574.8 million in 2025.

What is the estimated CAGR of the aldosterone-renin screening market from 2025 to 2035?

It is projected to grow at a CAGR of 6.8% from 2025 to 2035.

Which reagent kit segment leads the aldosterone-renin screening market in 2025?

Immunoassay-based reagent kits will lead with a 64% share in 2025.

Which sample type will dominate the aldosterone-renin screening market by 2025?

Plasma samples are expected to hold a 51.9% share in 2025.

Which region is expected to see the highest growth in the aldosterone-renin screening market?

Asia, particularly China, is expected to be the key growth region.

Explore In-vitro Diagnostics Devices Insights

Future Market Insights

Aldosterone-Renin Screening Market