Reports

- Global Locations -

Headquarters

Future Market Insights, Inc.

Christiana Corporate, 200
Continental Drive, Suite 401,
Newark, Delaware - 19713,
United States

T: +1-845-579-5705

Americas

Future Market Insights, Inc.

616 Corporate Way, Suite 2-9018,
Valley Cottage, NY 10989, United States

T: +1-347-918-3531

MEA

Future Market Insights

1602-6 Jumeirah Bay X2 Tower, Plot No: JLT-PH2-X2A,
Jumeirah Lakes Towers, Dubai,
United Arab Emirates

Europe

Future Market Insights

3rd Floor, 207 Regent Street,
W1B 3HH London
United Kingdom

T: + 44 (0) 20 8123 9659
D: +44 (0) 20 3287 4268

Asia Pacific

Future Market Insights

IndiaLand Global Tech Park, Unit UG-1, Behind Grand HighStreet, Phase 1, Hinjawadi, MH, Pune – 411057, India

Carrier Screening Market Outlook

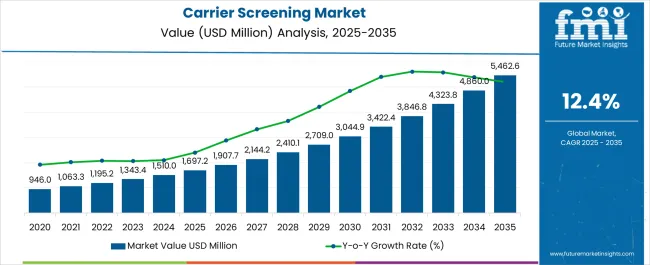
The size of the global carrier screening market was estimated in 2023 at US$ 1,343.40 million, and it is anticipated to exhibit a CAGR of 12.4% from 2023 to 2033. By 2033, the market is expected to be worth US$ 4,323.84 million.

The market is anticipated to grow as a result of increased funding from the public and private sectors in response to the rising demand for genetic tests. The use of affordable technologies for carrier screening is regarded as a crucial factor.

The global carrier screening market is becoming more impacted by the advent of novel tests for improved diagnosis and treatment. The frequency of genetic abnormalities and chronic diseases is rising, which is helping the industry expand.

Attributes Details
Carrier Screening Market CAGR (2023 to 2033) 12.4%
Carrier Screening Market Size (2023) US$ 1,343.40 million
Carrier Screening Market Size (2033) US$ 4,323.84 million

Don't pay for what you don't need

Customize your report by selecting specific countries or regions and save 30%!

Growing Consumer Demand for Early Disease Detection and Technological Advancements May Foster Market Growth

A disease has a higher chance of being effectively treated or cured the earlier it is discovered. It might also be easy to cope with the sickness if it is treated at an early stage.

People can make important decisions about their support and health needs, as well as regarding legal and financial issues, in the early stages of a disease, which helps them plan. Disorders that are inherited include Tay-Sachs disease, sickle cell anemia, and cystic fibrosis.

For a couple with a genetic problem, carrier testing for these disorders can give information about the likelihood of producing a child. Pre-symptomatic/predictive testing refers to risk identification before the onset of symptoms. Many genetic diseases can be identified early on during pregnancy.

The carrier screening market is expanding as a result of consumer desire for reliable and secure carrier tests. The integration of carrier tests into routine clinical treatment benefits the industry commercially.

Frequent Occurrence of Chromosomal Abnormalities

Particularly in affluent countries like England, France, the United States, Italy, Japan, and Germany, the average age of first-time mothers has been rising. The primary drivers of maternal age advancement are a stable financial situation, rising literacy rates, and social variables. This results in surging carrier screening market adoption trends.

Maternal age increases are directly correlated with the probability of catastrophic chromosomal abnormalities. The average maternal age is increasing, which is predicted to raise the incidence of chromosomal abnormalities and increase the demand for carrier screening.

Sabyasachi Ghosh
Sabyasachi Ghosh

Principal Consultant

Talk to Analyst

Find your sweet spots for generating winning opportunities in this market.

Historical Outlook of the Carrier Screening Market

The carrier screening market on a global scale was estimated in 2017 to be worth US$ 0.91 billion and is anticipated to expand at a CAGR of 11.7% from 2017 to 2021. In 2021, the market was estimated to be worth another US$ 1.41 billion. The market's estimated value in 2019 was US$ 1.13 billion.

The carrier screening industry is expected to increase at a faster rate than average during the forecast period, due to reasons such as the growing emphasis on early illness identification and prevention, rising customized medicine acceptance, and rising use of regular testing for genetic abnormalities.

Due to the region's growing prevalence of neurological, hematological, and pulmonary problems, as well as the consequent increase in the demand for testing, North America held a sizable market share in 2021.

Less Awareness of New Technology

The population's ethical concerns about carrier screening and the strict laws governing the clearance of carrier screening tests are impeding carrier screening market expansion. The lack of consistency among laboratories, the administration of pre- and post-test follow-up, and provider misconceptions are further implementation challenges that are projected to impede market expansion.

The price of carrier testing is probably going to limit market expansion. Since there is no requirement to take the test, insurance firms are free to set the terms and conditions following their policies. As a result, out-of-pocket costs may increase by an additional US$ 100 to US$ 1,000.

Get the data you need at a Fraction of the cost

Personalize your report by choosing insights you need
and save 40%!

Comparative View of Adjacent Carrier Screening Market 

Carrier Screening Market:

Attributes Carrier Screening Market
CAGR (2023 to 2033) 12.4%
Market Value (2023) US$ 1,343.40 million
Growth Factor Early disease identification is becoming more and more important, and technological advancements may fuel this demand.
Opportunity New carrier screening market opportunities may arise as a result of important players' rising investments and the rapid evolution of technology.
Key Trends The leading companies' investments in new technologies may enhance market growth going forward.

Preimplantation Genetic Testing (PGT) (PGS/PGD) Market:

Attributes Preimplantation Genetic Testing (PGT) (PGS/PGD) Market
CAGR (2023 to2033) 6.2%
Market Value (2023) US$ 100.94 million
Growth Factor Preimplantation diagnostic and screening procedures are becoming more popular, which is why the incidence of a single gene, mitochondrial, and other gene-related illnesses is on the rise.
Opportunity PGD can help couples who run the danger of passing down inherited illnesses, which is poised to have a good impact on the market.
Key Trends The industry is also driven by the number of encouraging steps taken by the government to assist reproductive health.

Hereditary Testing Market:

Attributes Hereditary Testing Market
CAGR (2023 to 2033) 9.2%
Market Value (2023) US$ 7.27 billion
Growth Factor One of the main market drivers is the growing field of reproductive genetic health.
Opportunity Newborn screening is becoming more widely used globally, which is helping to boost sales.
Key Trends DNA testing kit sales have increased as a result of the persistent increase in demand for newborn screening.

Segmentation Outlook

Which Type Segment is Gaining Immense Popularity?

Attributes Details
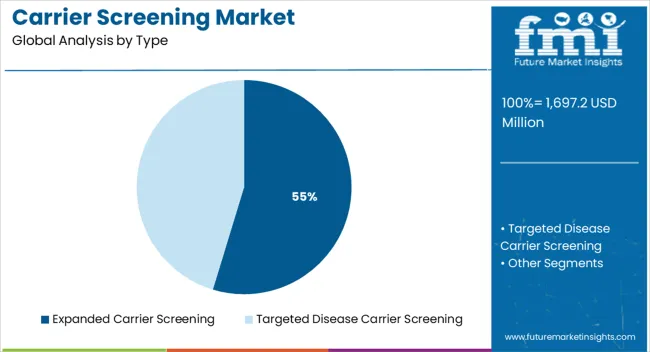
Expanded Carrier Screening - CAGR 12.9%

With a 12.9% CAGR between 2023 and 2033, the expanded carrier screening (ECS) market is predicted to grow at a significant rate and generate the most revenue. The ECS is a new type of carrier screening that screens for a wide range of genetic illnesses, regardless of ethnic background. To increase their carrier screening market share, companies in the industry are engaging in strategic efforts, such as product development.

  • In January 2022, Mitera announced the release of two genetic test products in the United States, one of which is an enhanced carrier screening test that can be done at home and helps people evaluate their risk of any of 421 genetic illnesses. This improves consumer convenience and product accessibility.
  • Similarly, in January 2021 GeneDx, Inc. announced the release of additional genetic tests on the market, including repeat expansion analysis for Friedreich ataxia, spinocerebellar ataxia (SCA), and other prevalent types of genetic ataxias.

The company's enhanced test gives customers the option to ask for single- or multi-gene repeat expansion assessments. Consequently, it is anticipated that the informative test is poised to increase the test's utilization and help with individualized medical management.

For Which Medical Condition is Carrier Screening Widely Used?

The demand for carrier screening is likely to increase as people become more aware of genetic illnesses.

  • Ambry Genetics launched a reproductive health initiative in October 2022, powered by its digital platform, which enhances the experience of customers by making genetic testing, reporting, and counseling more easily accessible.

Multiple test types are supported by the program, including carrier screening, NIPT, and hereditary cancer. The main tests in carrier screening include a panel for SMA/CF, a screening for fragile X, a panel for Ashkenazi Jews, and a comprehensive panel based on guidelines.

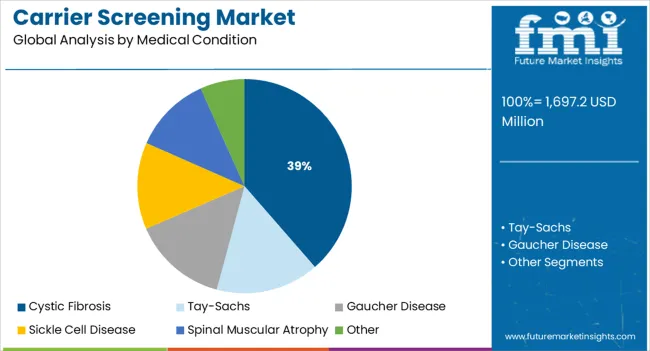
Over 1,300 genetic diseases with recessive inheritance harm babies. The American College of Obstetricians and Gynecologists advises making carrier screening mandatory for all expectant mothers. According to estimates, carrier screening should pay particular attention to Cystic Fibrosis (CF).

When both parents carry the gene for cystic fibrosis, there is a 25% risk that the child is also going to have the condition, while there is a 50% chance that the infant is poised to only be a carrier. Similarly, one of the common recessive illnesses is Spinal Muscular Atrophy (SMA). A non-functional copy of SMN1 was inherited from parents in around 98% of afflicted instances.

  • According to research published in the Egyptian Journal of Medical Human Genetics in February 2022, SMA carriers are frequently identified because it is one of the leading hereditary causes of infant mortality. According to the researchers, qPCR carrier screening for SMA is a quick and affordable test.

This results in the escalation of carrier screening market trends.

Which Technology is Boosting Sales of Carrier Screening?

Attributes Details
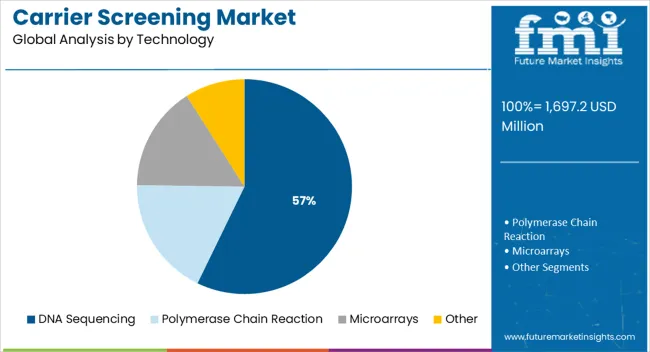
DNA Sequencing Segment Share 39.9%

With a market share of 39.9%, the DNA sequencing market category ruled the overall carrier screening market.

  • Whole exome sequencing was implemented in 2019 for carrier screening testing at the International Peace Maternity and Children's Hospital in China. By September 2022, there were 700 samples at the hospital, up from 600 in 2020, 1,000 in 2021, and 700 in 2020.

The carrier screening tests are performed at several prenatal diagnostics clinics that use sequencing technologies.

Chromosome micro-array and next-generation sequencing technologies are two examples of how technology is advancing quickly in the market.

The full-exon gene sequencing method based on NGS can find high carriers, according to the National Tay-Sachs and Allied Diseases Association. In terms of Tay-Sachs carrier screening, genotyping is thought to be less sensitive than NGS technology.

Which End User is Likely to Contribute to Market Growth?

Attributes Details
Laboratory Segment Share 47.1%

With 47.1% carrier screening market share throughout the forecast period, the laboratory segment dominated the global market. Market participants are developing investment proposals as a result of the rising demand for genetic testing.

  • For instance, Redcliffe Labs stated in November 2022 that it may be spending US$ 10 million to increase its capacity for specialized and genetic testing. With the investment, reference laboratories are poised to have better NGS capabilities, faster turnaround times, and more affordable genomics.

Considered to be the principal suppliers of sequencing solutions to the labs are Oxford Nanopore, Illumina, and ThermoFisher. To incorporate carrier screening services, the end-users are engaging in vertical acquisitions and mergers.

  • For instance, Kindbody, a fertility and family clinic, in June 2022 stated that it had acquired Phosphorus Labs and is poised to internalize genetic testing and screening in order to provide complete solutions. Before the acquisition, the clinic contracted out its preimplantation genetic testing for aneuploidy and increased carrier screening.

The rising use of carrier screening services in-house by end users is predicted to significantly affect the market's estimated value.
Regional Outlook

Why is North America to Offer a Sizable Opportunity for Carrier Screening Manufacturers?

Attributes Details
Market Share 40.19%

With a share of 40.19% between 2033 and 2033, the North American carrier screening market is anticipated to have a commanding position in the industry. Since this area has a sophisticated and effective healthcare system.

The presence of several important firms in the North American region provides a competitive edge for market expansion. The industry is predicted to grow because there is a significantly higher awareness of chromosomal problems and how to prevent them in the area.

Hematological and neurological problems are more prevalent in North America, which reinforces the need for screening testing.

What is Boosting the Adoption of Carrie Screening in the Asia Pacific?

Due to the improved infrastructure of healthcare facilities, thoughtfully crafted reimbursement policies, and improving growth of economic elements, Asia Pacific is predicted to experience a large increase in the carrier screening market. The market is poised to grow as non-profit groups in the area take more initiatives.

  • For instance, the Thalassemia Society announced in December 2022 that it may screen 20,000 to 30,000 pregnant women in Pune, India's rural areas for thalassemia carriers. In India, about 10,000 newborns are diagnosed with thalassemia each year.

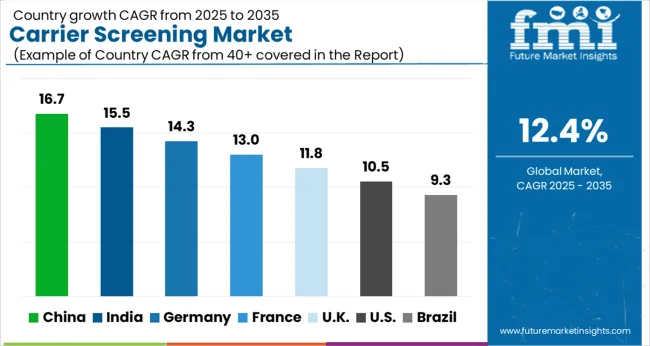
Future growth is anticipated to be rapid in the Asia Pacific. The market is being driven by key competitors' growing investments, particularly in China and India. It is believed that the growing senior population and increased awareness of genetic illnesses are poised to fuel the market.

How Competition Influences the Carrier Screening Market?

To expand the carrier screening market globally, businesses and service providers are using tactics including technological development and discovery, vertical collaboration, building a strong product portfolio through startups, mergers and acquisitions, and regional expansion.

Recent Development:

Funding

Date March 2022
Company Billion to One
Details With significant support from Baillie Gifford, Neotribe Ventures, Norwest Venture Partners, Civilization Ventures, Fifty Years VC, Pacific 8 Ventures, Time BioVentures, and Libertus Capital, among others, Billion to One raised US$ 125 million in Series C funding in March 2022. This round of funding was co-led by Adams Street Partners and existing investor Hummingbird Ventures.

Launch

Date January 2022
Company Mitera
Details Peaches& Me and 23 Pears, Mitera's at-home reproductive genetic testing tools, are available in all 50 states from January 2022, the company revealed. It conducts screenings for ailments like down syndrome.
Date June 2019
Company QIAGEN
Details QIAGEN announced to launch QIAseq, an enhanced carrier screening panel, in June 2019. By providing information on the targets and genes, it is used to identify more than 200 disorders.
Date 2017
Company OPKO Health
Details In 2017, the OPKO Health subsidiary GenPath Women's Health introduced the CalriTest, a non-invasive prenatal screening method. This tool is poised to make it easier to spot faulty chromosomes.
Date 2018
Company Invitae Corporation
Details Invitae Corporation introduced its comprehensive genetic screening tool in 2018.

Partnership

Date April 2021
Company Illumina
Details Based on the data from Illumina's comprehensive genomic profile test, TruSight Oncology, Kartos Therapeutics, Inc., and Illumina established a partnership in April 2021 to jointly develop a TP53 companion diagnostic (CDx). It is poised to increase the range of TruSight Oncology's services, to include hematopoietic cancers of illumination.
Date January 2019
Company Fulgent
Details To provide Columbia patients with on-site performed, expanded carrier screening, Fulgent and Precision Genomics Laboratory (PGL) partnered in January 2019. To produce an enhanced carrier screening test with many advantages over other currently available tests, this alliance is poised to make use of both sides' expertise in laboratory management, bioinformatics, clinical genetics, and next-generation sequencing.

Key Players 

  • Myriad Genetics, Inc
  • Cepheid
  • Illumina
  • Thermo Fisher Scientific Inc.
  • F.Hoffmann-La Roche Ltd
  • Laboratory Corporation of America Holdings
  • Otogenetics
  • MedGenome
  • GeneTech
  • Centogene N.V.

Key Segments  

By Type:

  • Expanded Carrier Screening
  • Targeted Disease Carrier Screening

By Medical Condition:

  • Cystic Fibrosis
  • Tay-Sachs
  • Gaucher Disease
  • Sickle Cell Disease
  • Spinal Muscular Atrophy
  • Other

By Technology:

  • DNA Sequencing
  • Polymerase Chain Reaction
  • Microarrays
  • Other

By End User:

  • Hospitals
  • Laboratories
  • Physician Offices & Clinics
  • Other

By Region:

  • North America
  • Europe
  • Asia Pacific
  • Latin America
  • The Middle East & Africa

Frequently Asked Questions

What is Current Market Valuation?

The market is estimated to secure a valuation of US$ 1,343.40 million in 2023.

What is the Projected Size of the Market by 2033?

The global market size to reach US$ 4,323.84 million by 2033.

What is the Growth Potential of the Carrier Screening Market?

The growth potential of the carrier screening market is 12.4% CAGR through 2033.

Which is the Top Trend in the Carrier Screening Market?

Increasing investments in new technologies may drive the market forward.

What Opportunities Wait for the Market Players?

High incidence of chromosomal abnormalities is expected to create opportunity for market players.

Table of Content

1. Executive Summary | Carrier Screening Market

    1.1. Global Market Outlook

    1.2. Demand-side Trends

    1.3. Supply-side Trends

    1.4. Technology Roadmap Analysis

    1.5. Analysis and Recommendations

2. Market Overview

    2.1. Market Coverage / Taxonomy

    2.2. Market Definition / Scope / Limitations

3. Market Background

    3.1. Market Dynamics

        3.1.1. Drivers

        3.1.2. Restraints

        3.1.3. Opportunity

        3.1.4. Trends

    3.2. Scenario Forecast

        3.2.1. Demand in Optimistic Scenario

        3.2.2. Demand in Likely Scenario

        3.2.3. Demand in Conservative Scenario

    3.3. Opportunity Map Analysis

    3.4. Investment Feasibility Matrix

    3.5. PESTLE and Porter’s Analysis

    3.6. Regulatory Landscape

        3.6.1. By Key Regions

        3.6.2. By Key Countries

    3.7. Regional Parent Market Outlook

4. Global Market Analysis 2018 to 2022 and Forecast, 2023 to 2033

    4.1. Historical Market Size Value (US$ Million) Analysis, 2018 to 2022

    4.2. Current and Future Market Size Value (US$ Million) Projections, 2023 to 2033

        4.2.1. Y-o-Y Growth Trend Analysis

        4.2.2. Absolute $ Opportunity Analysis

5. Global Market Analysis 2018 to 2022 and Forecast 2023 to 2033, By Test Type

    5.1. Introduction / Key Findings

    5.2. Historical Market Size Value (US$ Million) Analysis By Test Type, 2018 to 2022

    5.3. Current and Future Market Size Value (US$ Million) Analysis and Forecast By Test Type, 2023 to 2033

        5.3.1. Molecular Screening Test

        5.3.2. Biochemical Screening Test

    5.4. Y-o-Y Growth Trend Analysis By Test Type, 2018 to 2022

    5.5. Absolute $ Opportunity Analysis By Test Type, 2023 to 2033

6. Global Market Analysis 2018 to 2022 and Forecast 2023 to 2033, By Disease Type

    6.1. Introduction / Key Findings

    6.2. Historical Market Size Value (US$ Million) Analysis By Disease Type, 2018 to 2022

    6.3. Current and Future Market Size Value (US$ Million) Analysis and Forecast By Disease Type, 2023 to 2033

        6.3.1. Cystic Fibrosis

        6.3.2. Tay-Sachs

        6.3.3. Gaucher Disease

        6.3.4. Sickle Cell Disease

        6.3.5. Spinal Muscular Atrophy

        6.3.6. Others

    6.4. Y-o-Y Growth Trend Analysis By Disease Type, 2018 to 2022

    6.5. Absolute $ Opportunity Analysis By Disease Type, 2023 to 2033

7. Global Market Analysis 2018 to 2022 and Forecast 2023 to 2033, By End-User

    7.1. Introduction / Key Findings

    7.2. Historical Market Size Value (US$ Million) Analysis By End-User , 2018 to 2022

    7.3. Current and Future Market Size Value (US$ Million) Analysis and Forecast By End-User , 2023 to 2033

        7.3.1. Hospitals

        7.3.2. Reference Laboratories

        7.3.3. Physician Offices & Clinics

    7.4. Y-o-Y Growth Trend Analysis By End-User , 2018 to 2022

    7.5. Absolute $ Opportunity Analysis By End-User , 2023 to 2033

8. Global Market Analysis 2018 to 2022 and Forecast 2023 to 2033, By Region

    8.1. Introduction

    8.2. Historical Market Size Value (US$ Million) Analysis By Region, 2018 to 2022

    8.3. Current Market Size Value (US$ Million) Analysis and Forecast By Region, 2023 to 2033

        8.3.1. North America

        8.3.2. Latin America

        8.3.3. Europe

        8.3.4. South Asia

        8.3.5. East Asia

        8.3.6. Oceania

        8.3.7. MEA

    8.4. Market Attractiveness Analysis By Region

9. North America Market Analysis 2018 to 2022 and Forecast 2023 to 2033, By Country

    9.1. Historical Market Size Value (US$ Million) Trend Analysis By Market Taxonomy, 2018 to 2022

    9.2. Market Size Value (US$ Million) Forecast By Market Taxonomy, 2023 to 2033

        9.2.1. By Country

            9.2.1.1.USA

            9.2.1.2. Canada

        9.2.2. By Test Type

        9.2.3. By Disease Type

        9.2.4. By End-User

    9.3. Market Attractiveness Analysis

        9.3.1. By Country

        9.3.2. By Test Type

        9.3.3. By Disease Type

        9.3.4. By End-User

    9.4. Key Takeaways

10. Latin America Market Analysis 2018 to 2022 and Forecast 2023 to 2033, By Country

    10.1. Historical Market Size Value (US$ Million) Trend Analysis By Market Taxonomy, 2018 to 2022

    10.2. Market Size Value (US$ Million) Forecast By Market Taxonomy, 2023 to 2033

        10.2.1. By Country

            10.2.1.1. Brazil

            10.2.1.2. Mexico

            10.2.1.3. Rest of Latin America

        10.2.2. By Test Type

        10.2.3. By Disease Type

        10.2.4. By End-User

    10.3. Market Attractiveness Analysis

        10.3.1. By Country

        10.3.2. By Test Type

        10.3.3. By Disease Type

        10.3.4. By End-User

    10.4. Key Takeaways

11. Europe Market Analysis 2018 to 2022 and Forecast 2023 to 2033, By Country

    11.1. Historical Market Size Value (US$ Million) Trend Analysis By Market Taxonomy, 2018 to 2022

    11.2. Market Size Value (US$ Million) Forecast By Market Taxonomy, 2023 to 2033

        11.2.1. By Country

            11.2.1.1. Germany

            11.2.1.2. United kingdom

            11.2.1.3. France

            11.2.1.4. Spain

            11.2.1.5. Italy

            11.2.1.6. Rest of Europe

        11.2.2. By Test Type

        11.2.3. By Disease Type

        11.2.4. By End-User

    11.3. Market Attractiveness Analysis

        11.3.1. By Country

        11.3.2. By Test Type

        11.3.3. By Disease Type

        11.3.4. By End-User

    11.4. Key Takeaways

12. South Asia Market Analysis 2018 to 2022 and Forecast 2023 to 2033, By Country

    12.1. Historical Market Size Value (US$ Million) Trend Analysis By Market Taxonomy, 2018 to 2022

    12.2. Market Size Value (US$ Million) Forecast By Market Taxonomy, 2023 to 2033

        12.2.1. By Country

            12.2.1.1. India

            12.2.1.2. Malaysia

            12.2.1.3. Singapore

            12.2.1.4. Thailand

            12.2.1.5. Rest of South Asia

        12.2.2. By Test Type

        12.2.3. By Disease Type

        12.2.4. By End-User

    12.3. Market Attractiveness Analysis

        12.3.1. By Country

        12.3.2. By Test Type

        12.3.3. By Disease Type

        12.3.4. By End-User

    12.4. Key Takeaways

13. East Asia Market Analysis 2018 to 2022 and Forecast 2023 to 2033, By Country

    13.1. Historical Market Size Value (US$ Million) Trend Analysis By Market Taxonomy, 2018 to 2022

    13.2. Market Size Value (US$ Million) Forecast By Market Taxonomy, 2023 to 2033

        13.2.1. By Country

            13.2.1.1. China

            13.2.1.2. Japan

            13.2.1.3. South Korea

        13.2.2. By Test Type

        13.2.3. By Disease Type

        13.2.4. By End-User

    13.3. Market Attractiveness Analysis

        13.3.1. By Country

        13.3.2. By Test Type

        13.3.3. By Disease Type

        13.3.4. By End-User

    13.4. Key Takeaways

14. Oceania Market Analysis 2018 to 2022 and Forecast 2023 to 2033, By Country

    14.1. Historical Market Size Value (US$ Million) Trend Analysis By Market Taxonomy, 2018 to 2022

    14.2. Market Size Value (US$ Million) Forecast By Market Taxonomy, 2023 to 2033

        14.2.1. By Country

            14.2.1.1. Australia

            14.2.1.2. New Zealand

        14.2.2. By Test Type

        14.2.3. By Disease Type

        14.2.4. By End-User

    14.3. Market Attractiveness Analysis

        14.3.1. By Country

        14.3.2. By Test Type

        14.3.3. By Disease Type

        14.3.4. By End-User

    14.4. Key Takeaways

15. MEA Market Analysis 2018 to 2022 and Forecast 2023 to 2033, By Country

    15.1. Historical Market Size Value (US$ Million) Trend Analysis By Market Taxonomy, 2018 to 2022

    15.2. Market Size Value (US$ Million) Forecast By Market Taxonomy, 2023 to 2033

        15.2.1. By Country

            15.2.1.1. GCC Countries

            15.2.1.2. South Africa

            15.2.1.3. Israel

            15.2.1.4. Rest of MEA

        15.2.2. By Test Type

        15.2.3. By Disease Type

        15.2.4. By End-User

    15.3. Market Attractiveness Analysis

        15.3.1. By Country

        15.3.2. By Test Type

        15.3.3. By Disease Type

        15.3.4. By End-User

    15.4. Key Takeaways

16. Key Countries Market Analysis

    16.1.USA

        16.1.1. Pricing Analysis

        16.1.2. Market Share Analysis, 2022

            16.1.2.1. By Test Type

            16.1.2.2. By Disease Type

            16.1.2.3. By End-User

    16.2. Canada

        16.2.1. Pricing Analysis

        16.2.2. Market Share Analysis, 2022

            16.2.2.1. By Test Type

            16.2.2.2. By Disease Type

            16.2.2.3. By End-User

    16.3. Brazil

        16.3.1. Pricing Analysis

        16.3.2. Market Share Analysis, 2022

            16.3.2.1. By Test Type

            16.3.2.2. By Disease Type

            16.3.2.3. By End-User

    16.4. Mexico

        16.4.1. Pricing Analysis

        16.4.2. Market Share Analysis, 2022

            16.4.2.1. By Test Type

            16.4.2.2. By Disease Type

            16.4.2.3. By End-User

    16.5. Germany

        16.5.1. Pricing Analysis

        16.5.2. Market Share Analysis, 2022

            16.5.2.1. By Test Type

            16.5.2.2. By Disease Type

            16.5.2.3. By End-User

    16.6. United kingdom

        16.6.1. Pricing Analysis

        16.6.2. Market Share Analysis, 2022

            16.6.2.1. By Test Type

            16.6.2.2. By Disease Type

            16.6.2.3. By End-User

    16.7. France

        16.7.1. Pricing Analysis

        16.7.2. Market Share Analysis, 2022

            16.7.2.1. By Test Type

            16.7.2.2. By Disease Type

            16.7.2.3. By End-User

    16.8. Spain

        16.8.1. Pricing Analysis

        16.8.2. Market Share Analysis, 2022

            16.8.2.1. By Test Type

            16.8.2.2. By Disease Type

            16.8.2.3. By End-User

    16.9. Italy

        16.9.1. Pricing Analysis

        16.9.2. Market Share Analysis, 2022

            16.9.2.1. By Test Type

            16.9.2.2. By Disease Type

            16.9.2.3. By End-User

    16.10. India

        16.10.1. Pricing Analysis

        16.10.2. Market Share Analysis, 2022

            16.10.2.1. By Test Type

            16.10.2.2. By Disease Type

            16.10.2.3. By End-User

    16.11. Malaysia

        16.11.1. Pricing Analysis

        16.11.2. Market Share Analysis, 2022

            16.11.2.1. By Test Type

            16.11.2.2. By Disease Type

            16.11.2.3. By End-User

    16.12. Singapore

        16.12.1. Pricing Analysis

        16.12.2. Market Share Analysis, 2022

            16.12.2.1. By Test Type

            16.12.2.2. By Disease Type

            16.12.2.3. By End-User

    16.13. Thailand

        16.13.1. Pricing Analysis

        16.13.2. Market Share Analysis, 2022

            16.13.2.1. By Test Type

            16.13.2.2. By Disease Type

            16.13.2.3. By End-User

    16.14. China

        16.14.1. Pricing Analysis

        16.14.2. Market Share Analysis, 2022

            16.14.2.1. By Test Type

            16.14.2.2. By Disease Type

            16.14.2.3. By End-User

    16.15. Japan

        16.15.1. Pricing Analysis

        16.15.2. Market Share Analysis, 2022

            16.15.2.1. By Test Type

            16.15.2.2. By Disease Type

            16.15.2.3. By End-User

    16.16. South Korea

        16.16.1. Pricing Analysis

        16.16.2. Market Share Analysis, 2022

            16.16.2.1. By Test Type

            16.16.2.2. By Disease Type

            16.16.2.3. By End-User

    16.17. Australia

        16.17.1. Pricing Analysis

        16.17.2. Market Share Analysis, 2022

            16.17.2.1. By Test Type

            16.17.2.2. By Disease Type

            16.17.2.3. By End-User

    16.18. New Zealand

        16.18.1. Pricing Analysis

        16.18.2. Market Share Analysis, 2022

            16.18.2.1. By Test Type

            16.18.2.2. By Disease Type

            16.18.2.3. By End-User

    16.19. GCC Countries

        16.19.1. Pricing Analysis

        16.19.2. Market Share Analysis, 2022

            16.19.2.1. By Test Type

            16.19.2.2. By Disease Type

            16.19.2.3. By End-User

    16.20. South Africa

        16.20.1. Pricing Analysis

        16.20.2. Market Share Analysis, 2022

            16.20.2.1. By Test Type

            16.20.2.2. By Disease Type

            16.20.2.3. By End-User

    16.21. Israel

        16.21.1. Pricing Analysis

        16.21.2. Market Share Analysis, 2022

            16.21.2.1. By Test Type

            16.21.2.2. By Disease Type

            16.21.2.3. By End-User ;

17. Market Structure Analysis

    17.1. Competition Dashboard

    17.2. Competition Benchmarking

    17.3. Market Share Analysis of Top Players

        17.3.1. By Regional

        17.3.2. By Test Type

        17.3.3. By Disease Type

        17.3.4. By End-User

18. Competition Analysis

    18.1. Competition Deep Dive

        18.1.1. Abbott Laboratories

            18.1.1.1. Overview

            18.1.1.2. Product Portfolio

            18.1.1.3. Profitability by Market Segments

            18.1.1.4. Sales Footprint

            18.1.1.5. Strategy Overview

                18.1.1.5.1. Marketing Strategy

        18.1.2. F. Hoffmann-La Roche AG

            18.1.2.1. Overview

            18.1.2.2. Product Portfolio

            18.1.2.3. Profitability by Market Segments

            18.1.2.4. Sales Footprint

            18.1.2.5. Strategy Overview

                18.1.2.5.1. Marketing Strategy

        18.1.3. Danaher Corporation

            18.1.3.1. Overview

            18.1.3.2. Product Portfolio

            18.1.3.3. Profitability by Market Segments

            18.1.3.4. Sales Footprint

            18.1.3.5. Strategy Overview

                18.1.3.5.1. Marketing Strategy

        18.1.4. Illumina Inc.

            18.1.4.1. Overview

            18.1.4.2. Product Portfolio

            18.1.4.3. Profitability by Market Segments

            18.1.4.4. Sales Footprint

            18.1.4.5. Strategy Overview

                18.1.4.5.1. Marketing Strategy

        18.1.5. Thermo Fisher Scientific Inc.

            18.1.5.1. Overview

            18.1.5.2. Product Portfolio

            18.1.5.3. Profitability by Market Segments

            18.1.5.4. Sales Footprint

            18.1.5.5. Strategy Overview

                18.1.5.5.1. Marketing Strategy

        18.1.6. Autogenomics Inc.

            18.1.6.1. Overview

            18.1.6.2. Product Portfolio

            18.1.6.3. Profitability by Market Segments

            18.1.6.4. Sales Footprint

            18.1.6.5. Strategy Overview

                18.1.6.5.1. Marketing Strategy

        18.1.7. Eurofins Scientific

            18.1.7.1. Overview

            18.1.7.2. Product Portfolio

            18.1.7.3. Profitability by Market Segments

            18.1.7.4. Sales Footprint

            18.1.7.5. Strategy Overview

                18.1.7.5.1. Marketing Strategy

        18.1.8. Fulgent Genetics Inc.

            18.1.8.1. Overview

            18.1.8.2. Product Portfolio

            18.1.8.3. Profitability by Market Segments

            18.1.8.4. Sales Footprint

            18.1.8.5. Strategy Overview

                18.1.8.5.1. Marketing Strategy

        18.1.9. Opko Health

            18.1.9.1. Overview

            18.1.9.2. Product Portfolio

            18.1.9.3. Profitability by Market Segments

            18.1.9.4. Sales Footprint

            18.1.9.5. Strategy Overview

                18.1.9.5.1. Marketing Strategy

        18.1.10. Quest Diagnostics Incorporated

            18.1.10.1. Overview

            18.1.10.2. Product Portfolio

            18.1.10.3. Profitability by Market Segments

            18.1.10.4. Sales Footprint

            18.1.10.5. Strategy Overview

                18.1.10.5.1. Marketing Strategy

        18.1.11. Invitae Corporation

            18.1.11.1. Overview

            18.1.11.2. Product Portfolio

            18.1.11.3. Profitability by Market Segments

            18.1.11.4. Sales Footprint

            18.1.11.5. Strategy Overview

                18.1.11.5.1. Marketing Strategy

        18.1.12. Luminex Corporation

            18.1.12.1. Overview

            18.1.12.2. Product Portfolio

            18.1.12.3. Profitability by Market Segments

            18.1.12.4. Sales Footprint

            18.1.12.5. Strategy Overview

                18.1.12.5.1. Marketing Strategy

19. Assumptions & Acronyms Used

20. Research Methodology

Don't pay for what you don't need

Customize your report by selecting specific countries or regions and save 30%!

List of Tables

Table 1: Global Market Value (US$ Million) Forecast by Region, 2018 to 2033

Table 2: Global Market Value (US$ Million) Forecast by Test Type, 2018 to 2033

Table 3: Global Market Value (US$ Million) Forecast by Disease Type, 2018 to 2033

Table 4: Global Market Value (US$ Million) Forecast by End-User , 2018 to 2033

Table 5: North America Market Value (US$ Million) Forecast by Country, 2018 to 2033

Table 6: North America Market Value (US$ Million) Forecast by Test Type, 2018 to 2033

Table 7: North America Market Value (US$ Million) Forecast by Disease Type, 2018 to 2033

Table 8: North America Market Value (US$ Million) Forecast by End-User , 2018 to 2033

Table 9: Latin America Market Value (US$ Million) Forecast by Country, 2018 to 2033

Table 10: Latin America Market Value (US$ Million) Forecast by Test Type, 2018 to 2033

Table 11: Latin America Market Value (US$ Million) Forecast by Disease Type, 2018 to 2033

Table 12: Latin America Market Value (US$ Million) Forecast by End-User , 2018 to 2033

Table 13: Europe Market Value (US$ Million) Forecast by Country, 2018 to 2033

Table 14: Europe Market Value (US$ Million) Forecast by Test Type, 2018 to 2033

Table 15: Europe Market Value (US$ Million) Forecast by Disease Type, 2018 to 2033

Table 16: Europe Market Value (US$ Million) Forecast by End-User , 2018 to 2033

Table 17: South Asia Market Value (US$ Million) Forecast by Country, 2018 to 2033

Table 18: South Asia Market Value (US$ Million) Forecast by Test Type, 2018 to 2033

Table 19: South Asia Market Value (US$ Million) Forecast by Disease Type, 2018 to 2033

Table 20: South Asia Market Value (US$ Million) Forecast by End-User , 2018 to 2033

Table 21: East Asia Market Value (US$ Million) Forecast by Country, 2018 to 2033

Table 22: East Asia Market Value (US$ Million) Forecast by Test Type, 2018 to 2033

Table 23: East Asia Market Value (US$ Million) Forecast by Disease Type, 2018 to 2033

Table 24: East Asia Market Value (US$ Million) Forecast by End-User , 2018 to 2033

Table 25: Oceania Market Value (US$ Million) Forecast by Country, 2018 to 2033

Table 26: Oceania Market Value (US$ Million) Forecast by Test Type, 2018 to 2033

Table 27: Oceania Market Value (US$ Million) Forecast by Disease Type, 2018 to 2033

Table 28: Oceania Market Value (US$ Million) Forecast by End-User , 2018 to 2033

Table 29: MEA Market Value (US$ Million) Forecast by Country, 2018 to 2033

Table 30: MEA Market Value (US$ Million) Forecast by Test Type, 2018 to 2033

Table 31: MEA Market Value (US$ Million) Forecast by Disease Type, 2018 to 2033

Table 32: MEA Market Value (US$ Million) Forecast by End-User , 2018 to 2033
Sabyasachi Ghosh
Sabyasachi Ghosh

Principal Consultant

Talk to Analyst

Find your sweet spots for generating winning opportunities in this market.

List of Charts

Figure 1: Global Market Value (US$ Million) by Test Type, 2023 to 2033

Figure 2: Global Market Value (US$ Million) by Disease Type, 2023 to 2033

Figure 3: Global Market Value (US$ Million) by End-User , 2023 to 2033

Figure 4: Global Market Value (US$ Million) by Region, 2023 to 2033

Figure 5: Global Market Value (US$ Million) Analysis by Region, 2018 to 2033

Figure 6: Global Market Value Share (%) and BPS Analysis by Region, 2023 to 2033

Figure 7: Global Market Y-o-Y Growth (%) Projections by Region, 2023 to 2033

Figure 8: Global Market Value (US$ Million) Analysis by Test Type, 2018 to 2033

Figure 9: Global Market Value Share (%) and BPS Analysis by Test Type, 2023 to 2033

Figure 10: Global Market Y-o-Y Growth (%) Projections by Test Type, 2023 to 2033

Figure 11: Global Market Value (US$ Million) Analysis by Disease Type, 2018 to 2033

Figure 12: Global Market Value Share (%) and BPS Analysis by Disease Type, 2023 to 2033

Figure 13: Global Market Y-o-Y Growth (%) Projections by Disease Type, 2023 to 2033

Figure 14: Global Market Value (US$ Million) Analysis by End-User , 2018 to 2033

Figure 15: Global Market Value Share (%) and BPS Analysis by End-User , 2023 to 2033

Figure 16: Global Market Y-o-Y Growth (%) Projections by End-User , 2023 to 2033

Figure 17: Global Market Attractiveness by Test Type, 2023 to 2033

Figure 18: Global Market Attractiveness by Disease Type, 2023 to 2033

Figure 19: Global Market Attractiveness by End-User , 2023 to 2033

Figure 20: Global Market Attractiveness by Region, 2023 to 2033

Figure 21: North America Market Value (US$ Million) by Test Type, 2023 to 2033

Figure 22: North America Market Value (US$ Million) by Disease Type, 2023 to 2033

Figure 23: North America Market Value (US$ Million) by End-User , 2023 to 2033

Figure 24: North America Market Value (US$ Million) by Country, 2023 to 2033

Figure 25: North America Market Value (US$ Million) Analysis by Country, 2018 to 2033

Figure 26: North America Market Value Share (%) and BPS Analysis by Country, 2023 to 2033

Figure 27: North America Market Y-o-Y Growth (%) Projections by Country, 2023 to 2033

Figure 28: North America Market Value (US$ Million) Analysis by Test Type, 2018 to 2033

Figure 29: North America Market Value Share (%) and BPS Analysis by Test Type, 2023 to 2033

Figure 30: North America Market Y-o-Y Growth (%) Projections by Test Type, 2023 to 2033

Figure 31: North America Market Value (US$ Million) Analysis by Disease Type, 2018 to 2033

Figure 32: North America Market Value Share (%) and BPS Analysis by Disease Type, 2023 to 2033

Figure 33: North America Market Y-o-Y Growth (%) Projections by Disease Type, 2023 to 2033

Figure 34: North America Market Value (US$ Million) Analysis by End-User , 2018 to 2033

Figure 35: North America Market Value Share (%) and BPS Analysis by End-User , 2023 to 2033

Figure 36: North America Market Y-o-Y Growth (%) Projections by End-User , 2023 to 2033

Figure 37: North America Market Attractiveness by Test Type, 2023 to 2033

Figure 38: North America Market Attractiveness by Disease Type, 2023 to 2033

Figure 39: North America Market Attractiveness by End-User , 2023 to 2033

Figure 40: North America Market Attractiveness by Country, 2023 to 2033

Figure 41: Latin America Market Value (US$ Million) by Test Type, 2023 to 2033

Figure 42: Latin America Market Value (US$ Million) by Disease Type, 2023 to 2033

Figure 43: Latin America Market Value (US$ Million) by End-User , 2023 to 2033

Figure 44: Latin America Market Value (US$ Million) by Country, 2023 to 2033

Figure 45: Latin America Market Value (US$ Million) Analysis by Country, 2018 to 2033

Figure 46: Latin America Market Value Share (%) and BPS Analysis by Country, 2023 to 2033

Figure 47: Latin America Market Y-o-Y Growth (%) Projections by Country, 2023 to 2033

Figure 48: Latin America Market Value (US$ Million) Analysis by Test Type, 2018 to 2033

Figure 49: Latin America Market Value Share (%) and BPS Analysis by Test Type, 2023 to 2033

Figure 50: Latin America Market Y-o-Y Growth (%) Projections by Test Type, 2023 to 2033

Figure 51: Latin America Market Value (US$ Million) Analysis by Disease Type, 2018 to 2033

Figure 52: Latin America Market Value Share (%) and BPS Analysis by Disease Type, 2023 to 2033

Figure 53: Latin America Market Y-o-Y Growth (%) Projections by Disease Type, 2023 to 2033

Figure 54: Latin America Market Value (US$ Million) Analysis by End-User , 2018 to 2033

Figure 55: Latin America Market Value Share (%) and BPS Analysis by End-User , 2023 to 2033

Figure 56: Latin America Market Y-o-Y Growth (%) Projections by End-User , 2023 to 2033

Figure 57: Latin America Market Attractiveness by Test Type, 2023 to 2033

Figure 58: Latin America Market Attractiveness by Disease Type, 2023 to 2033

Figure 59: Latin America Market Attractiveness by End-User , 2023 to 2033

Figure 60: Latin America Market Attractiveness by Country, 2023 to 2033

Figure 61: Europe Market Value (US$ Million) by Test Type, 2023 to 2033

Figure 62: Europe Market Value (US$ Million) by Disease Type, 2023 to 2033

Figure 63: Europe Market Value (US$ Million) by End-User , 2023 to 2033

Figure 64: Europe Market Value (US$ Million) by Country, 2023 to 2033

Figure 65: Europe Market Value (US$ Million) Analysis by Country, 2018 to 2033

Figure 66: Europe Market Value Share (%) and BPS Analysis by Country, 2023 to 2033

Figure 67: Europe Market Y-o-Y Growth (%) Projections by Country, 2023 to 2033

Figure 68: Europe Market Value (US$ Million) Analysis by Test Type, 2018 to 2033

Figure 69: Europe Market Value Share (%) and BPS Analysis by Test Type, 2023 to 2033

Figure 70: Europe Market Y-o-Y Growth (%) Projections by Test Type, 2023 to 2033

Figure 71: Europe Market Value (US$ Million) Analysis by Disease Type, 2018 to 2033

Figure 72: Europe Market Value Share (%) and BPS Analysis by Disease Type, 2023 to 2033

Figure 73: Europe Market Y-o-Y Growth (%) Projections by Disease Type, 2023 to 2033

Figure 74: Europe Market Value (US$ Million) Analysis by End-User , 2018 to 2033

Figure 75: Europe Market Value Share (%) and BPS Analysis by End-User , 2023 to 2033

Figure 76: Europe Market Y-o-Y Growth (%) Projections by End-User , 2023 to 2033

Figure 77: Europe Market Attractiveness by Test Type, 2023 to 2033

Figure 78: Europe Market Attractiveness by Disease Type, 2023 to 2033

Figure 79: Europe Market Attractiveness by End-User , 2023 to 2033

Figure 80: Europe Market Attractiveness by Country, 2023 to 2033

Figure 81: South Asia Market Value (US$ Million) by Test Type, 2023 to 2033

Figure 82: South Asia Market Value (US$ Million) by Disease Type, 2023 to 2033

Figure 83: South Asia Market Value (US$ Million) by End-User , 2023 to 2033

Figure 84: South Asia Market Value (US$ Million) by Country, 2023 to 2033

Figure 85: South Asia Market Value (US$ Million) Analysis by Country, 2018 to 2033

Figure 86: South Asia Market Value Share (%) and BPS Analysis by Country, 2023 to 2033

Figure 87: South Asia Market Y-o-Y Growth (%) Projections by Country, 2023 to 2033

Figure 88: South Asia Market Value (US$ Million) Analysis by Test Type, 2018 to 2033

Figure 89: South Asia Market Value Share (%) and BPS Analysis by Test Type, 2023 to 2033

Figure 90: South Asia Market Y-o-Y Growth (%) Projections by Test Type, 2023 to 2033

Figure 91: South Asia Market Value (US$ Million) Analysis by Disease Type, 2018 to 2033

Figure 92: South Asia Market Value Share (%) and BPS Analysis by Disease Type, 2023 to 2033

Figure 93: South Asia Market Y-o-Y Growth (%) Projections by Disease Type, 2023 to 2033

Figure 94: South Asia Market Value (US$ Million) Analysis by End-User , 2018 to 2033

Figure 95: South Asia Market Value Share (%) and BPS Analysis by End-User , 2023 to 2033

Figure 96: South Asia Market Y-o-Y Growth (%) Projections by End-User , 2023 to 2033

Figure 97: South Asia Market Attractiveness by Test Type, 2023 to 2033

Figure 98: South Asia Market Attractiveness by Disease Type, 2023 to 2033

Figure 99: South Asia Market Attractiveness by End-User , 2023 to 2033

Figure 100: South Asia Market Attractiveness by Country, 2023 to 2033

Figure 101: East Asia Market Value (US$ Million) by Test Type, 2023 to 2033

Figure 102: East Asia Market Value (US$ Million) by Disease Type, 2023 to 2033

Figure 103: East Asia Market Value (US$ Million) by End-User , 2023 to 2033

Figure 104: East Asia Market Value (US$ Million) by Country, 2023 to 2033

Figure 105: East Asia Market Value (US$ Million) Analysis by Country, 2018 to 2033

Figure 106: East Asia Market Value Share (%) and BPS Analysis by Country, 2023 to 2033

Figure 107: East Asia Market Y-o-Y Growth (%) Projections by Country, 2023 to 2033

Figure 108: East Asia Market Value (US$ Million) Analysis by Test Type, 2018 to 2033

Figure 109: East Asia Market Value Share (%) and BPS Analysis by Test Type, 2023 to 2033

Figure 110: East Asia Market Y-o-Y Growth (%) Projections by Test Type, 2023 to 2033

Figure 111: East Asia Market Value (US$ Million) Analysis by Disease Type, 2018 to 2033

Figure 112: East Asia Market Value Share (%) and BPS Analysis by Disease Type, 2023 to 2033

Figure 113: East Asia Market Y-o-Y Growth (%) Projections by Disease Type, 2023 to 2033

Figure 114: East Asia Market Value (US$ Million) Analysis by End-User , 2018 to 2033

Figure 115: East Asia Market Value Share (%) and BPS Analysis by End-User , 2023 to 2033

Figure 116: East Asia Market Y-o-Y Growth (%) Projections by End-User , 2023 to 2033

Figure 117: East Asia Market Attractiveness by Test Type, 2023 to 2033

Figure 118: East Asia Market Attractiveness by Disease Type, 2023 to 2033

Figure 119: East Asia Market Attractiveness by End-User , 2023 to 2033

Figure 120: East Asia Market Attractiveness by Country, 2023 to 2033

Figure 121: Oceania Market Value (US$ Million) by Test Type, 2023 to 2033

Figure 122: Oceania Market Value (US$ Million) by Disease Type, 2023 to 2033

Figure 123: Oceania Market Value (US$ Million) by End-User , 2023 to 2033

Figure 124: Oceania Market Value (US$ Million) by Country, 2023 to 2033

Figure 125: Oceania Market Value (US$ Million) Analysis by Country, 2018 to 2033

Figure 126: Oceania Market Value Share (%) and BPS Analysis by Country, 2023 to 2033

Figure 127: Oceania Market Y-o-Y Growth (%) Projections by Country, 2023 to 2033

Figure 128: Oceania Market Value (US$ Million) Analysis by Test Type, 2018 to 2033

Figure 129: Oceania Market Value Share (%) and BPS Analysis by Test Type, 2023 to 2033

Figure 130: Oceania Market Y-o-Y Growth (%) Projections by Test Type, 2023 to 2033

Figure 131: Oceania Market Value (US$ Million) Analysis by Disease Type, 2018 to 2033

Figure 132: Oceania Market Value Share (%) and BPS Analysis by Disease Type, 2023 to 2033

Figure 133: Oceania Market Y-o-Y Growth (%) Projections by Disease Type, 2023 to 2033

Figure 134: Oceania Market Value (US$ Million) Analysis by End-User , 2018 to 2033

Figure 135: Oceania Market Value Share (%) and BPS Analysis by End-User , 2023 to 2033

Figure 136: Oceania Market Y-o-Y Growth (%) Projections by End-User , 2023 to 2033

Figure 137: Oceania Market Attractiveness by Test Type, 2023 to 2033

Figure 138: Oceania Market Attractiveness by Disease Type, 2023 to 2033

Figure 139: Oceania Market Attractiveness by End-User , 2023 to 2033

Figure 140: Oceania Market Attractiveness by Country, 2023 to 2033

Figure 141: MEA Market Value (US$ Million) by Test Type, 2023 to 2033

Figure 142: MEA Market Value (US$ Million) by Disease Type, 2023 to 2033

Figure 143: MEA Market Value (US$ Million) by End-User , 2023 to 2033

Figure 144: MEA Market Value (US$ Million) by Country, 2023 to 2033

Figure 145: MEA Market Value (US$ Million) Analysis by Country, 2018 to 2033

Figure 146: MEA Market Value Share (%) and BPS Analysis by Country, 2023 to 2033

Figure 147: MEA Market Y-o-Y Growth (%) Projections by Country, 2023 to 2033

Figure 148: MEA Market Value (US$ Million) Analysis by Test Type, 2018 to 2033

Figure 149: MEA Market Value Share (%) and BPS Analysis by Test Type, 2023 to 2033

Figure 150: MEA Market Y-o-Y Growth (%) Projections by Test Type, 2023 to 2033

Figure 151: MEA Market Value (US$ Million) Analysis by Disease Type, 2018 to 2033

Figure 152: MEA Market Value Share (%) and BPS Analysis by Disease Type, 2023 to 2033

Figure 153: MEA Market Y-o-Y Growth (%) Projections by Disease Type, 2023 to 2033

Figure 154: MEA Market Value (US$ Million) Analysis by End-User , 2018 to 2033

Figure 155: MEA Market Value Share (%) and BPS Analysis by End-User , 2023 to 2033

Figure 156: MEA Market Y-o-Y Growth (%) Projections by End-User , 2023 to 2033

Figure 157: MEA Market Attractiveness by Test Type, 2023 to 2033

Figure 158: MEA Market Attractiveness by Disease Type, 2023 to 2033

Figure 159: MEA Market Attractiveness by End-User , 2023 to 2033

Figure 160: MEA Market Attractiveness by Country, 2023 to 2033

Recommendations

Healthcare

High Content Screening Market

Published : May 2023

Healthcare

New-Born Screening Equipment Market

Published : November 2022

Explore Healthcare Insights

View Reports