Mass Transfer Trays Market Forecast and Outlook (2025-2035)

The global mass transfer trays market is valued at USD 324.1 million in 2025. It is slated to reach USD 564.1 million by 2035, recording an absolute increase of USD 240.0 million over the forecast period. This translates into a total growth of 74.1%, with the market forecast to expand at a compound annual growth rate (CAGR) of 5.7% between 2025 and 2035. The overall market size is expected to grow by nearly 1.74X during the same period, supported by increasing demand for efficient separation processes, growing adoption of advanced distillation technologies in chemical processing, and rising emphasis on operational efficiency across diverse petrochemical and industrial applications.
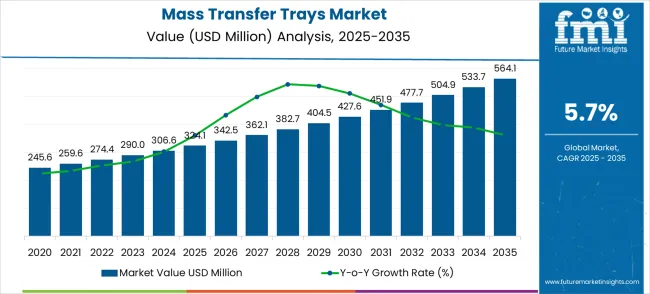
Quick Stats for Mass Transfer Trays Market

  • Mass Transfer Trays Market Value (2025): USD 324.1 million
  • Mass Transfer Trays Market Forecast Value (2035): USD 564.1 million
  • Mass Transfer Trays Market Forecast CAGR: 5.7%
  • Leading Tray Type in Mass Transfer Trays Market: Sieve Trays
  • Key Growth Regions in Mass Transfer Trays Market: Asia Pacific, North America, and Europe
  • Key Players in Mass Transfer Trays Market: Koch-Glitsch, RVT Process Equipment, Sulzer, Raschig, Saiptech, Honeywell

Mass Transfer Trays Market Market Value Analysis

Between 2025 and 2030, the mass transfer trays market is projected to expand from USD 324.1 million to USD 427.6 million, resulting in a value increase of USD 103.5 million, which represents 43.1% of the total forecast growth for the decade. This phase of development will be shaped by increasing chemical processing capacity expansion, rising adoption of advanced separation technologies, and growing demand for energy-efficient distillation systems that optimize mass transfer efficiency and reduce operational costs. Chemical plant operators and process engineers are expanding their mass transfer tray installations to address the growing demand for improved separation performance and process optimization.

Mass Transfer Trays Market Key Takeaways

Metric Value
Estimated Value in (2025E) USD 324.1 million
Forecast Value in (2035F) USD 564.1 million
Forecast CAGR (2025 to 2035) 5.7%

The mass transfer trays market has been recognized as an integral part of various industrial processes, particularly in sectors where separation and filtration are critical. Within the chemical processing equipment market, this segment contributes approximately 9.4%, as mass transfer trays are widely used in distillation columns for separating components in chemical reactions. The industrial separation equipment market records a share of about 10.2%, with mass transfer trays playing a key role in separation processes across industries like petrochemicals and pharmaceuticals. In the process filtration equipment market, the contribution stands at 8.6%, reflecting their application in filtration and separation technologies. The oil and gas equipment market accounts for around 7.9%, as mass transfer trays are essential in refining processes for crude oil and gas separation. In the water treatment equipment market, the share is approximately 6.8%, due to the need for separation processes in wastewater treatment. These parent markets collectively contribute 42.9%, emphasizing the mass transfer trays market’s role in optimizing efficiency, enhancing separation processes, and supporting the reliability of key industrial operations. The market is regarded as fundamental in industries that rely on precise and effective separation technologies.

Opportunity Pathways – Mass Transfer Trays Market The mass transfer trays market is positioned for steady expansion as global chemical, petrochemical, and refining industries emphasize efficiency, sustainability, and modernization. Growing capacity additions in Asia-Pacific and industrial modernization in North America, Europe, and Latin America are driving adoption of advanced tray systems. Pathways like computational fluid dynamics (CFD)-optimized designs, digital monitoring integration, sustainable and energy-efficient tray systems, and specialized trays for renewable chemicals and circular economy processes are opening high-value opportunities. As operators demand both operational reliability and sustainability-driven innovation, suppliers who combine engineering excellence with digitalization and process optimization will capture the largest value pools. Regulatory pressures on energy consumption, emission control, and chemical process safety provide structural momentum.

  • Pathway A - CFD-Optimized Tray Designs. Advanced computational fluid dynamics modeling enables tray designs that maximize mass transfer efficiency while minimizing pressure drop, appealing to operators seeking higher yield and energy savings. Expected revenue pool: USD 4-7 billion.
  • Pathway B - Digital Monitoring & Smart Process Control. Integration of sensors and digital platforms supports predictive maintenance, real-time optimization, and automated control, offering strong adoption potential in high-value chemical and petrochemical plants. Opportunity: USD 5-8 billion.
  • Pathway C - Sustainable & Green Process Trays. Development of trays optimized for renewable chemical production, bio-based processing, and circular economy initiatives allows suppliers to tap into sustainability-driven differentiation. Revenue lift: USD 3-6 billion.
  • Pathway D - Expansion of Petrochemical & Refining Applications. With petrochemicals remaining the largest demand center, large-scale investments in refining and chemical synthesis create significant volume opportunities for tray suppliers. Pool: USD 6-10 billion.
  • Pathway E - Geographic Expansion in Emerging Markets. Rapid chemical processing growth in China, India, Brazil, and the Middle East offers strong upside, with localized tray manufacturing and support services lowering costs and boosting penetration. Expected upside: USD 7-11 billion.
  • Pathway F - Competitive Shift from Structured Packing. While structured packing competes in certain applications, tray suppliers can differentiate via cost-effectiveness, flexibility, and debottlenecking potential, creating retention and upgrade opportunities. USD 3-5 billion.

Why is the Mass Transfer Trays Market Growing?

Market expansion is being supported by the increasing global demand for efficient chemical processing and the corresponding need for advanced separation technologies that can optimize mass transfer efficiency, reduce energy consumption, and enhance product purity across various petrochemical, oil & gas, and fine chemical processing applications. Modern chemical plant operators and process engineers are increasingly focused on implementing separation solutions that can improve process efficiency, reduce operational costs, and provide consistent performance in demanding processing environments. Mass transfer trays' proven ability to deliver enhanced separation efficiency, optimize energy utilization, and support process intensification makes them essential components for contemporary chemical processing and industrial separation operations.

The growing emphasis on energy efficiency and process optimization is driving demand for mass transfer trays that can support advanced separation processes, reduce energy consumption, and enable comprehensive process control. Chemical processing facilities' preference for separation equipment that combines high efficiency with operational reliability and maintenance simplicity is creating opportunities for innovative mass transfer tray implementations. The rising influence of sustainable chemistry and green processing technologies is also contributing to increased adoption of mass transfer trays that can provide efficient separation without compromising environmental performance or process sustainability.

Segmental Analysis

The market is segmented by tray type, application, and region. By tray type, the market is divided into sieve trays, valve trays, and others. Based on application, the market is categorized into the petrochemical industry, oil & gas, fine chemical industry, and others. Regionally, the market is divided into Asia Pacific, North America, Europe, Latin America, and the Middle East & Africa.
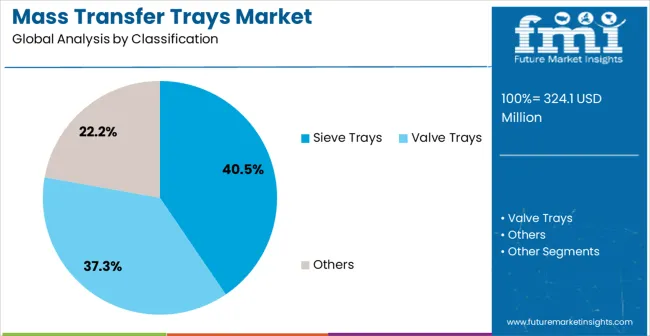
By Tray Type, the Sieve Trays Segment Leads the Market

Mass Transfer Trays Market Analysis By Classification

The sieve trays segment is projected to maintain its leading position in the mass transfer trays market in 2025, reaffirming its role as the preferred tray configuration category for general distillation and separation applications. Chemical process engineers and plant operators increasingly utilize sieve trays for their simple design characteristics, cost-effective manufacturing, and reliable performance across various separation scenarios and operating conditions. Sieve tray technology's proven effectiveness and operational simplicity directly address the processing requirements for efficient mass transfer and consistent separation performance in diverse chemical processing applications.

This tray-type segment forms the foundation of modern distillation column installations, as it represents the tray configuration with the greatest versatility and established performance record across multiple separation processes and chemical processing applications. Chemical plant investments in sieve tray systems continue to strengthen adoption among process engineers and operations teams. With separation applications requiring reliable mass transfer and operational consistency, sieve trays align with both performance objectives and cost-effectiveness requirements, making them the central component of comprehensive distillation strategies.
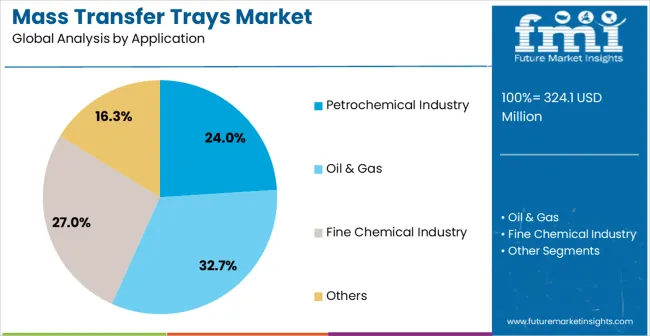
By Application, the Petrochemical Industry Segment Dominates Market Demand

Mass Transfer Trays Market Analysis By Application

The petrochemical industry application segment is projected to represent the largest share of mass transfer trays demand in 2025, underscoring its critical role as the primary driver for separation equipment adoption across refining operations, chemical synthesis facilities, and petrochemical processing plants. Petrochemical operators prefer mass transfer trays for separation processes due to their high-volume processing capabilities, reliable separation performance, and ability to handle diverse chemical mixtures while supporting continuous operations and product quality requirements. Positioned as essential equipment for modern petrochemical operations, mass transfer trays offer both efficiency advantages and operational benefits.

The segment is supported by continuous innovation in petrochemical processing technologies and the growing availability of specialized tray systems that enable effective separation with enhanced efficiency and operational reliability. Additionally, petrochemical operators are investing in advanced separation programs to support large-scale production requirements and product quality objectives. As petrochemical processing becomes more complex and efficiency requirements increase, the petrochemical industry application will continue to dominate the market while supporting advanced tray utilization and process optimization strategies.

What are the Drivers, Restraints, and Key Trends of the Mass Transfer Trays Market?

The mass transfer trays market is advancing steadily due to increasing demand for efficient chemical processing and growing adoption of advanced separation technologies that provide enhanced mass transfer efficiency and process optimization across diverse petrochemical and industrial applications. However, the market faces challenges, including high capital investment costs for advanced tray systems, technical complexity in design optimization and installation, and competition from alternative separation technologies such as structured packing. Innovation in computational fluid dynamics and advanced materials continues to influence product development and market expansion patterns.

Expansion of Advanced Tray Design and Computational Fluid Dynamics Optimization

The growing adoption of computational fluid dynamics modeling and advanced tray design optimization is enabling process engineers to achieve superior mass transfer efficiency, reduced pressure drop, and enhanced separation performance for demanding chemical processing applications. Advanced design systems provide improved separation effectiveness while allowing more precise optimization and consistent performance across various operating conditions and chemical systems. Manufacturers are increasingly recognizing the competitive advantages of CFD-optimized design capabilities for performance differentiation and process optimization.

Integration of Digitalization and Process Monitoring Technologies

Modern mass transfer tray manufacturers are incorporating digital monitoring technologies and process optimization systems to enhance separation performance, enable predictive maintenance, and provide comprehensive process control through integrated monitoring and data analysis platforms. These technologies improve operational efficiency while enabling new applications, including real-time optimization and automated process control. Advanced digital integration also allows operators to support comprehensive process management and performance optimization beyond traditional manual operation approaches.
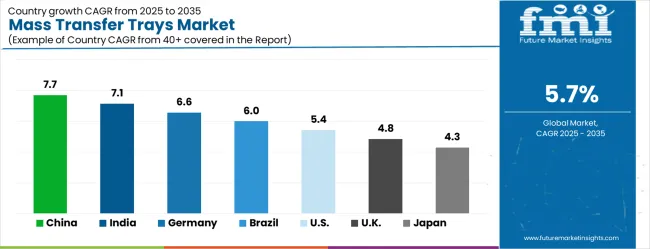
Analysis of the Mass Transfer Trays Market by Key Countries

Mass Transfer Trays Market Cagr Analysis By Country

Country CAGR (2025-2035)
China 7.7%
India 7.1%
Germany 6.6%
Brazil 6.0%
USA 5.4%
UK 4.8%
Japan 4.3%

The mass transfer trays market is experiencing solid growth globally, with China leading at a 7.7% CAGR through 2035, driven by the expanding chemical processing industry, growing petrochemical capacity, and significant investment in industrial separation technology advancement and chemical plant modernization. India follows at 7.1%, supported by rapid industrial development, increasing chemical manufacturing capacity, and growing adoption of advanced process technologies in the petrochemical and fine chemical industries. Germany shows growth at 6.6%, emphasizing precision engineering and advanced separation technology development. Brazil records 6.0%, focusing on petrochemical industry expansion and chemical processing modernization initiatives. The USA demonstrates 5.4% growth, supported by established chemical processing infrastructure and emphasis on process optimization. The UK exhibits 4.8% growth, emphasizing chemical industry efficiency and advanced processing technologies. Japan shows 4.3% growth, supported by advanced chemical technologies and precision process equipment manufacturing. The report covers an in-depth analysis of 40+ countries; seven top-performing countries are highlighted below.

Sales Forecast for Mass Transfer Trays Market in China

The mass transfer trays market in China is expanding at a CAGR of 7.7%, fueled by the country’s booming industrial sectors, particularly in chemicals, petrochemicals, and energy production. China’s growing chemical manufacturing base and energy consumption drive the demand for efficient separation technologies like mass transfer trays in distillation columns and other separation units. The government’s focus on improving industrial efficiency and environmental sustainability further supports the adoption of advanced mass transfer systems in both existing and new plants. China’s massive infrastructure development and manufacturing capabilities continue to fuel the market.

  • China’s industrial growth strengthens demand for mass transfer trays.
  • Government focus on efficiency and sustainability accelerates adoption.
  • Chemical, petrochemical, and energy sectors drive market expansion in China.

In-depth Review of Mass Transfer Trays Market in India

The mass transfer trays market in India is projected to grow at a CAGR of 7.1%, driven by industrial expansion, particularly in the oil and gas, chemical, and pharmaceutical sectors. India’s growing demand for energy and chemicals drives the adoption of mass transfer trays in separation and purification processes. The country’s ongoing investments in refinery upgrades, wastewater treatment infrastructure, and chemical manufacturing technologies further support market growth. As industries seek to optimize production efficiency and reduce energy consumption, the demand for advanced mass transfer systems continues to rise.

  • Industrial expansion in India drives demand for efficient separation technologies.
  • Government investments in infrastructure support the adoption of mass transfer trays.
  • Energy, oil, gas, and chemical sectors fuel market growth.

Growth Outlook for Mass Transfer Trays Market in Germany

The mass transfer trays market in Germany is growing at a CAGR of 6.6%, driven by the demand for high-efficiency separation systems in chemical, petrochemical, and environmental industries. Germany’s focus on sustainable energy, emissions control, and industrial automation strengthens the adoption of advanced mass transfer systems in its manufacturing base. The country’s commitment to reducing carbon footprints and improving operational efficiency in chemical and energy production contributes to the steady growth of mass transfer trays.

  • Sustainability trends and emission control policies drive adoption in Germany.
  • Industrial automation and efficiency optimization support market growth.
  • Chemical and petrochemical industries continue to be key drivers of demand.

Market Assessment for Mass Transfer Trays Market in Brazil

The mass transfer trays market in Brazil is projected to grow at a CAGR of 6.0%, supported by the growth of industries such as oil and gas, chemicals, and food processing. Brazil’s expanding infrastructure and investment in energy production, especially renewable energy and oil refining, are fueling the adoption of efficient separation systems. As Brazil modernizes its industrial sector and strengthens environmental standards, the demand for high-performance mass transfer trays in various separation processes continues to grow.

  • Oil, gas, and chemical sectors drive demand for mass transfer trays in Brazil.
  • Investment in renewable energy and energy production supports adoption.
  • Modernization of industrial infrastructure strengthens market growth in Brazil.

Opportunity Analysis for Mass Transfer Trays Market in the US

The mass transfer trays market in the United States is growing at a CAGR of 5.4%, fueled by the demand for high-efficiency separation technologies in the chemical, petrochemical, and environmental sectors. As the USA focuses on increasing energy efficiency, reducing emissions, and enhancing production processes, the adoption of advanced mass transfer trays continues to rise. Strong investments in upgrading chemical processing plants, along with the rising need for more sustainable operations, support the steady market growth.

  • Energy efficiency and emissions reduction policies fuel adoption in the USA
  • Investments in upgrading chemical processing infrastructure support growth.
  • Environmental regulations and the demand for sustainability strengthen market demand.

Revenue Prospects for Mass Transfer Trays Market in the UK

The mass transfer trays market in the United Kingdom is growing at a CAGR of 4.8%, driven by demand from industries such as chemicals, pharmaceuticals, and energy. The UK’s focus on reducing industrial emissions and improving production efficiency supports the adoption of advanced mass transfer technologies in various manufacturing sectors. As the country invests in sustainable energy solutions and modernizes industrial infrastructure, the demand for high-efficiency separation systems like mass transfer trays continues to rise.
  • Regulatory focus on emissions reduction supports market growth in the UK
  • Industrial modernization and energy efficiency drive demand for advanced mass transfer trays.
  • Chemical, pharmaceutical, and energy sectors fuel the adoption of advanced systems in the UK

Demand Assessment for Mass Transfer Trays Market in Japan

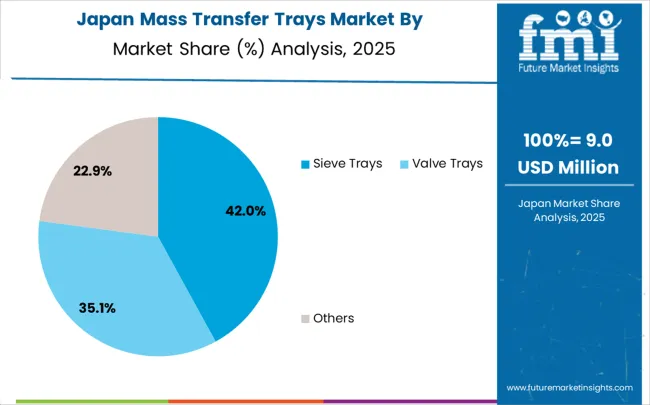
Mass Transfer Trays Market Japan Market Share Analysis By Classification

The mass transfer trays market in Japan is expanding at a CAGR of 4.3%, supported by increasing demand for efficient separation systems in petrochemical, food, and environmental industries. Japan’s focus on operational excellence and sustainability, along with its highly developed industrial sector, continues to drive market demand for mass transfer trays. The need for reducing energy consumption and optimizing production processes in chemical and oil refining operations further accelerates the adoption of advanced separation technologies.
  • Sustainability and energy efficiency concerns drive demand in Japan.
  • Petrochemical, chemical, and food processing industries fuel market growth.
  • Industrial optimization and environmental regulations support market expansion in Japan.

Europe Market Split by Countries

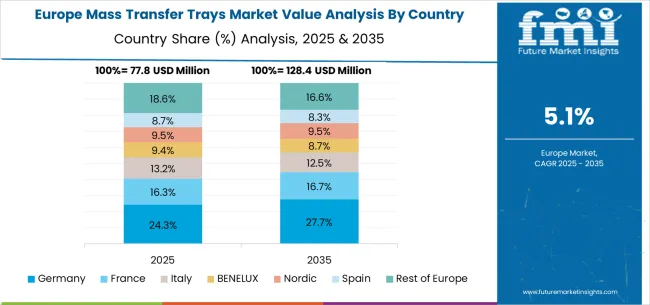
Mass Transfer Trays Market Europe Country Market Share Analysis, 2025 & 2035

The mass transfer trays market in Europe is projected to grow from USD 117.7 million in 2025 to USD 191.8 million by 2035, registering a CAGR of 5.0% over the forecast period. Germany is expected to maintain its leadership position with a 28.0% market share in 2025, moderating slightly to 27.8% by 2035, supported by its strong chemical industry, advanced process engineering sector, and comprehensive separation technology infrastructure serving major European markets.

The United Kingdom follows with 21.0% in 2025, projected to reach 20.8% by 2035, driven by established chemical industry efficiency focus, comprehensive process optimization framework, and advanced separation technology programs. France holds 18.5% in 2025, rising to 18.7% by 2035, supported by chemical industry leadership and growing adoption of advanced process technologies. Italy commands 13.5% in 2025, projected to reach 13.6% by 2035, while Spain accounts for 8.5% in 2025, expected to reach 8.6% by 2035. The Netherlands maintains a 4.0% share in 2025, growing to 4.1% by 2035. The Rest of Europe region, including Nordic countries, Eastern Europe, and other markets, is anticipated to maintain its position, holding its collective share at 6.5% by 2035, attributed to increasing chemical industry modernization and growing advanced separation technology adoption across emerging process markets implementing modern separation standards.

Competitive Landscape of the Mass Transfer Trays Market

The mass transfer trays market is characterized by competition among established process equipment manufacturers, specialized separation technology companies, and integrated chemical processing solution providers. Companies are investing in advanced tray design research, computational fluid dynamics optimization, manufacturing excellence, and comprehensive product portfolios to deliver efficient, reliable, and high-performance mass transfer tray solutions. Innovation in advanced materials, tray geometry optimization, and digital process integration is central to strengthening market position and competitive advantage.

Koch-Glitsch leads the market with comprehensive separation technology solutions, offering advanced mass transfer trays with a focus on separation efficiency and process optimization across diverse chemical processing applications. RVT Process Equipment provides specialized process equipment with an emphasis on custom separation solutions and process engineering support. Sulzer delivers innovative process technologies with a focus on the chemical and petrochemical industries, with comprehensive separation capabilities. Raschig specializes in process internals and separation technologies with emphasis on mass transfer optimization and process efficiency. Saiptech focuses on separation equipment with emphasis on advanced design and process integration. Honeywell offers comprehensive process solutions with an emphasis on automation and process optimization.

Key Players in the Mass Transfer Trays Market

  • Koch-Glitsch
  • RVT Process Equipment
  • Sulzer
  • Raschig
  • Saiptech
  • Honeywell
  • Montz
  • Finepac
  • AMACS
  • Beiyang National Distillation Technology
  • Chemdist Group
  • Nantong Sutong Separation Technology
  • Changsha Boneng Technology Co., Ltd
  • Zehua Chemical Engineering
  • AMT International, Inc.

Scope of the Report

Items Values
Quantitative Units (2025) USD 324.1 million
Tray Type Sieve Trays, Valve Trays, Others
Application Petrochemical Industry, Oil & Gas, Fine Chemical Industry, Others
Regions Covered Asia Pacific, North America, Europe, Latin America, Middle East & Africa
Countries Covered China, India, Germany, Brazil, the United States, the United Kingdom, Japan, and 40+ countries
Key Companies Profiled Koch-Glitsch, RVT Process Equipment, Sulzer, Raschig, Saiptech, and Honeywell
Additional Attributes Dollar sales by tray type and application category, regional demand trends, competitive landscape, technological advancements in separation systems, CFD optimization development, process integration innovation, and mass transfer efficiency optimization

Mass Transfer Trays Market by Segments

Tray Type:

  • Sieve Trays
  • Valve Trays
  • Others

Application:

  • Petrochemical Industry
  • Oil & Gas
  • Fine Chemical Industry
  • Others

Region:

Asia Pacific

  • China
  • India
  • Japan
  • South Korea
  • ASEAN
  • Australia & New Zealand
  • Rest of Asia Pacific

North America

  • United States
  • Canada
  • Mexico

Europe

  • Germany
  • United Kingdom
  • France
  • Italy
  • Spain
  • Nordic
  • BENELUX
  • Rest of Europe

Latin America

  • Brazil
  • Chile
  • Argentina
  • Rest of Latin America

Middle East & Africa

  • Kingdom of Saudi Arabia
  • Other GCC Countries
  • Turkey
  • South Africa
  • Other African Union
  • Rest of Middle East & Africa

Table of Content

  1. Executive Summary
    • Global Market Outlook
    • Demand to side Trends
    • Supply to side Trends
    • Technology Roadmap Analysis
    • Analysis and Recommendations
  2. Market Overview
    • Market Coverage / Taxonomy
    • Market Definition / Scope / Limitations
  3. Market Background
    • Market Dynamics
      • Drivers
      • Restraints
      • Opportunity
      • Trends
    • Scenario Forecast
      • Demand in Optimistic Scenario
      • Demand in Likely Scenario
      • Demand in Conservative Scenario
    • Opportunity Map Analysis
    • Product Life Cycle Analysis
    • Supply Chain Analysis
    • Investment Feasibility Matrix
    • Value Chain Analysis
    • PESTLE and Porter’s Analysis
    • Regulatory Landscape
    • Regional Parent Market Outlook
    • Production and Consumption Statistics
    • Import and Export Statistics
  4. Global Market Analysis 2020 to 2024 and Forecast, 2025 to 2035
    • Historical Market Size Value (USD Million) Analysis, 2020 to 2024
    • Current and Future Market Size Value (USD Million) Projections, 2025 to 2035
      • Y to o to Y Growth Trend Analysis
      • Absolute $ Opportunity Analysis
  5. Global Market Pricing Analysis 2020 to 2024 and Forecast 2025 to 2035
  6. Global Market Analysis 2020 to 2024 and Forecast 2025 to 2035, By Classification
    • Introduction / Key Findings
    • Historical Market Size Value (USD Million) Analysis By Classification , 2020 to 2024
    • Current and Future Market Size Value (USD Million) Analysis and Forecast By Classification , 2025 to 2035
      • Sieve Trays
      • Valve Trays
      • Others
    • Y to o to Y Growth Trend Analysis By Classification , 2020 to 2024
    • Absolute $ Opportunity Analysis By Classification , 2025 to 2035
  7. Global Market Analysis 2020 to 2024 and Forecast 2025 to 2035, By Application
    • Introduction / Key Findings
    • Historical Market Size Value (USD Million) Analysis By Application, 2020 to 2024
    • Current and Future Market Size Value (USD Million) Analysis and Forecast By Application, 2025 to 2035
      • Petrochemical Industry
      • Oil & Gas
      • Fine Chemical Industry
      • Others
    • Y to o to Y Growth Trend Analysis By Application, 2020 to 2024
    • Absolute $ Opportunity Analysis By Application, 2025 to 2035
  8. Global Market Analysis 2020 to 2024 and Forecast 2025 to 2035, By Region
    • Introduction
    • Historical Market Size Value (USD Million) Analysis By Region, 2020 to 2024
    • Current Market Size Value (USD Million) Analysis and Forecast By Region, 2025 to 2035
      • North America
      • Latin America
      • Western Europe
      • Eastern Europe
      • East Asia
      • South Asia and Pacific
      • Middle East & Africa
    • Market Attractiveness Analysis By Region
  9. North America Market Analysis 2020 to 2024 and Forecast 2025 to 2035, By Country
    • Historical Market Size Value (USD Million) Trend Analysis By Market Taxonomy, 2020 to 2024
    • Market Size Value (USD Million) Forecast By Market Taxonomy, 2025 to 2035
      • By Country
        • USA
        • Canada
        • Mexico
      • By Classification
      • By Application
    • Market Attractiveness Analysis
      • By Country
      • By Classification
      • By Application
    • Key Takeaways
  10. Latin America Market Analysis 2020 to 2024 and Forecast 2025 to 2035, By Country
    • Historical Market Size Value (USD Million) Trend Analysis By Market Taxonomy, 2020 to 2024
    • Market Size Value (USD Million) Forecast By Market Taxonomy, 2025 to 2035
      • By Country
        • Brazil
        • Chile
        • Rest of Latin America
      • By Classification
      • By Application
    • Market Attractiveness Analysis
      • By Country
      • By Classification
      • By Application
    • Key Takeaways
  11. Western Europe Market Analysis 2020 to 2024 and Forecast 2025 to 2035, By Country
    • Historical Market Size Value (USD Million) Trend Analysis By Market Taxonomy, 2020 to 2024
    • Market Size Value (USD Million) Forecast By Market Taxonomy, 2025 to 2035
      • By Country
        • Germany
        • UK
        • Italy
        • Spain
        • France
        • Nordic
        • BENELUX
        • Rest of Western Europe
      • By Classification
      • By Application
    • Market Attractiveness Analysis
      • By Country
      • By Classification
      • By Application
    • Key Takeaways
  12. Eastern Europe Market Analysis 2020 to 2024 and Forecast 2025 to 2035, By Country
    • Historical Market Size Value (USD Million) Trend Analysis By Market Taxonomy, 2020 to 2024
    • Market Size Value (USD Million) Forecast By Market Taxonomy, 2025 to 2035
      • By Country
        • Russia
        • Poland
        • Hungary
        • Balkan & Baltic
        • Rest of Eastern Europe
      • By Classification
      • By Application
    • Market Attractiveness Analysis
      • By Country
      • By Classification
      • By Application
    • Key Takeaways
  13. East Asia Market Analysis 2020 to 2024 and Forecast 2025 to 2035, By Country
    • Historical Market Size Value (USD Million) Trend Analysis By Market Taxonomy, 2020 to 2024
    • Market Size Value (USD Million) Forecast By Market Taxonomy, 2025 to 2035
      • By Country
        • China
        • Japan
        • South Korea
      • By Classification
      • By Application
    • Market Attractiveness Analysis
      • By Country
      • By Classification
      • By Application
    • Key Takeaways
  14. South Asia and Pacific Market Analysis 2020 to 2024 and Forecast 2025 to 2035, By Country
    • Historical Market Size Value (USD Million) Trend Analysis By Market Taxonomy, 2020 to 2024
    • Market Size Value (USD Million) Forecast By Market Taxonomy, 2025 to 2035
      • By Country
        • India
        • ASEAN
        • Australia & New Zealand
        • Rest of South Asia and Pacific
      • By Classification
      • By Application
    • Market Attractiveness Analysis
      • By Country
      • By Classification
      • By Application
    • Key Takeaways
  15. Middle East & Africa Market Analysis 2020 to 2024 and Forecast 2025 to 2035, By Country
    • Historical Market Size Value (USD Million) Trend Analysis By Market Taxonomy, 2020 to 2024
    • Market Size Value (USD Million) Forecast By Market Taxonomy, 2025 to 2035
      • By Country
        • Kingdom of Saudi Arabia
        • Other GCC Countries
        • Turkiye
        • South Africa
        • Other African Union
        • Rest of Middle East & Africa
      • By Classification
      • By Application
    • Market Attractiveness Analysis
      • By Country
      • By Classification
      • By Application
    • Key Takeaways
  16. Key Countries Market Analysis
    • USA
      • Pricing Analysis
      • Market Share Analysis, 2024
        • By Classification
        • By Application
    • Canada
      • Pricing Analysis
      • Market Share Analysis, 2024
        • By Classification
        • By Application
    • Mexico
      • Pricing Analysis
      • Market Share Analysis, 2024
        • By Classification
        • By Application
    • Brazil
      • Pricing Analysis
      • Market Share Analysis, 2024
        • By Classification
        • By Application
    • Chile
      • Pricing Analysis
      • Market Share Analysis, 2024
        • By Classification
        • By Application
    • Germany
      • Pricing Analysis
      • Market Share Analysis, 2024
        • By Classification
        • By Application
    • UK
      • Pricing Analysis
      • Market Share Analysis, 2024
        • By Classification
        • By Application
    • Italy
      • Pricing Analysis
      • Market Share Analysis, 2024
        • By Classification
        • By Application
    • Spain
      • Pricing Analysis
      • Market Share Analysis, 2024
        • By Classification
        • By Application
    • France
      • Pricing Analysis
      • Market Share Analysis, 2024
        • By Classification
        • By Application
    • India
      • Pricing Analysis
      • Market Share Analysis, 2024
        • By Classification
        • By Application
    • ASEAN
      • Pricing Analysis
      • Market Share Analysis, 2024
        • By Classification
        • By Application
    • Australia & New Zealand
      • Pricing Analysis
      • Market Share Analysis, 2024
        • By Classification
        • By Application
    • China
      • Pricing Analysis
      • Market Share Analysis, 2024
        • By Classification
        • By Application
    • Japan
      • Pricing Analysis
      • Market Share Analysis, 2024
        • By Classification
        • By Application
    • South Korea
      • Pricing Analysis
      • Market Share Analysis, 2024
        • By Classification
        • By Application
    • Russia
      • Pricing Analysis
      • Market Share Analysis, 2024
        • By Classification
        • By Application
    • Poland
      • Pricing Analysis
      • Market Share Analysis, 2024
        • By Classification
        • By Application
    • Hungary
      • Pricing Analysis
      • Market Share Analysis, 2024
        • By Classification
        • By Application
    • Kingdom of Saudi Arabia
      • Pricing Analysis
      • Market Share Analysis, 2024
        • By Classification
        • By Application
    • Turkiye
      • Pricing Analysis
      • Market Share Analysis, 2024
        • By Classification
        • By Application
    • South Africa
      • Pricing Analysis
      • Market Share Analysis, 2024
        • By Classification
        • By Application
  17. Market Structure Analysis
    • Competition Dashboard
    • Competition Benchmarking
    • Market Share Analysis of Top Players
      • By Regional
      • By Classification
      • By Application
  18. Competition Analysis
    • Competition Deep Dive
      • Koch-Glitsch
        • Overview
        • Product Portfolio
        • Profitability by Market Segments (Product/Age /Sales Channel/Region)
        • Sales Footprint
        • Strategy Overview
          • Marketing Strategy
          • Product Strategy
          • Channel Strategy
      • RVT Process Equipment
      • Sulzer
      • Raschig
      • Saiptech
      • Honeywell
      • Montz
      • Finepac
      • AMACS
      • Beiyang National Distillation Technology
      • Chemdist Group
      • Nantong Sutong Separation Technology
      • Changsha Boneng Technology Co., Ltd
      • Zehua Chemical Engineering
      • AMT International, Inc.
  19. Assumptions & Acronyms Used
  20. Research Methodology

List of Tables

  • Table 1: Global Market Value (USD Million) Forecast by Region, 2020 to 2035
  • Table 2: Global Market Value (USD Million) Forecast by Classification , 2020 to 2035
  • Table 3: Global Market Value (USD Million) Forecast by Application, 2020 to 2035
  • Table 4: North America Market Value (USD Million) Forecast by Country, 2020 to 2035
  • Table 5: North America Market Value (USD Million) Forecast by Classification , 2020 to 2035
  • Table 6: North America Market Value (USD Million) Forecast by Application, 2020 to 2035
  • Table 7: Latin America Market Value (USD Million) Forecast by Country, 2020 to 2035
  • Table 8: Latin America Market Value (USD Million) Forecast by Classification , 2020 to 2035
  • Table 9: Latin America Market Value (USD Million) Forecast by Application, 2020 to 2035
  • Table 10: Western Europe Market Value (USD Million) Forecast by Country, 2020 to 2035
  • Table 11: Western Europe Market Value (USD Million) Forecast by Classification , 2020 to 2035
  • Table 12: Western Europe Market Value (USD Million) Forecast by Application, 2020 to 2035
  • Table 13: Eastern Europe Market Value (USD Million) Forecast by Country, 2020 to 2035
  • Table 14: Eastern Europe Market Value (USD Million) Forecast by Classification , 2020 to 2035
  • Table 15: Eastern Europe Market Value (USD Million) Forecast by Application, 2020 to 2035
  • Table 16: East Asia Market Value (USD Million) Forecast by Country, 2020 to 2035
  • Table 17: East Asia Market Value (USD Million) Forecast by Classification , 2020 to 2035
  • Table 18: East Asia Market Value (USD Million) Forecast by Application, 2020 to 2035
  • Table 19: South Asia and Pacific Market Value (USD Million) Forecast by Country, 2020 to 2035
  • Table 20: South Asia and Pacific Market Value (USD Million) Forecast by Classification , 2020 to 2035
  • Table 21: South Asia and Pacific Market Value (USD Million) Forecast by Application, 2020 to 2035
  • Table 22: Middle East & Africa Market Value (USD Million) Forecast by Country, 2020 to 2035
  • Table 23: Middle East & Africa Market Value (USD Million) Forecast by Classification , 2020 to 2035
  • Table 24: Middle East & Africa Market Value (USD Million) Forecast by Application, 2020 to 2035

List of Figures

  • Figure 1: Global Market Pricing Analysis
  • Figure 2: Global Market Value (USD Million) Forecast 2020-2035
  • Figure 3: Global Market Value Share and BPS Analysis by Classification , 2025 and 2035
  • Figure 4: Global Market Y to o to Y Growth Comparison by Classification , 2025-2035
  • Figure 5: Global Market Attractiveness Analysis by Classification
  • Figure 6: Global Market Value Share and BPS Analysis by Application, 2025 and 2035
  • Figure 7: Global Market Y to o to Y Growth Comparison by Application, 2025-2035
  • Figure 8: Global Market Attractiveness Analysis by Application
  • Figure 9: Global Market Value (USD Million) Share and BPS Analysis by Region, 2025 and 2035
  • Figure 10: Global Market Y to o to Y Growth Comparison by Region, 2025-2035
  • Figure 11: Global Market Attractiveness Analysis by Region
  • Figure 12: North America Market Incremental Dollar Opportunity, 2025-2035
  • Figure 13: Latin America Market Incremental Dollar Opportunity, 2025-2035
  • Figure 14: Western Europe Market Incremental Dollar Opportunity, 2025-2035
  • Figure 15: Eastern Europe Market Incremental Dollar Opportunity, 2025-2035
  • Figure 16: East Asia Market Incremental Dollar Opportunity, 2025-2035
  • Figure 17: South Asia and Pacific Market Incremental Dollar Opportunity, 2025-2035
  • Figure 18: Middle East & Africa Market Incremental Dollar Opportunity, 2025-2035
  • Figure 19: North America Market Value Share and BPS Analysis by Country, 2025 and 2035
  • Figure 20: North America Market Value Share and BPS Analysis by Classification , 2025 and 2035
  • Figure 21: North America Market Y to o to Y Growth Comparison by Classification , 2025-2035
  • Figure 22: North America Market Attractiveness Analysis by Classification
  • Figure 23: North America Market Value Share and BPS Analysis by Application, 2025 and 2035
  • Figure 24: North America Market Y to o to Y Growth Comparison by Application, 2025-2035
  • Figure 25: North America Market Attractiveness Analysis by Application
  • Figure 26: Latin America Market Value Share and BPS Analysis by Country, 2025 and 2035
  • Figure 27: Latin America Market Value Share and BPS Analysis by Classification , 2025 and 2035
  • Figure 28: Latin America Market Y to o to Y Growth Comparison by Classification , 2025-2035
  • Figure 29: Latin America Market Attractiveness Analysis by Classification
  • Figure 30: Latin America Market Value Share and BPS Analysis by Application, 2025 and 2035
  • Figure 31: Latin America Market Y to o to Y Growth Comparison by Application, 2025-2035
  • Figure 32: Latin America Market Attractiveness Analysis by Application
  • Figure 33: Western Europe Market Value Share and BPS Analysis by Country, 2025 and 2035
  • Figure 34: Western Europe Market Value Share and BPS Analysis by Classification , 2025 and 2035
  • Figure 35: Western Europe Market Y to o to Y Growth Comparison by Classification , 2025-2035
  • Figure 36: Western Europe Market Attractiveness Analysis by Classification
  • Figure 37: Western Europe Market Value Share and BPS Analysis by Application, 2025 and 2035
  • Figure 38: Western Europe Market Y to o to Y Growth Comparison by Application, 2025-2035
  • Figure 39: Western Europe Market Attractiveness Analysis by Application
  • Figure 40: Eastern Europe Market Value Share and BPS Analysis by Country, 2025 and 2035
  • Figure 41: Eastern Europe Market Value Share and BPS Analysis by Classification , 2025 and 2035
  • Figure 42: Eastern Europe Market Y to o to Y Growth Comparison by Classification , 2025-2035
  • Figure 43: Eastern Europe Market Attractiveness Analysis by Classification
  • Figure 44: Eastern Europe Market Value Share and BPS Analysis by Application, 2025 and 2035
  • Figure 45: Eastern Europe Market Y to o to Y Growth Comparison by Application, 2025-2035
  • Figure 46: Eastern Europe Market Attractiveness Analysis by Application
  • Figure 47: East Asia Market Value Share and BPS Analysis by Country, 2025 and 2035
  • Figure 48: East Asia Market Value Share and BPS Analysis by Classification , 2025 and 2035
  • Figure 49: East Asia Market Y to o to Y Growth Comparison by Classification , 2025-2035
  • Figure 50: East Asia Market Attractiveness Analysis by Classification
  • Figure 51: East Asia Market Value Share and BPS Analysis by Application, 2025 and 2035
  • Figure 52: East Asia Market Y to o to Y Growth Comparison by Application, 2025-2035
  • Figure 53: East Asia Market Attractiveness Analysis by Application
  • Figure 54: South Asia and Pacific Market Value Share and BPS Analysis by Country, 2025 and 2035
  • Figure 55: South Asia and Pacific Market Value Share and BPS Analysis by Classification , 2025 and 2035
  • Figure 56: South Asia and Pacific Market Y to o to Y Growth Comparison by Classification , 2025-2035
  • Figure 57: South Asia and Pacific Market Attractiveness Analysis by Classification
  • Figure 58: South Asia and Pacific Market Value Share and BPS Analysis by Application, 2025 and 2035
  • Figure 59: South Asia and Pacific Market Y to o to Y Growth Comparison by Application, 2025-2035
  • Figure 60: South Asia and Pacific Market Attractiveness Analysis by Application
  • Figure 61: Middle East & Africa Market Value Share and BPS Analysis by Country, 2025 and 2035
  • Figure 62: Middle East & Africa Market Value Share and BPS Analysis by Classification , 2025 and 2035
  • Figure 63: Middle East & Africa Market Y to o to Y Growth Comparison by Classification , 2025-2035
  • Figure 64: Middle East & Africa Market Attractiveness Analysis by Classification
  • Figure 65: Middle East & Africa Market Value Share and BPS Analysis by Application, 2025 and 2035
  • Figure 66: Middle East & Africa Market Y to o to Y Growth Comparison by Application, 2025-2035
  • Figure 67: Middle East & Africa Market Attractiveness Analysis by Application
  • Figure 68: Global Market - Tier Structure Analysis
  • Figure 69: Global Market - Company Share Analysis

Frequently Asked Questions

How big is the mass transfer trays market in 2025?

The global mass transfer trays market is estimated to be valued at USD 324.1 million in 2025.

What will be the size of mass transfer trays market in 2035?

The market size for the mass transfer trays market is projected to reach USD 564.1 million by 2035.

How much will be the mass transfer trays market growth between 2025 and 2035?

The mass transfer trays market is expected to grow at a 5.7% CAGR between 2025 and 2035.

What are the key product types in the mass transfer trays market?

The key product types in mass transfer trays market are sieve trays, valve trays and others.

Which application segment to contribute significant share in the mass transfer trays market in 2025?

In terms of application, petrochemical industry segment to command 24.0% share in the mass transfer trays market in 2025.

Explore Similar Insights

Future Market Insights

Mass Transfer Trays Market

Chat With

MaRIA

Hi There, I am MaRIA, Your Market Research Intelligence Assistant. How may I help you?