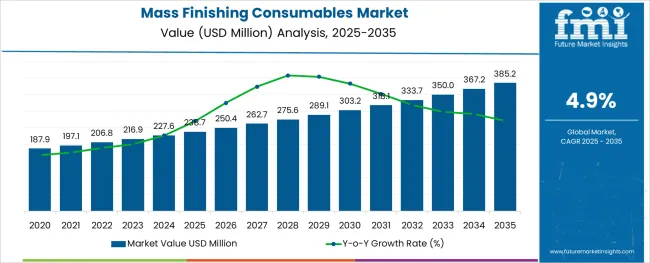
The Mass Finishing Consumables Market is estimated to be valued at USD 238.7 million in 2025 and is projected to reach USD 385.2 million by 2035, registering a compound annual growth rate (CAGR) of 4.9% over the forecast period.
The mass finishing consumables market is growing steadily, driven by the increasing adoption of surface finishing techniques across diverse manufacturing sectors. Industry insights highlight the importance of achieving precise surface quality and improved aesthetics for metal and plastic components. The demand for efficient and cost-effective deburring processes has fueled the growth of consumables that enhance productivity while maintaining high standards.
Manufacturers have been investing in durable and versatile media to meet the evolving requirements of various applications. The automotive sector’s expansion, with its focus on quality and performance, has significantly influenced market dynamics by demanding advanced finishing solutions.
Furthermore, growing automation and integration of finishing processes in production lines have increased the use of consumables. Future growth is expected as manufacturers seek to reduce production times and improve product reliability. Segmental growth is expected to be led by Ceramic media, Deburring applications, and the Automotive end-use industry due to their significant consumption and demand for precision finishing.
The market is segmented by Media Type, Application, and End-use Industry and region. By Media Type, the market is divided into Ceramic, Steel, Plastic, Aluminum Oxide, and Others (Wood, Agro-based, Special Plastic, Porcelain). In terms of Application, the market is classified into Deburring, Pressure Deburring, Grinding, Polishing, Cleaning & Degreasing, Descaling, Corrosion & Rust Removal, Ball Furnishing, and Surface Finish & Refinement. Based on End-use Industry, the market is segmented into Automotive, Aerospace, Construction, Machine Tooling, General Manufacturing, Jewellery and Accessories, and Healthcare. Regionally, the market is classified into North America, Latin America, Western Europe, Eastern Europe, Balkan & Baltic Countries, Russia & Belarus, Central Asia, East Asia, South Asia & Pacific, and the Middle East & Africa.
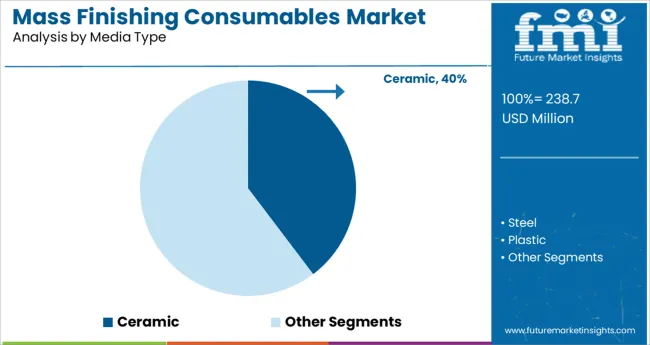
The Ceramic media segment is projected to account for 39.7% of the mass finishing consumables market revenue in 2025, holding its position as the leading media type. Ceramic media is preferred for its durability and effectiveness in smoothing and polishing metal surfaces while withstanding high mechanical stresses. Its versatility allows it to be used in a wide range of finishing processes including deburring, cleaning, and surface preparation.
The wear resistance and consistent performance of ceramic media have made it popular among manufacturers looking to optimize their finishing cycles. Additionally, ceramic media is compatible with both wet and dry finishing systems, providing flexibility in various manufacturing environments.
The segment’s growth is supported by its ability to deliver high-quality finishes while reducing media replacement frequency.
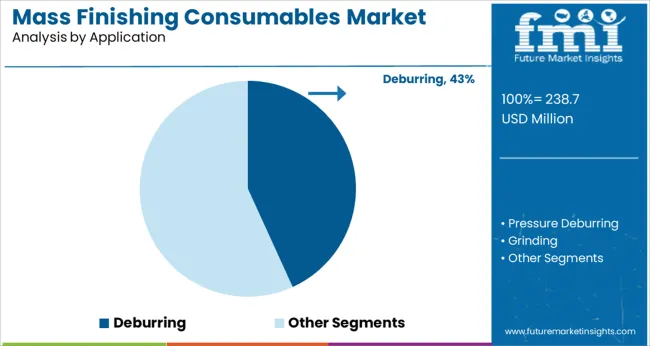
The Deburring application segment is expected to contribute 43.2% of the market revenue in 2025, establishing it as the dominant application area. Deburring is essential in removing sharp edges and unwanted material from manufactured parts, ensuring safety and functionality. The increasing complexity of parts and the demand for smoother finishes have amplified the use of mass finishing consumables in deburring processes.
Efficient deburring reduces manual labor and enhances productivity, making it a preferred choice in automated manufacturing lines. Additionally, stricter quality control standards and regulatory requirements for component safety have heightened the need for reliable deburring solutions.
This segment’s growth is reinforced by the broad adoption of mass finishing techniques in industries such as automotive and aerospace.
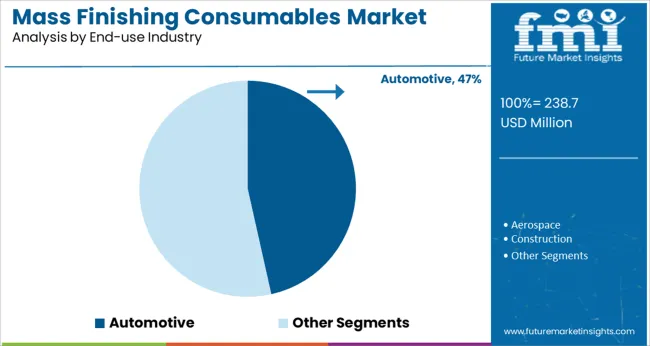
The Automotive end-use industry segment is projected to hold 46.5% of the mass finishing consumables market revenue in 2025, maintaining its leadership among industries. The automotive sector’s stringent quality and safety standards require precise surface finishing to improve component performance and aesthetics.
High production volumes and the complexity of automotive parts drive the demand for efficient finishing solutions that can meet tight tolerances and reduce defects. Manufacturers in this industry have increasingly integrated mass finishing processes to streamline production and achieve consistent quality.
The shift toward lightweight materials and electric vehicles has also introduced new finishing challenges that ceramic media and deburring applications can address effectively. The automotive industry’s continuous innovation and investment in manufacturing technologies position it as a major growth driver for the mass finishing consumables market.
| Market Statistics | Details |
|---|---|
| H1,2024 (A) | 4.5% |
| H1,2025 Projected (P) | 5.0% |
| H1,2025 Outlook (O) | 5.2% |
| BPS Change : H1,2025 (O) - H1,2025 (P) | (+) 20 ↑ |
| BPS Change : H1,2025 (O) - H1,2024 (A) | (+) 70 ↑ |
Future Market Insights presents a thorough study of the worldwide mass finishing consumables market for the preceding two years based on a six-month timeframe in this half-yearly research.
The study demonstrates how the anticipated CAGR from its previous report compares to the actual and updated CAGRs after taking into account all the macro-economic trends and industry trends changes that have occurred this year. According to the study, the business has grown quickly as a result of the increased demand for consumables for mass finishing across several end-use industries.
Sales of Mass Finishing consumables have recently surged as a result of the sharp growth in demand for surface-finishing products. According to FMI analysis, the variation between the BPS values observed in the mass finishing consumables market in H1, 2025 - Outlook over H1, 2025 Projected reflects a hike of 20 units. Moreover, compared to H1, 2024, the market is expected to spike by 70 BPS in H1 -2025.
Substantial growth in the manufacturing industry has been observed worldwide. Mass finishing consumables find a key role in metal production. Mass finishing operations are known to enhance the finishing of the metal products produced. With the increase in metal fabrication demand, sales of mass finishing consumables are also growing at a rapid pace.
Despite such high growth prospects of mass finishing consumables, certain challenges lie ahead in the success path for the growth of the market. Cutting-edge manufacturing technologies have made high-precision manufacturing possible which is expected to shrivel the growth rate of mass finishing consumables over the forecast period.
Sales of mass finishing consumables increased at a 4.7% CAGR, between 2014 and 2024, with countries such as the USA, China, Japan, Canada, and Germany accounting for a substantial portion of the global market. Sales prospects in 2024 and 2024 were dampened due to the outbreak of the COVID-19 pandemic, which reduced the demand for mass finishing consumables from several end-use domains such as automotive, aerospace, and construction.
Increasing demand for aesthetic and decorative as well as smooth finish parts and components for various operations and applications are likely to enhance the consumption of mass finishing media across various end-use industries.
Trade policy upgrades, increasing application areas, and advancing e-commerce are also expected to bode well for the global mass finishing consumables market in the forthcoming years. As a result, the mass finishing consumables market is projected to grow by value, at a 4.9% CAGR during the forecast period of 2025 to 2035.
Across the globe, the manufacturing sector is an essential component of the gross domestic product and holds more than a 16% share of the global economy. According to the Manufacturers Alliance for Productivity and Innovation (MAPI) Foundation, manufacturing is forecasted to witness faster growth than the general economy. Moreover, increased capital growth and higher exports are also expected to boost manufacturing and product production.
Favorable government conditions for manufacturers such as tax cuts, increased productivity, rising wages in emerging markets, etc., will accelerate the manufacturing sector growth in the upcoming years. Mass finishing consumables are utilized across various industries for the metal finishing, which makes up a major chunk of manufacturing processes in different industries.
The surge in manufacturing to meet the constant demand from the population is expected to provide an impetus to the demand for mass finishing consumables and urge manufacturers to boost their production and supply of the consumables.
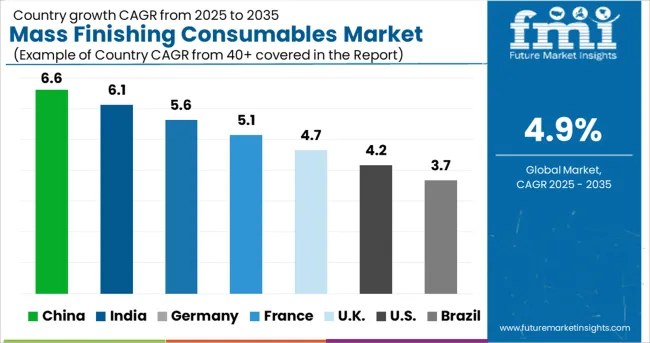
As per FMI, China is projected to account for nearly one-fourth of the global market share, creating an incremental opportunity of above USD 385.2 Million in 2035.
China is expected to remain the top-notch producer of mass finishing consumables across the globe. The country is a global leader in the automotive industry and is severely increasing production in the same, in the coming years. This is expected to augment the growth of the mass finishing consumables market in China.
The USA is projected to account for approximately 67.5% of the North American mass finishing consumables market in 2035. In 2025, the market is expected to grow by 4.9% year-on-year, reaching a valuation of USD 238.7 Million by the end of 2025.
In the USA, the domestic medical device manufacturing industry is very robust and hosts some of the largest med-tech corporations in the world. This is an important factor propelling the demand for mass finishing consumables in North America. Moreover, the presence of leading companies like Kramer Industries Inc. and Washington Mills is expected to bolster the growth of this chemical in the country.
Germany is projected to account for 28.5% of the Europe mass finishing consumables market share in 2035. The country is home to some leading players in the mass finishing consumables market. Companies such as Rösler Oberflächentechnik GmbH, and OTEC Präzisionsfinish GmbH, with their profit-bearing growth strategies and product innovations, are expected to propel sales of mass finishing consumables over the assessment period.
Sales of ceramic mass finishing consumables are expected to grow at an impressive value of 5.2% CAGR, over the forecast period of 2025 to 2035.
Ceramic mass finishing consumables are becoming increasingly preferred with future projections of the market indicating a higher demand for the same in the near future. This increase in sales can be attributed to the excellent thermal and electrical insulation properties of ceramic mass finishing consumables.
Ceramic media are most commonly used for deburring, radioing, and descaling, but can be used for cleaning, burnishing, and surface refinement as well. These are available without abrasives for polishing, and with extremely aggressive abrasives to process parts with heavy burrs, sharp edges, or deep machine lines. Owing to these factors, sales of ceramic mass finishing consumables are projected to increase over the forecast period.
Amongst the various applications, the deburring segment is projected to create an absolute dollar opportunity of more than USD 238.7 Million during the period of 2025 to 2035 and account for close to two-fourths share in the global mass finishing consumables market.
Deburring has the widest application in the mass finishing process due to the must requirement of removing raised particles and shavings from the produced product surfaces. This will continue providing tailwinds to mass finishing consumables sales over the assessment period.
The automotive end-use industry segment is projected to account for more than 27.7% of the total market share by 2035. The sales are anticipated to experience a year-over-year rate of 5.6% in 2025.
The rising on-road fleet has created a surge in requirement for surface finishing for automotive, resulting in lucrative growth opportunities for the mass finishing equipment, which in turn, is expected to propel the demand for mass finishing consumables for various manufacturing operations. Moreover, robotic finishing machines are also used in manufacturing industries such as automotive manufacturing plants, the aerospace industry, and medical equipment, among others. Therefore, the growing demand for robots is expected to stimulate the sales of mass finishing equipment in the upcoming years.
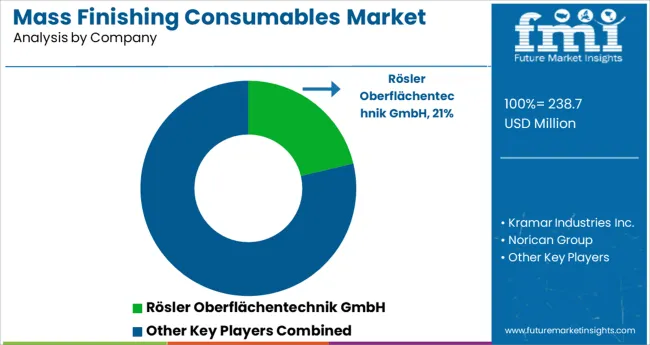
Leading players operating in the mass finishing consumables market are investing in strategic acquisitions, and are focusing on the development and launch of new brands for mass finishing consumables. Apart from this, players are focusing on expanding their production capacities to serve more end users, in order to gain a competitive edge.
For instance:
| Attribute | Details |
|---|---|
| Forecast Period | 2025 to 2035 |
| Historical Data Available for | 2020 to 2024 |
| Market Analysis | million for Value and Tons for Volume |
| Key Regions Covered | North America; Latin America; Europe; South Asia; East Asia; Oceania; and the Middle East & Africa |
| Key Countries Covered | USA, Canada, Brazil, Mexico, Germany, United Kingdom, France, Spain, Russia, China, Japan, South Korea, India, Thailand, Malaysia, Indonesia, Australia & New Zealand, GCC Countries, Northern Africa, and South Africa |
| Key Segments Covered | Media Type, Application, End-use Industry, and Region |
| Key Companies Profiled | Rösler Oberflächentechnik GmbH; Norican Group; Sintokogio, Ltd.; Washington Mills; Kramer Industries Inc.; OTEC Präzisionsfinish GmbH; Abrasive Finishing Inc.; UM Abrasives Co.; Vibra Finish Company; Walther Trowal LLC; Advanced Finishing Technologies; Rotomex S.A. de C.V.; Spaleck Oberflächentechnik GmbH & Co. KG.; Tipton Corp. |
| Report Coverage | Market Forecast, Brand Share Analysis, Competition Intelligence, Drivers, Restraints, Opportunities and Threats Analysis, Market Dynamics and Challenges, Strategic Growth Initiatives |
| Customization & Pricing | Available upon Request |
The global mass finishing consumables market is estimated to be valued at USD 238.7 million in 2025.
It is projected to reach USD 385.2 million by 2035.
The market is expected to grow at a 4.9% CAGR between 2025 and 2035.
The key product types are ceramic, steel, plastic, aluminum oxide and others (wood, agro-based, special plastic, porcelain).
deburring segment is expected to dominate with a 43.2% industry share in 2025.


Full Research Suite comprises of:
Market outlook & trends analysis
Interviews & case studies
Strategic recommendations
Vendor profiles & capabilities analysis
5-year forecasts
8 regions and 60+ country-level data splits
Market segment data splits
12 months of continuous data updates
DELIVERED AS:
PDF EXCEL ONLINE
Massoia Bark Essential Oil Market Size and Share Forecast Outlook 2025 to 2035
Mass Transfer Trays Market Size and Share Forecast Outlook 2025 to 2035
Mass Loaded Vinyl (MLV) Market Size and Share Forecast Outlook 2025 to 2035
Mass Notification System in Healthcare Market Size and Share Forecast Outlook 2025 to 2035
Massage Therapy Service Market - Growth & Forecast 2025 to 2035
Massage Guns Market Analysis – Demand, Growth & Forecast 2025–2035
Massive Open Online Course Market Analysis – Growth, Trends & Forecast 2025 to 2035
Industry Share Analysis for Massage Therapy Service Providers
Mass Notification Systems Market Analysis by Component, Solution, Application, and Industry, and Region Through 2035
Massive MIMO Market
Massage Equipment Market
Biomass Hot Air Generator Furnace Market Size and Share Forecast Outlook 2025 to 2035
Biomass Pellets Market Size and Share Forecast Outlook 2025 to 2035
Biomass Gasification Market Size and Share Forecast Outlook 2025 to 2035
Biomass Boiler Market Size and Share Forecast Outlook 2025 to 2035
Hand Massager Market Size and Share Forecast Outlook 2025 to 2035
Europe Massage Therapy Service Market Size and Share Forecast Outlook 2025 to 2035
Vending Massage Chair Payment Solution Market Size and Share Forecast Outlook 2025 to 2035
Spatial Mass Spectrometry Market Size and Share Forecast Outlook 2025 to 2035
Woody Biomass Boiler Market Size and Share Forecast Outlook 2025 to 2035

Thank you!
You will receive an email from our Business Development Manager. Please be sure to check your SPAM/JUNK folder too.
Chat With
MaRIA