The Tire Pressure Monitoring System Market is estimated to be valued at USD 3.7 billion in 2025 and is projected to reach USD 6.5 billion by 2035, registering a compound annual growth rate (CAGR) of 5.9% over the forecast period.
The tire pressure monitoring system (TPMS) market is expanding steadily due to rising vehicle safety regulations, increasing consumer awareness regarding road safety, and growing integration of advanced automotive electronics. The market is being driven by the widespread adoption of intelligent systems that enhance fuel efficiency and reduce carbon emissions. Manufacturers are focusing on developing compact, cost-effective, and sensor-based systems that ensure accurate real-time monitoring.
The regulatory push from transportation authorities mandating TPMS installation in new vehicles across several regions has further accelerated adoption. The market outlook remains positive as automotive OEMs continue to integrate TPMS into electric and hybrid vehicles.
The demand for technologically advanced, durable, and connected monitoring systems is expected to intensify Growth rationale is based on the convergence of safety, sustainability, and connectivity trends that are reshaping modern vehicle design and maintenance practices, ensuring steady market expansion and increased penetration across both passenger and commercial vehicle categories.
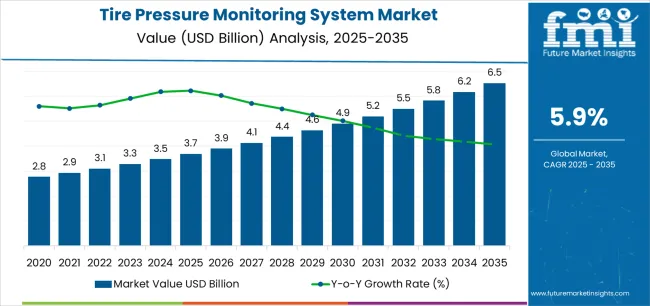
| Metric | Value |
|---|---|
| Tire Pressure Monitoring System Market Estimated Value in (2025 E) | USD 3.7 billion |
| Tire Pressure Monitoring System Market Forecast Value in (2035 F) | USD 6.5 billion |
| Forecast CAGR (2025 to 2035) | 5.9% |
The market is segmented by Technology, Sales Channel, and Vehicle Type and region. By Technology, the market is divided into Pressure Sensor, Ultrasonic Sensor, Lidar Sensor, Radar Sensor, Camera Sensor, and Infrared Sensor. In terms of Sales Channel, the market is classified into Original Equipment Manufacturer (OEM) and Aftermarket. Based on Vehicle Type, the market is segmented into Passenger Vehicle, Heavy Commercial Vehicle, and Light Commercial Vehicle. Regionally, the market is classified into North America, Latin America, Western Europe, Eastern Europe, Balkan & Baltic Countries, Russia & Belarus, Central Asia, East Asia, South Asia & Pacific, and the Middle East & Africa.
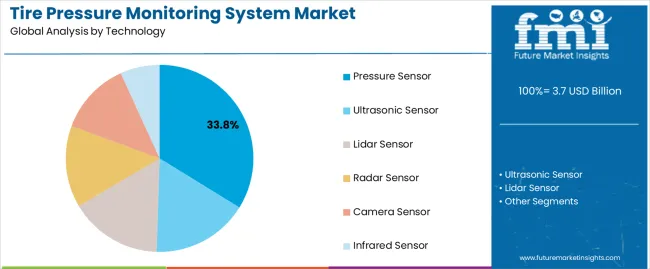
The pressure sensor segment, accounting for 33.80% of the technology category, has emerged as the leading technology due to its accuracy, reliability, and ability to provide real-time tire pressure data. Its market dominance is supported by wide-scale deployment in both OEM and aftermarket applications.
The demand has been reinforced by increasing adoption of direct TPMS configurations that rely heavily on pressure sensors for precise monitoring. Advancements in microelectromechanical systems (MEMS) technology have enhanced sensor efficiency, reduced size, and lowered production costs.
Manufacturers are focusing on integrating these sensors with vehicle telematics systems for improved diagnostics and performance analytics With ongoing emphasis on safety and compliance, the pressure sensor segment is expected to maintain its leadership as vehicle electrification and autonomous driving technologies create new opportunities for integration and performance optimization.
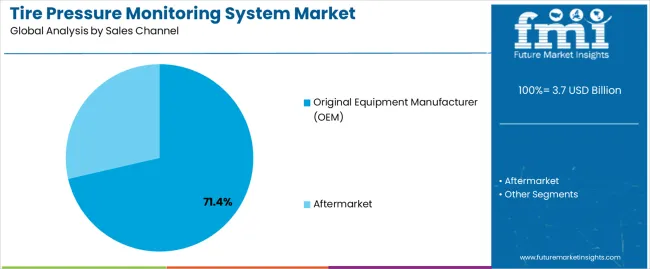
The original equipment manufacturer (OEM) segment, holding 71.40% of the sales channel category, has been dominating the market due to stringent safety mandates and the standardization of TPMS installation in new vehicles. OEMs have increasingly embedded TPMS as a core feature to comply with global regulatory frameworks and enhance brand differentiation.
The high share of OEM distribution is further supported by close collaboration between sensor manufacturers and automotive brands for seamless integration and testing. Continuous technological advancements have enabled OEMs to offer embedded and connected TPMS units that improve maintenance efficiency and reduce downtime.
The dominance of OEM sales is expected to persist as vehicle manufacturers expand smart safety portfolios and incorporate TPMS in hybrid and electric vehicle models to enhance reliability and fuel efficiency.
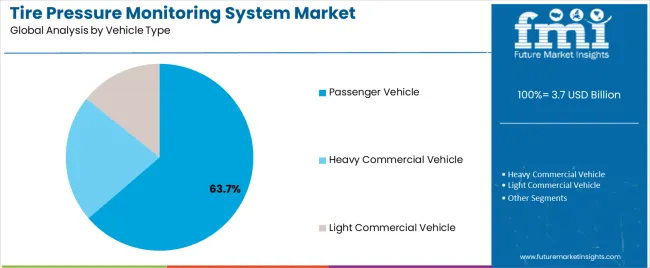
The passenger vehicle segment, representing 63.70% of the vehicle type category, has remained the leading end-use segment due to rising consumer demand for safety-equipped vehicles and expanding passenger car production worldwide. Growth in urban mobility, coupled with increasing awareness of vehicle safety standards, has significantly driven TPMS adoption in this segment.
OEM installation mandates in passenger cars across developed economies have further strengthened its position. Technological enhancements, such as wireless communication and battery-efficient sensors, have improved overall performance, ensuring higher reliability and minimal maintenance.
The segment’s sustained leadership is supported by growth in mid-range and premium vehicle categories where advanced monitoring features are standard Continued consumer emphasis on safety and efficiency, along with rapid electrification of the passenger vehicle fleet, is expected to uphold the segment’s dominance in the global TPMS market.
The automotive tire pressure monitoring system (TPMS) market encompasses industries manufacturing, selling, and implementing tire pressure monitoring systems, which are crucial for modern automobiles to ensure proper tire inflation and reduce accidents.
The tire pressure monitoring system market has grown significantly in recent years, driven by government regulations in developed countries to improve road safety and fuel efficiency and reduce CO2 emissions, particularly in vehicles.
The tire pressure monitoring system market is expected to experience a significant increase due to the growing use of sensor technologies in passenger vehicles, driven by the need for improved road safety, fuel efficiency, and reduced tire wear, attracting both manufacturers and consumers.
Low air pressure in tires negatively affects tire life, safety, and performance, while properly inflated tires reduce accidents caused by poor tire conditions, leading to an anticipated rise in tire pressure monitoring systems demand.
The development of real-time monitoring, predictive maintenance, and wireless connection has increased safety, fuel efficiency, and less tire wear and tear, increasing demand for tire pressure monitoring systems globally.
The tire pressure monitoring system industry has experienced a positive trend over the past five years, with a historical CAGR of 3.1%. The global TPMS market is projected to develop at a moderate CAGR of 6.2% until 2035.
| Historical CAGR | 3.1% |
|---|
The high initial prices of monitoring systems, lack of knowledge among manufacturers and customers, and regional variations in legislation are likely to restrict the tire pressure monitoring system (TPMS) market.
Crucial factors that are anticipated to influence the demand for tire pressure monitoring system through 2035.
Opportunities exist in emerging economies with a growing demand for TPMS systems due to the growing automotive sector and increased awareness of road safety regulations.
Provide bespoke tire pressure monitoring system options suited to certain car models, markets, or clientele requirements to help competitors stand out in a highly competitive sector.
Collaboration to incorporate tire pressure monitoring systems into future automobiles and take advantage of current distribution networks to grow the market with the help of automakers, telematics firms, and technology suppliers.
To meet the increasing need to update antiquated TPMS systems and retrofit older cars, businesses offer aftermarket services, including TPMS installation, maintenance, and repair.
Industry participants are going to desire to be wise and flexible over the anticipated period since these difficult attributes position the industry for success in subsequent decades.
Rise of Electric and Autonomous Vehicles Skyrockets Demand for TPMS
The increasing popularity of electric vehicles (EVs) and autonomous vehicles (AVs) has LED to a surge in demand for Tire Pressure Monitoring System (TPMS) solutions. EVs require real-time tire pressure monitoring to ensure correctly inflated tires, essential for enhancing energy efficiency and driving range.
AVs require accurate sensor data for safe operation, and tire pressure monitoring systems (TPMS) are crucial. These systems integrate with inputs like speed, acceleration, and road conditions for informed decisions.
They also offer predictive maintenance algorithms and real-time alerts to address tire issues, with the demand for these systems expected to grow in various industries.
The tire pressure monitoring system solutions are usually integrated with other vehicle systems, which enhances energy management and performance.
The growing adoption of EVs and AVs drives innovation in tire pressure monitoring system technology, focusing on energy efficiency, safety, and advanced sensor integration and developing high demand for tire pressure monitoring systems in manufacturing electric and autonomous vehicles in the forthcoming decade.
Advance Smartphone Integration Drives the Tire Pressure Monitoring System Demand
Integrating tire pressure monitoring systems (TPMS) with vehicle dashboards and smartphone apps provides drivers convenience and safety. By providing real-time updates on tire pressure and temperature, TPMS systems enable drivers to identify issues quickly and take necessary actions, thus preventing accidents or damage.
Therefore, there is a high demand for a tire pressure monitoring system with smartphone connectivity.
TPMS systems can alert drivers when tire pressure drops below or exceeds recommended levels, which helps prevent accidents or damages; the users have the ability to monitor the tire pressure on their smartphones, which propels the demand for TPMS solutions.
The tire pressure monitoring system uses TPMS data to provide reminders for routine tire maintenance tasks, ensuring proactive maintenance and tire longevity. Remote access allows drivers to check tire status and receive alerts, enhancing safety and reducing accident risk, thus increasing demand for this system.
The data integration in the global tire pressure monitoring system market increases driver awareness and enables proactive maintenance, resulting in safer and more efficient driving experiences; developing the tire pressure monitoring system in the smartphone propels the demand for TPMS.
Advancements in Sensor Technology Demands for the Reliable TPMS Solutions
The tire pressure monitoring system (TPMS) market is undergoing significant advancements due to developing sensors with enhanced accuracy, reliability, and durability. The automotive sensors provide precise tire pressure and temperature measurements, enabling drivers to monitor tire conditions more effectively. The accuracy reduces the risk of underinflation or overinflation-related issues.
Driver trust is increased because of the enhanced sensor dependability, which guarantees a reliable data supply without frequent failures.
These sensors' increased resilience allows them to endure challenging environmental circumstances while maintaining operational dependability. Monitoring tire temperature and pressure in real-time is feasible, allowing drivers to spot abnormalities and implement remedial measures.
Because of these sensors' longer lifespan, there is less need for regular replacements or repairs, which lowers maintenance costs and ensures dependable and continuous tire monitoring. The development of advanced automobile sensors drives a high demand for tire pressure monitoring systems.
A comprehensive analysis of certain tire pressure monitoring system market segments is provided in this section. The original equipment manufacturer (OEM) as the sales channel segment and the pressure sensor segment are the two primary subjects of the study.
This section aims to give readers a deeper understanding of these segments and their significance within the TPMS solutions business through a thorough analysis.
| Attributes | Details |
|---|---|
| Top Technology | Pressure Sensor |
| Market share in 2025 | 71.7% |
Pressure sensor technology is expected to dominate the tire pressure monitoring system market, accounting for over 71.7% of the market share in 2025; the following drives displays the growth of the demand for pressure sensors for the TPMS solutions:
| Attributes | Details |
|---|---|
| Top Sales Channel | Original Equipment Manufacturer (OEM) |
| Market share in 2025 | 97.2% |
In 2025, the original equipment manufacturers boosted the demand for tire pressure monitoring systems, acquiring a predominant market share of 97.2%. The development of OEM sales channels from the following drivers:
This section is highlights the growth rates of the tire pressure monitoring system market in the United States, China, Japan, India, and the United Kingdom, which are some of the most powerful countries in the global arena. Conduct a thorough analysis to examine the many factors impacting these countries' need for, acceptance of, and interactions with TPMS systems.
| Countries | CAGR from 2025 to 2035 |
|---|---|
| United States | 6.1% |
| United Kingdom | 5.1% |
| China | 13.1% |
| Japan | 12.9% |
| India | 12.8% |
The demand for tire pressure monitoring systems in the United States is expected to develop at a CAGR of 6.1%. The following factors are propelling the automobile industry's expanding demand for TPMS solutions:
The United Kingdom's automobile industry is developing the demand for TPMS solutions at a CAGR of 5.1% from 2025 to 2035. Here are a few of the major trends:
The vehicle manufacturing industry in China demands technological advancements in the tire pressure monitoring system, and the demand is predicted to extend at a CAGR of 13.1% between 2025 and 2035. Some of the primary trends in the industry are:
The tire pressure monitoring system market in Japan is expected to register a CAGR of 12.9% by 2035. Among the primary drivers are:
The demand for tire pressure monitoring systems in India is expected to register a CAGR of 12.8% from 2025 to 2035. Some of the primary trends are:
This section is highlights the growth rates of the tire pressure monitoring system market in the United States, China, Japan, India, and the United Kingdom, which are some of the most powerful countries in the global arena.
Conduct a thorough analysis to examine the many factors impacting these countries' need for, acceptance of, and interactions with TPMS systems.
In the automotive industry, the demand for high accuracy and durability has LED automakers to prefer products from major TPMS manufacturers. These key players have actively invested in research and development to integrate tire pressure monitoring systems with other safety-related solutions.
This has resulted in the emergence of advanced driver assistance systems based on TPMS, thus improving automotive safety.
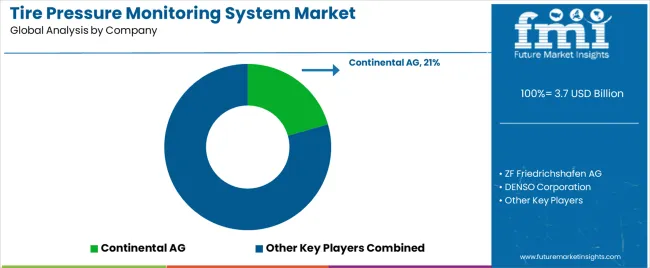
The tire pressure monitoring system market is witnessing significant growth with multiple big, medium, and small-scale TPMS developers, vehicle manufacturers, and service providers.
These established and emerging manufacturers are generating new sources of revenue by developing long-term relationships with original equipment manufacturers (OEMs) and advanced driver assistance systems (ADAS) TPMS manufacturers in target regions such as India and Europe.
Leading players in the TPMS market are also investing in cutting-edge sensor technologies to manufacture high-quality and multipurpose TPMS in the future. By doing so, the market players are poised to maintain their market dominance and meet the evolving demands of the automotive industry.
Recent Developments in the Tire Pressure Monitoring System Industry
| Countries | CAGR from 2025 to 2035 |
|---|---|
| United States | 6.1% |
| United Kingdom | 5.1% |
| China | 13.1% |
| Japan | 12.9% |
| India | 12.8% |
The demand for tire pressure monitoring systems in the United States is expected to develop at a CAGR of 6.1%. The following factors are propelling the automobile industry's expanding demand for TPMS solutions:
The United Kingdom's automobile industry is developing the demand for TPMS solutions at a CAGR of 5.1% from 2025 to 2035. Here are a few of the major trends:
The vehicle manufacturing industry in China demands technological advancements in the tire pressure monitoring system, and the demand is predicted to extend at a CAGR of 13.1% between 2025 and 2035. Some of the primary trends in the industry are:
The tire pressure monitoring system market in Japan is expected to register a CAGR of 12.9% by 2035. Among the primary drivers are:
The demand for tire pressure monitoring systems in India is expected to register a CAGR of 12.8% from 2025 to 2035. Some of the primary trends are:
The global tire pressure monitoring system market is estimated to be valued at USD 3.7 billion in 2025.
The market size for the tire pressure monitoring system market is projected to reach USD 6.5 billion by 2035.
The tire pressure monitoring system market is expected to grow at a 5.9% CAGR between 2025 and 2035.
The key product types in tire pressure monitoring system market are pressure sensor, ultrasonic sensor, lidar sensor, radar sensor, camera sensor and infrared sensor.
In terms of sales channel, original equipment manufacturer (oem) segment to command 71.4% share in the tire pressure monitoring system market in 2025.


Our Research Products

The "Full Research Suite" delivers actionable market intel, deep dives on markets or technologies, so clients act faster, cut risk, and unlock growth.

The Leaderboard benchmarks and ranks top vendors, classifying them as Established Leaders, Leading Challengers, or Disruptors & Challengers.

Locates where complements amplify value and substitutes erode it, forecasting net impact by horizon

We deliver granular, decision-grade intel: market sizing, 5-year forecasts, pricing, adoption, usage, revenue, and operational KPIs—plus competitor tracking, regulation, and value chains—across 60 countries broadly.

Spot the shifts before they hit your P&L. We track inflection points, adoption curves, pricing moves, and ecosystem plays to show where demand is heading, why it is changing, and what to do next across high-growth markets and disruptive tech

Real-time reads of user behavior. We track shifting priorities, perceptions of today’s and next-gen services, and provider experience, then pace how fast tech moves from trial to adoption, blending buyer, consumer, and channel inputs with social signals (#WhySwitch, #UX).

Partner with our analyst team to build a custom report designed around your business priorities. From analysing market trends to assessing competitors or crafting bespoke datasets, we tailor insights to your needs.
Supplier Intelligence
Discovery & Profiling
Capacity & Footprint
Performance & Risk
Compliance & Governance
Commercial Readiness
Who Supplies Whom
Scorecards & Shortlists
Playbooks & Docs
Category Intelligence
Definition & Scope
Demand & Use Cases
Cost Drivers
Market Structure
Supply Chain Map
Trade & Policy
Operating Norms
Deliverables
Buyer Intelligence
Account Basics
Spend & Scope
Procurement Model
Vendor Requirements
Terms & Policies
Entry Strategy
Pain Points & Triggers
Outputs
Pricing Analysis
Benchmarks
Trends
Should-Cost
Indexation
Landed Cost
Commercial Terms
Deliverables
Brand Analysis
Positioning & Value Prop
Share & Presence
Customer Evidence
Go-to-Market
Digital & Reputation
Compliance & Trust
KPIs & Gaps
Outputs
Full Research Suite comprises of:
Market outlook & trends analysis
Interviews & case studies
Strategic recommendations
Vendor profiles & capabilities analysis
5-year forecasts
8 regions and 60+ country-level data splits
Market segment data splits
12 months of continuous data updates
DELIVERED AS:
PDF EXCEL ONLINE
Pressure Monitoring Extension Tubing Sets Market Size and Share Forecast Outlook 2025 to 2035
Tire Inspection System Market - Outlook 2025 to 2035
Pressure-Volume Loop Systems Market Size and Share Forecast Outlook 2025 to 2035
Neuro-monitoring System Market Size and Share Forecast Outlook 2025 to 2035
Urine Monitoring Systems Market Analysis - Size, Trends & Forecast 2025 to 2035
Brain Monitoring Systems Market is segmented by Lateral Flow Readers and Kits and Reagents from 2025 to 2035
Yield Monitoring Systems Market
Driver Monitoring System Market Growth - Trends & Forecast 2025 to 2035
Tunnel Monitoring System Market Growth - Trends & Forecast 2025 to 2035
Air Pressure Booster System Market Growth - Trends & Forecast 2025 to 2035
Patient Monitoring System Market Size and Share Forecast Outlook 2025 to 2035
B-Ketone Monitoring System Market Size and Share Forecast Outlook 2025 to 2035
Pipeline Monitoring System Market Size and Share Forecast Outlook 2025 to 2035
Pet Blood Pressure Monitoring Devices Market Size and Share Forecast Outlook 2025 to 2035
Air Flow Monitoring System Market
Emission Monitoring Systems Market
Condition Monitoring System Market Size and Share Forecast Outlook 2025 to 2035
Market Share Breakdown of Condition Monitoring System Providers
Livestock Monitoring System Market
Remote ICU Monitoring System Market Size and Share Forecast Outlook 2025 to 2035

Thank you!
You will receive an email from our Business Development Manager. Please be sure to check your SPAM/JUNK folder too.
Chat With
MaRIA