Reports

- Global Locations -

Headquarters

Future Market Insights, Inc.

Christiana Corporate, 200
Continental Drive, Suite 401,
Newark, Delaware - 19713,
United States

T: +1-845-579-5705

Americas

Future Market Insights, Inc.

616 Corporate Way, Suite 2-9018,
Valley Cottage, NY 10989, United States

T: +1-347-918-3531

MEA

Future Market Insights

1602-6 Jumeirah Bay X2 Tower, Plot No: JLT-PH2-X2A,
Jumeirah Lakes Towers, Dubai,
United Arab Emirates

Europe

Future Market Insights

3rd Floor, 207 Regent Street,
W1B 3HH London
United Kingdom

T: + 44 (0) 20 8123 9659
D: +44 (0) 20 3287 4268

Asia Pacific

Future Market Insights

IndiaLand Global Tech Park, Unit UG-1, Behind Grand HighStreet, Phase 1, Hinjawadi, MH, Pune – 411057, India

Tire Cord Fabric Market Outlook for 2023 to 2033

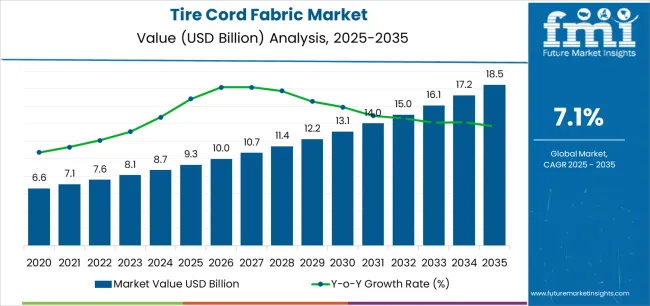
The tire cord fabric market is estimated to be valued at US$ 8,073.9 million in 2023. The tire cord fabric sales outlook suggests the valuation to cross US$ 16,031.7 million by 2033. The market's upward trajectory gains added momentum with a projected CAGR of 7.1% from 2023 to 2033. A key force driving this surge is the sustained expansion of the global automotive market. This intricate connection between the adoption of tire cord fabric and the thriving automotive sector forms a cornerstone in demand analysis.

Demand Analysis in the Tire Cord Fabric

  • Increasing technological advancements in tire manufacturing amplify the demand for specialized tire cord fabrics like steel tire cord fabric.
  • The rising consumer preference for durable tires fuels the demand for high-quality tire cord fabrics, reflecting a direct correlation in market dynamics.
  • Growing emphasis on sustainable practices in the automotive industry propels the demand for eco-friendly tire cord fabrics, aligning with environmental considerations.
  • Changes in regulations related to tire manufacturing impact the demand for compliant tire cord fabrics, emphasizing the need for adaptability in the market.
  • Increasing competition among tire manufacturers intensifies the need for innovative and high-performance tire cord fabrics, shaping market demand patterns.
  • Diverse applications of tire cord fabrics beyond traditional automotive use, such as in industrial and commercial sectors, contribute to shifting demand trends.
Attributes Details
Tire Cord Fabric Market Value for 2023 US$ 8,073.9 million
Tire Cord Fabric Market Value for 2033 US$ 16,031.7 million
Tire Cord Fabric Market Forecast CAGR for 2023 to 2033 7.1%

Don't pay for what you don't need

Customize your report by selecting specific countries or regions and save 30%!

Historical Performance and Future Growth of the Tire Cord Fabric Market

In this section, the analysis centers on the historical performance and future growth trajectory of the tire cord fabric market. The historical CAGR of 9.6% signifies a robust and accelerated expansion in the past, attributable to advancements in tire manufacturing technology, increased emphasis on durable and high-performance tires, and a thriving automotive industry. However, as the analysis transitions to the forecasted period, the projected CAGR stands at 7.1%, indicating a moderated but sustained growth pace. This adjustment is influenced by evolving market dynamics, changing consumer preferences, and global economic shifts.

Historical CAGR 9.6%
Forecast CAGR 7.1%

Short-term Analysis of Tire Cord Fabric Market from 2018 to 2022

2018 US$ 5,902.0 million
2022 US$ 7,541.2 million

In the short-term analysis from 2018 to 2022, the tire cord fabric market saw a steady revenue growth, with a notable increase from US$ 5,902.0 million in 2018 to US$ 7,541.2 million in 2022. Several factors contributed to this growth:

  • The automotive industry witnessed a surge in production during this period, particularly in emerging markets. As a result, the demand for tires, and consequently tire cord fabric, rose steadily.
  • Manufacturers invested in research and development, leading to the production of high-performance tire cord fabrics. These advanced materials found favor among tire manufacturers looking to enhance tire durability and safety.
  • The global economy rebounded after the 2008 financial crisis, leading to increased consumer spending and a subsequent uptick in the automotive sector. This economic resurgence positively impacted tire cord fabric sales.
  • The tire industry saw a significant shift towards radial tires due to their fuel efficiency and superior handling characteristics. Radial tires require more reinforcing materials, boosting the demand for tire cord fabric.

Mid-term Analysis of Tire Cord Fabric Market from 2023 to 2028

2023 US$ 8,073.9 million
2028 US$ 11,377.22 million

In the mid-term analysis covering 2023 to 2028, the tire cord fabric market is projected to continue its growth trajectory, with revenues expected to increase from US$ 8,073.9 million in 2023 to US$ 11,377.22 million in 2028. Key drivers for this growth include:

  • The global automotive fleet is expected to expand significantly, driven by rising urbanization and consumer demand. This expansion will fuel the need for more tires, directly benefiting the tire cord fabric market.
  • The emphasis on sustainability is likely to drive innovation in tire cord fabric materials. Eco-friendly alternatives are anticipated to gain prominence as tire manufacturers seek to reduce their carbon footprint and meet stringent environmental regulations.
  • Emerging markets are anticipated to play a crucial role in the market's growth. As these regions witness increased vehicle ownership, tire manufacturers will look to secure a stable supply of quality tire cord fabric.
  • Tire manufacturers are likely to continue to invest in advanced manufacturing technologies, which will necessitate higher-quality and more specialized tire cord fabrics to meet the demands of modern tire designs.

Long-term Analysis of Tire Cord Fabric Market from 2028 to 2033

2028 US$ 11,377.22 million
2033 US$ 16,031.7 million

In the long-term analysis from 2028 to 2033, the tire cord fabric market is poised for substantial growth, with revenues expected to surge from US$ 11,377.22 million in 2028 to US$ 16,031.7 million in 2033. Key factors driving this sustained growth include:

  • Evolving safety regulations are projected to necessitate the use of robust and more durable tire cord fabrics in tire manufacturing, further boosting demand.
  • The rise of electric vehicles (EVs) and autonomous vehicles (AVs) is anticipated to introduce new tire requirements, especially in terms of energy efficiency and durability. Tailored tire cord fabrics will be essential to meet these demands.
  • Megatrends such as urbanization, environmental consciousness, and changing mobility patterns will continue to shape the automotive industry, influencing tire cord fabric demand.
  • As vehicle manufacturers strive to reduce weight and improve fuel efficiency, they will seek lighter yet stronger tire cord fabrics. Innovations in this direction are likely to open new opportunities in the market.

Key Trends Influencing the Tire Cord Fabric Market

  • The industry is witnessing a significant shift towards tire cord fabric from sustainable materials. Sustainability concerns and regulatory pressures drive manufacturers to source raw materials responsibly and implement eco-friendly production processes.
  • The electric vehicle revolution is reshaping the market, with a growing demand for tire cord fabric for electric vehicles.
  • Manufacturers are investing in advanced materials in response to consumer demands for high-performance tires. High-performance tire cord fabric, often incorporating aramid and hybrid compositions, is becoming increasingly essential for meeting stringent performance criteria.
  • To improve fuel efficiency and reduce emissions, automotive manufacturers are focusing on lightweighting. This shift is driving demand for lightweight tire cord fabric that maintains tire strength while reducing overall tire weight.
  • Safety remains paramount, and tire cord fabric plays a critical role. Manufacturers are continually researching and developing tire cord fabric with improved durability to ensure tires meet safety standards and withstand challenging road conditions.
  • The players in the industry are exploring advanced materials such as aramid and rayon tire cord fabric to achieve optimal tire performance.
  • In pursuit of enhanced fuel efficiency, manufacturers are investing in tire cord fabric with reduced rolling resistance.
  • The development of hybrid tire cord fabric is gaining traction, offering a versatile solution that combines the advantages of various materials. Hybrid fabrics provide a balanced approach to meet tire performance and sustainability goals.
Nikhil Kaitwade
Nikhil Kaitwade

Principal Consultant

Talk to Analyst

Find your sweet spots for generating winning opportunities in this market.

Comparative View of Adjacent Tire Cord Fabric Market

In this dedicated section, there is a comprehensive comparative overview offered, with a focus on three closely related markets. Each of these markets possesses unique attributes, promising growth opportunities, and emerging trends, making them subjects of keen interest for industry observers and stakeholders.

The section below compares two adjacent markets alongside the tire cord fabric market- the tire cord market and the coated fabrics market. The table highlights the driving forces, CAGRs, and key market opportunities for these markets in the coming decade.

The detailed exploration aims to focus on the diverse characteristics and dynamics characterizing these interconnected markets. By closely examining their individual attributes, one can discern the distinctive factors propelling growth and transformation within each sector.

Tire Cord Fabric Market:

Attributes Tire Cord Fabric Market
CAGR (2023 to 2033) 7.1%
Market Value (2023) US$ 8,073.9 million
Growth Factor Rising demand driven by the electric vehicle (EV) revolution and sustainability concerns.
Opportunity Innovations in lightweight and eco-friendly materials for high-performance tires.
Key Trends Focus on sustainability with sustainable materials and reduced rolling resistance

Tire Cord Market:

Attributes Tire Cord Market
CAGR (2023 to 2033) 7.8%
Market Value (2023) US$ 15.7 billion
Growth Factor Expanding global automotive fleet across various vehicle segments
Opportunity Supplying versatile tire cords for different tire types and sizes
Key Trends Utilizing performance-driven materials for enhanced tire safety and efficiency

Coated Fabrics Market:

Attributes Coated Fabrics Market
CAGR (2023 to 2033) 5%
Market Value (2023) US$ 45.3 billion
Growth Factor Diverse applications beyond automotive in sectors like aerospace and industrial
Opportunity Exploring versatile applications in various industries
Key Trends Innovation in specialized coatings for improved durability and functionality

Category-wise Insights

In this segment, the report delves into critical aspects of the tire market, categorizing its insights based on significant attributes. This section serves as a valuable reference point for industry stakeholders and market observers, offering a snapshot of the dominant trends and preferences within the tire cord fabric industry. It sheds light on the significance of radial tires and the enduring demand for tires in the passenger car segment, providing essential insights for strategic decision-making.

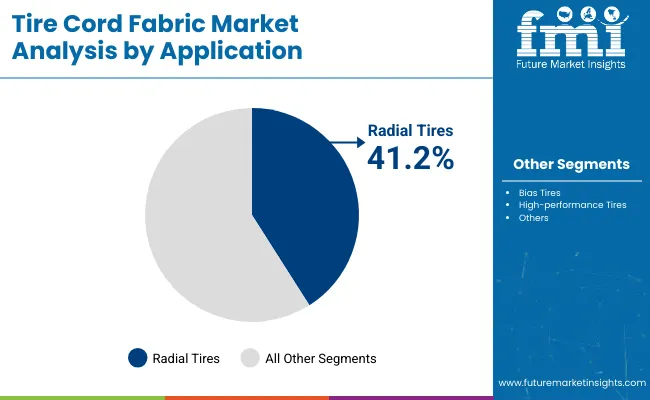
Radial Tires Secure Their Position as Market Leaders

Attributes Details
Top Tire Type Radial
Market Share in 2023 41.20%

With an impressive 41.20% market share in 2023, radial tires enjoy robust consumer trust. Companies can capitalize on this strong preference.

  • Radial tires' prominence hinges on their efficiency, safety, and superior performance. Investors and manufacturers should prioritize these attributes.
  • The market's faith in radial tires' durability translates to long-term value. Companies can emphasize durability in marketing strategies.
  • Radial tires' safety reputation, particularly in wet conditions, should guide product positioning and consumer communication.
  • Ongoing advancements in radial tire technology present opportunities for innovation, setting the stage for industry leaders.

Passenger Cars Emerge as the Top End User of Tire Cord Fabric

Attributes Details
Top End-use Type Passenger Cars
Market Share in 2023 36.70%

The 36.70% market share of passenger cars in 2023 is closely tied to global urbanization trends. Understanding this factor helps investors gauge sustained demand.

  • Passenger cars' appeal lies in their balance of affordability and functionality. Suppliers can tailor offerings to cater to diverse consumer needs.
  • Tire preferences for passenger cars align with eco-conscious consumer values. Manufacturers can explore environmentally friendly tire solutions.
  • The passenger car segment offers ample customization possibilities, which a facet tire manufacturer can leverage for tailored solutions.
  • Innovations in passenger car technology should guide tire manufacturers to align their offerings with evolving vehicle features and requirements, ensuring market relevance and competitiveness.

Get the data you need at a Fraction of the cost

Personalize your report by choosing insights you need
and save 40%!

Country-wise Insights

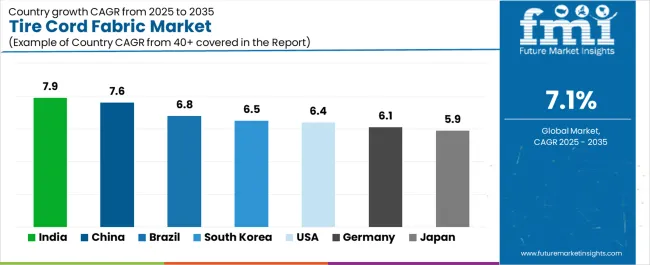
In this section, the report analyzes thoroughly the characteristics of key markets, revealing their respective value shares in the global market in 2023. This examination reveals the detailed aspects of each market's performance, allowing industry stakeholders, investors, and decision-makers to comprehend the regional trends that affect the global market. The significant 8.6% value share of the tire cord fabric market in India highlights its expanding significance and attractiveness for companies in the industry seeking opportunities for expansion in the country.

Attributes Details
Value Share of the United States Market in 2023 3.8%
Value Share of the Germany Market in 2023 2.9%
Value Share of the United Kingdom Market in 2023 3.3%
Value Share of China Market in 2023 8.2%
Value Share of India Market in 2023 8.6%
Value Share of Japan Market in 2023 4.3%

The United States Exhibits a Tire Cord Fabric Market Poised for Sluggish Growth

The United States holds a moderate 3.8% value share in the global tire cord fabric market in 2023. As one of the world's largest automotive markets, the United States witnesses a consistent demand for high-quality tires. However, the high cost of production is limiting the market potential. Anticipating the rising need for advanced tire cord fabric materials, the market may be ready for a pullback from a downtrend.

  • The culture of regular tire replacement in the United States ensures a continuous market for tire cord fabric. Safety concerns and the importance of well-maintained tires contribute to this trend.
  • The United States prioritizes research and development in tire technology. Innovations in tire cord fabric materials and manufacturing processes enhance the country's competitiveness.
  • Increasingly, United States consumers and manufacturers are inclined toward sustainable tire cord fabric materials, aligning with global environmental trends.

Tire Cord Fabric Market in Japan Carves a Niche with a Focus on Quality Over Quantity

Japan maintains a 4.3% value share in the global tire cord fabric market in 2023. Japan's technological innovations in tire cord fabric production lead to the creation of lightweight, durable, and high-performance materials, catering to evolving market demands.

  • Japanese tire cord fabric is synonymous with precision and quality. This reputation attracts manufacturers seeking exceptional materials for high-performance tires.
  • Japan excels in supplying specialized tire cord fabric for niche markets, such as racing and luxury vehicle segments. This niche focus ensures consistent demand for premium materials.
  • Japanese consumers prefer high-quality, long-lasting tires, resulting in a steady local demand for tire cord fabric.
  • Collaboration between Japanese manufacturers and global automotive giants fosters innovation and expands market reach for Japanese tire cord fabric.

Tire Cord Fabric Market in India to Accelerate at a Rapid Pace within a Thriving Automotive Hub

The tire cord fabric market in India is flourishing, with an impressive 8.6% value share in 2023, firmly establishing its presence in the global tire manufacturing landscape. India's automotive sector is on an upward trajectory, driven by rising disposable incomes and a growing middle-class population. This surge in the automotive industry translates into an escalating demand for tires, further underscoring the critical role of tire cord fabric in meeting this demand.

  • As an emerging market, India is experiencing a significant demographic shift with an expanding middle-class population. This demographic transition results in increased automobile ownership and heightened tire consumption, creating a substantial market for tire cord fabric.
  • India's cost-effective manufacturing environment offers a competitive edge for tire cord fabric production. This cost-efficiency attracts tire manufacturers looking for efficient sourcing of high-quality materials, positioning India as a key player in the global supply chain.
  • India's tire cord fabric market is embracing sustainability, with a growing inclination towards innovative and eco-friendly materials. This aligns with global sustainability trends, attracting environmentally conscious consumers and manufacturers alike.
  • India's tire cord fabric sector presents enticing investment opportunities amidst its rapid expansion, driven by automotive growth and sustainability initiatives.

China Establishes Dominance in the Tire Cord Fabric Market as a Global Manufacturing Powerhouse

China continues to assert its dominance with an impressive 8.2% value share in the tire cord fabric market in 2023. China's tire manufacturing capabilities are unparalleled, driven by the sheer scale of vehicle production. The country's status as the world's largest automobile market amplifies the demand for tires, thus highlighting the indispensable role of tire cord fabric in this thriving industry.

  • China's significance extends beyond its domestic market. It is a global exporter of tire cord fabric, underlining its role as a tire manufacturing hub with exceptional international reach.
  • China's tire industry has consistently attracted foreign investments, which further enhances the demand for high-quality tire cord fabric. This investment influx demonstrates the confidence of global players in China's market stability and growth potential.
  • China's tire cord fabric market continually benefits from cutting-edge technological advancements. These innovations not only cater to domestic demand but also position China as a leading innovator in tire cord fabric production, attracting discerning manufacturers.
  • China's market stability is a result of its comprehensive tire manufacturing ecosystem. Such stability fosters an environment where tire manufacturers and suppliers can thrive, making China a focal point for industry players worldwide.

Tire Cord Fabric Market in Germany Striking a Balance Between Precision and Innovation

Germany's tire cord fabric market maintains a notable 2.9% value share in 2023, reflecting its steady presence in the global tire manufacturing industry. Germany's tire cord fabric is in demand not only domestically but also internationally. Its tire cord fabric exports cater to a global clientele, expanding its market reach and influence.

  • Germany is renowned for its precision engineering, and this expertise extends to its tire cord fabric production. Tire manufacturers prefer German-made cord fabric for its consistent high quality and reliability.
  • Germany's commitment to innovation and technological advancement in tire cord fabric production ensures its competitiveness in the global market. This focus on research and development leads to the creation of high-performance materials.
  • In line with global sustainability trends, the German manufacturers are actively engaged in developing eco-friendly tire cord fabric materials.
  • Germany's reputation for automotive manufacturing excellence fuels a consistent demand for tire cord fabric. The country's premium vehicle brands rely on top-quality tire materials, further emphasizing the importance of German-made cord fabric in the industry.

United Kingdom to Maintain a Steady Performance in the Global Tire Cord Fabric Market

The tire cord fabric market in the United Kingdom secures a significant 3.3% value share in 2023, underscoring its increasing influence in the global market. The United Kingdom's tire cord fabric is recognized for its strict adherence to stringent quality standards, making it a preferred choice for manufacturers focused on producing premium tires.

  • The market actively engages in international trade, exporting tire cord fabric to diverse markets worldwide. This global outreach not only drives revenue but also enhances the country's reputation as a reliable supplier.
  • The United Kingdom's robust infrastructure supports efficient tire cord fabric production, aiding its market growth and expansion. A well-developed transportation network and access to key resources contribute to its competitive edge in the global market.

Companies Shaping the Future Outlook of the Tire Cord Fabric Industry

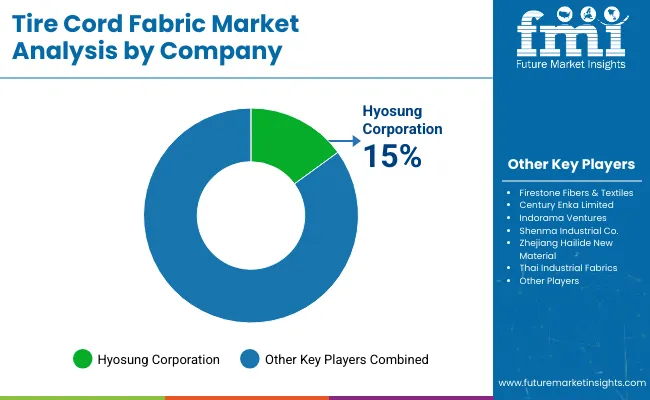
The tire cord fabric market presents a dynamic competitive landscape, where industry leaders are in constant pursuit of maintaining their market positions and gaining a competitive advantage. Leading tire cord fabric manufacturers focus on innovation, dedicating resources to research and developing new materials and technologies. These innovations include sustainable, high-performance, and lightweight fabric materials to cater to the evolving demands of tire manufacturers.

To solidify their positions on a global scale, key players actively pursue international partnerships, acquisitions, and collaborations. These strategic moves allow them to tap into new markets and expand their customer base, ensuring a broader reach.

The tire cord fabric industry is increasingly embracing sustainability as a core value. Major players are committed to eco-friendly production methods and materials, aligning their strategies with the growing environmental consciousness of consumers while enhancing their brand image. Efficient supply chain management is a top priority for industry leaders. Companies streamline their operations, optimize logistics, and foster robust relationships with suppliers to ensure a consistent and reliable flow of high-quality materials.

Top 3 Challenges Confronting Key Players

  • Fluctuations in the prices of raw materials like nylon and polyester can impact profit margins. Key players must develop strategies to manage and mitigate these cost fluctuations effectively.
  • The industry must comply with stringent environmental regulations, which can increase production costs. Companies invest in eco-friendly technologies and processes to adhere to these regulations while maintaining profitability.
  • The presence of low-cost manufacturing hubs in certain regions poses a competitive challenge. Key players must differentiate through quality and innovation to maintain their market positions.

Investment Considerations for New Entrants

For those entering the tire cord fabric market, key considerations include investing in research and development to create advanced materials, formulating global expansion plans, adopting sustainable production practices, prioritizing quality assurance, and exploring partnerships or collaborations with established industry players. These strategic steps can pave the way for success in a highly competitive and rapidly evolving industry.

Recent Developments in the Tire Cord Fabric Industry:

  • Kolon Industries, Inc. to invest US$ 1 billion in a new tire cord fabric plant in the United States. The new plant will be located in Georgia and is expected to start production in 2024.
  • Kordsa Global, Inc. to develop new tire cord fabric for electric vehicles. The new fabric will be made from aramid fiber, which is known for its strength and durability.
  • Hyosung Corporation to launch new high-performance tire cord fabric. The new fabric will be made from a hybrid fiber that combines the strength of aramid with the lightness of rayon.
  • SRF Ltd. to expand its tire cord fabric production capacity in India. The company plans to invest US$ 200 million in the expansion, which is expected to be completed by 2025.
  • Bekaert Corporation to develop new tire cord fabric with reduced rolling resistance. The new fabric will help to improve fuel efficiency and reduce emissions.

Key Companies in the Market

  • Indorama Ventures
  • Kordsa Teknik Tekstil
  • Hyosung Advanced Materials Corporation
  • Zhejiang Hailide New Material Co., Ltd.
  • Shenma Industrial Co., Ltd.
  • Zhejiang Unifull Industrial Fibre Co., Ltd.
  • Kolon Industries
  • Wuxi Taiji Industry Co., Ltd.
  • Far Eastern New Century Corporation
  • Oriental Industries (Suzhou) Ltd.
  • KORDÁRNA Plus a.s.

Key Segments

By Material Type:

  • Polyester
  • Nylon
  • Polyamide
  • Aramid
  • Rayon
  • Others

By Application:

  • Radial Tires
  • Bias Tires
  • High-performance Tires

By End Use:

  • Passenger cars
  • SUVs
  • MUVs
  • Light commercial vehicles
  • Heavy commercial vehicles
  • Military vehicles
  • Mining vehicles
  • Aircrafts
  • Motorbikes
  • Bicycles
  • Agricultural Vehicles
  • Other Vehicles

By Sales Channel:

  • OEM
  • Aftermarket

By Region:

  • North America
  • Latin America
  • Europe
  • East Asia
  • South Asia
  • Oceania
  • Middle East & Africa

Frequently Asked Questions

What is the Market Potential for Tire Cord Fabric?

The tire cord fabric market is projected to expand at a CAGR of 7.1% between 2023 and 2033.

Which End Use Segment Dominates the Tire Cord Fabric Market?

The passenger cars segment dominates the tire cord fabric market.

Who are the Top Three Tire Cord Fabric Producers?

The top 3 tire cord fabric producers are Kolon Industries, Inc., Kordsa Global, Inc., and Hyosung Corporation.

What is the Tire Cord Fabric Market Growth Outlook for 2033?

The tire cord fabric market is anticipated to surpass US$ 16,031.7 million by 2033.

What is Driving the Demand for Tire Cord Fabric?

Demand for tire cord fabric is primarily driven by its crucial role in tire manufacturing, ensuring durability and safety.

How are Sales of Nylon Tire Cord Fabric performing In the Market?

Sales of nylon tire cord fabric are rising at a steady pace in the market.

Table of Content

1. Executive Summary

    1.1. Global Market Outlook

    1.2. Demand-side Trends

    1.3. Supply-side Trends

    1.4. Technology Roadmap Analysis

    1.5. Analysis and Recommendations

2. Market Overview

    2.1. Market Coverage / Taxonomy

    2.2. Market Definition / Scope / Limitations

3. Market Background

    3.1. Market Dynamics

        3.1.1. Drivers

        3.1.2. Restraints

        3.1.3. Opportunity

        3.1.4. Trends

    3.2. Scenario Forecast

        3.2.1. Demand in Optimistic Scenario

        3.2.2. Demand in Likely Scenario

        3.2.3. Demand in Conservative Scenario

    3.3. Opportunity Map Analysis

    3.4. Product Life Cycle Analysis

    3.5. Supply Chain Analysis

        3.5.1. Supply Side Participants and their Roles

            3.5.1.1. Producers

            3.5.1.2. Mid-Level Participants (Traders/ Agents/ Brokers)

            3.5.1.3. Wholesalers and Distributors

        3.5.2. Value Added and Value Created at Node in the Supply Chain

        3.5.3. List of Raw Material Suppliers

        3.5.4. List of Existing and Potential Buyer’s

    3.6. Investment Feasibility Matrix

    3.7. Value Chain Analysis

        3.7.1. Profit Margin Analysis

        3.7.2. Wholesalers and Distributors

        3.7.3. Retailers

    3.8. PESTLE and Porter’s Analysis

    3.9. Regulatory Landscape

        3.9.1. By Key Regions

        3.9.2. By Key Countries

    3.10. Regional Parent Market Outlook

    3.11. Production and Consumption Statistics

    3.12. Import and Export Statistics

4. Global Market Analysis 2018 to 2022 and Forecast, 2023 to 2033

    4.1. Historical Market Size Value (US$ Million) & Volume (Tons) Analysis, 2018 to 2022

    4.2. Current and Future Market Size Value (US$ Million) & Volume (Tons) Projections, 2023 to 2033

        4.2.1. Y-o-Y Growth Trend Analysis

        4.2.2. Absolute $ Opportunity Analysis

5. Global Market Analysis 2018 to 2022 and Forecast 2023 to 2033, By Material Type

    5.1. Introduction / Key Findings

    5.2. Historical Market Size Value (US$ Million) & Volume (Tons) Analysis By Material Type, 2018 to 2022

    5.3. Current and Future Market Size Value (US$ Million) & Volume (Tons) Analysis and Forecast By Material Type, 2023 to 2033

        5.3.1. Polyester

        5.3.2. Nylon

        5.3.3. Polyamide

        5.3.4. Aramid

        5.3.5. Rayon

        5.3.6. Others

    5.4. Y-o-Y Growth Trend Analysis By Material Type, 2018 to 2022

    5.5. Absolute $ Opportunity Analysis By Material Type, 2023 to 2033

6. Global Market Analysis 2018 to 2022 and Forecast 2023 to 2033, By Application

    6.1. Introduction / Key Findings

    6.2. Historical Market Size Value (US$ Million) & Volume (Tons) Analysis By Application, 2018 to 2022

    6.3. Current and Future Market Size Value (US$ Million) & Volume (Tons) Analysis and Forecast By Application, 2023 to 2033

        6.3.1. Radial Tires

        6.3.2. Bias Tires

        6.3.3. High-Performance Tires

    6.4. Y-o-Y Growth Trend Analysis By Application, 2018 to 2022

    6.5. Absolute $ Opportunity Analysis By Application, 2023 to 2033

7. Global Market Analysis 2018 to 2022 and Forecast 2023 to 2033, By End Use

    7.1. Introduction / Key Findings

    7.2. Historical Market Size Value (US$ Million) & Volume (Tons) Analysis By End Use, 2018 to 2022

    7.3. Current and Future Market Size Value (US$ Million) & Volume (Tons) Analysis and Forecast By End Use, 2023 to 2033

        7.3.1. Passenger cars

        7.3.2. SUVs

        7.3.3. MUVs

        7.3.4. Light commercial vehicles

        7.3.5. Heavy commercial vehicles

        7.3.6. Military vehicles

        7.3.7. Mining vehicles

        7.3.8. Aircrafts

        7.3.9. Motorbikes

        7.3.10. Bicycles

        7.3.11. Agricultural Vehicles

        7.3.12. Other Vehicles

    7.4. Y-o-Y Growth Trend Analysis By End Use, 2018 to 2022

    7.5. Absolute $ Opportunity Analysis By End Use, 2023 to 2033

8. Global Market Analysis 2018 to 2022 and Forecast 2023 to 2033, By Sales Channel

    8.1. Introduction / Key Findings

    8.2. Historical Market Size Value (US$ Million) & Volume (Tons) Analysis By Sales Channel, 2018 to 2022

    8.3. Current and Future Market Size Value (US$ Million) & Volume (Tons) Analysis and Forecast By Sales Channel, 2023 to 2033

        8.3.1. OEM

        8.3.2. Aftermarket

    8.4. Y-o-Y Growth Trend Analysis By Sales Channel, 2018 to 2022

    8.5. Absolute $ Opportunity Analysis By Sales Channel, 2023 to 2033

9. Global Market Analysis 2018 to 2022 and Forecast 2023 to 2033, By Region

    9.1. Introduction

    9.2. Historical Market Size Value (US$ Million) & Volume (Tons) Analysis By Region, 2018 to 2022

    9.3. Current Market Size Value (US$ Million) & Volume (Tons) Analysis and Forecast By Region, 2023 to 2033

        9.3.1. North America

        9.3.2. Latin America

        9.3.3. Western Europe

        9.3.4. Eastern Europe

        9.3.5. South Asia and Pacific

        9.3.6. East Asia

        9.3.7. Middle East and Africa

    9.4. Market Attractiveness Analysis By Region

10. North America Market Analysis 2018 to 2022 and Forecast 2023 to 2033, By Country

    10.1. Historical Market Size Value (US$ Million) & Volume (Tons) Trend Analysis By Market Taxonomy, 2018 to 2022

    10.2. Market Size Value (US$ Million) & Volume (Tons) Forecast By Market Taxonomy, 2023 to 2033

        10.2.1. By Country

            10.2.1.1. The USA

            10.2.1.2. Canada

        10.2.2. By Material Type

        10.2.3. By Application

        10.2.4. By End Use

        10.2.5. By Sales Channel

    10.3. Market Attractiveness Analysis

        10.3.1. By Country

        10.3.2. By Material Type

        10.3.3. By Application

        10.3.4. By End Use

        10.3.5. By Sales Channel

    10.4. Key Takeaways

11. Latin America Market Analysis 2018 to 2022 and Forecast 2023 to 2033, By Country

    11.1. Historical Market Size Value (US$ Million) & Volume (Tons) Trend Analysis By Market Taxonomy, 2018 to 2022

    11.2. Market Size Value (US$ Million) & Volume (Tons) Forecast By Market Taxonomy, 2023 to 2033

        11.2.1. By Country

            11.2.1.1. Brazil

            11.2.1.2. Mexico

            11.2.1.3. Rest of Latin America

        11.2.2. By Material Type

        11.2.3. By Application

        11.2.4. By End Use

        11.2.5. By Sales Channel

    11.3. Market Attractiveness Analysis

        11.3.1. By Country

        11.3.2. By Material Type

        11.3.3. By Application

        11.3.4. By End Use

        11.3.5. By Sales Channel

    11.4. Key Takeaways

12. Western Europe Market Analysis 2018 to 2022 and Forecast 2023 to 2033, By Country

    12.1. Historical Market Size Value (US$ Million) & Volume (Tons) Trend Analysis By Market Taxonomy, 2018 to 2022

    12.2. Market Size Value (US$ Million) & Volume (Tons) Forecast By Market Taxonomy, 2023 to 2033

        12.2.1. By Country

            12.2.1.1. Germany

            12.2.1.2. United Kingdom

            12.2.1.3. France

            12.2.1.4. Spain

            12.2.1.5. Italy

            12.2.1.6. Rest of Western Europe

        12.2.2. By Material Type

        12.2.3. By Application

        12.2.4. By End Use

        12.2.5. By Sales Channel

    12.3. Market Attractiveness Analysis

        12.3.1. By Country

        12.3.2. By Material Type

        12.3.3. By Application

        12.3.4. By End Use

        12.3.5. By Sales Channel

    12.4. Key Takeaways

13. Eastern Europe Market Analysis 2018 to 2022 and Forecast 2023 to 2033, By Country

    13.1. Historical Market Size Value (US$ Million) & Volume (Tons) Trend Analysis By Market Taxonomy, 2018 to 2022

    13.2. Market Size Value (US$ Million) & Volume (Tons) Forecast By Market Taxonomy, 2023 to 2033

        13.2.1. By Country

            13.2.1.1. Poland

            13.2.1.2. Russia

            13.2.1.3. Czech Republic

            13.2.1.4. Romania

            13.2.1.5. Rest of Eastern Europe

        13.2.2. By Material Type

        13.2.3. By Application

        13.2.4. By End Use

        13.2.5. By Sales Channel

    13.3. Market Attractiveness Analysis

        13.3.1. By Country

        13.3.2. By Material Type

        13.3.3. By Application

        13.3.4. By End Use

        13.3.5. By Sales Channel

    13.4. Key Takeaways

14. South Asia and Pacific Market Analysis 2018 to 2022 and Forecast 2023 to 2033, By Country

    14.1. Historical Market Size Value (US$ Million) & Volume (Tons) Trend Analysis By Market Taxonomy, 2018 to 2022

    14.2. Market Size Value (US$ Million) & Volume (Tons) Forecast By Market Taxonomy, 2023 to 2033

        14.2.1. By Country

            14.2.1.1. India

            14.2.1.2. Bangladesh

            14.2.1.3. Australia

            14.2.1.4. New Zealand

            14.2.1.5. Rest of South Asia and Pacific

        14.2.2. By Material Type

        14.2.3. By Application

        14.2.4. By End Use

        14.2.5. By Sales Channel

    14.3. Market Attractiveness Analysis

        14.3.1. By Country

        14.3.2. By Material Type

        14.3.3. By Application

        14.3.4. By End Use

        14.3.5. By Sales Channel

    14.4. Key Takeaways

15. East Asia Market Analysis 2018 to 2022 and Forecast 2023 to 2033, By Country

    15.1. Historical Market Size Value (US$ Million) & Volume (Tons) Trend Analysis By Market Taxonomy, 2018 to 2022

    15.2. Market Size Value (US$ Million) & Volume (Tons) Forecast By Market Taxonomy, 2023 to 2033

        15.2.1. By Country

            15.2.1.1. China

            15.2.1.2. Japan

            15.2.1.3. South Korea

        15.2.2. By Material Type

        15.2.3. By Application

        15.2.4. By End Use

        15.2.5. By Sales Channel

    15.3. Market Attractiveness Analysis

        15.3.1. By Country

        15.3.2. By Material Type

        15.3.3. By Application

        15.3.4. By End Use

        15.3.5. By Sales Channel

    15.4. Key Takeaways

16. Middle East and Africa Market Analysis 2018 to 2022 and Forecast 2023 to 2033, By Country

    16.1. Historical Market Size Value (US$ Million) & Volume (Tons) Trend Analysis By Market Taxonomy, 2018 to 2022

    16.2. Market Size Value (US$ Million) & Volume (Tons) Forecast By Market Taxonomy, 2023 to 2033

        16.2.1. By Country

            16.2.1.1. GCC Countries

            16.2.1.2. South Africa

            16.2.1.3. Israel

            16.2.1.4. Rest of MEA

        16.2.2. By Material Type

        16.2.3. By Application

        16.2.4. By End Use

        16.2.5. By Sales Channel

    16.3. Market Attractiveness Analysis

        16.3.1. By Country

        16.3.2. By Material Type

        16.3.3. By Application

        16.3.4. By End Use

        16.3.5. By Sales Channel

    16.4. Key Takeaways

17. Key Countries Market Analysis

    17.1. USA

        17.1.1. Pricing Analysis

        17.1.2. Market Share Analysis, 2022

            17.1.2.1. By Material Type

            17.1.2.2. By Application

            17.1.2.3. By End Use

            17.1.2.4. By Sales Channel

    17.2. Canada

        17.2.1. Pricing Analysis

        17.2.2. Market Share Analysis, 2022

            17.2.2.1. By Material Type

            17.2.2.2. By Application

            17.2.2.3. By End Use

            17.2.2.4. By Sales Channel

    17.3. Brazil

        17.3.1. Pricing Analysis

        17.3.2. Market Share Analysis, 2022

            17.3.2.1. By Material Type

            17.3.2.2. By Application

            17.3.2.3. By End Use

            17.3.2.4. By Sales Channel

    17.4. Mexico

        17.4.1. Pricing Analysis

        17.4.2. Market Share Analysis, 2022

            17.4.2.1. By Material Type

            17.4.2.2. By Application

            17.4.2.3. By End Use

            17.4.2.4. By Sales Channel

    17.5. Germany

        17.5.1. Pricing Analysis

        17.5.2. Market Share Analysis, 2022

            17.5.2.1. By Material Type

            17.5.2.2. By Application

            17.5.2.3. By End Use

            17.5.2.4. By Sales Channel

    17.6. United Kingdom

        17.6.1. Pricing Analysis

        17.6.2. Market Share Analysis, 2022

            17.6.2.1. By Material Type

            17.6.2.2. By Application

            17.6.2.3. By End Use

            17.6.2.4. By Sales Channel

    17.7. France

        17.7.1. Pricing Analysis

        17.7.2. Market Share Analysis, 2022

            17.7.2.1. By Material Type

            17.7.2.2. By Application

            17.7.2.3. By End Use

            17.7.2.4. By Sales Channel

    17.8. Spain

        17.8.1. Pricing Analysis

        17.8.2. Market Share Analysis, 2022

            17.8.2.1. By Material Type

            17.8.2.2. By Application

            17.8.2.3. By End Use

            17.8.2.4. By Sales Channel

    17.9. Italy

        17.9.1. Pricing Analysis

        17.9.2. Market Share Analysis, 2022

            17.9.2.1. By Material Type

            17.9.2.2. By Application

            17.9.2.3. By End Use

            17.9.2.4. By Sales Channel

    17.10. Poland

        17.10.1. Pricing Analysis

        17.10.2. Market Share Analysis, 2022

            17.10.2.1. By Material Type

            17.10.2.2. By Application

            17.10.2.3. By End Use

            17.10.2.4. By Sales Channel

    17.11. Russia

        17.11.1. Pricing Analysis

        17.11.2. Market Share Analysis, 2022

            17.11.2.1. By Material Type

            17.11.2.2. By Application

            17.11.2.3. By End Use

            17.11.2.4. By Sales Channel

    17.12. Czech Republic

        17.12.1. Pricing Analysis

        17.12.2. Market Share Analysis, 2022

            17.12.2.1. By Material Type

            17.12.2.2. By Application

            17.12.2.3. By End Use

            17.12.2.4. By Sales Channel

    17.13. Romania

        17.13.1. Pricing Analysis

        17.13.2. Market Share Analysis, 2022

            17.13.2.1. By Material Type

            17.13.2.2. By Application

            17.13.2.3. By End Use

            17.13.2.4. By Sales Channel

    17.14. India

        17.14.1. Pricing Analysis

        17.14.2. Market Share Analysis, 2022

            17.14.2.1. By Material Type

            17.14.2.2. By Application

            17.14.2.3. By End Use

            17.14.2.4. By Sales Channel

    17.15. Bangladesh

        17.15.1. Pricing Analysis

        17.15.2. Market Share Analysis, 2022

            17.15.2.1. By Material Type

            17.15.2.2. By Application

            17.15.2.3. By End Use

            17.15.2.4. By Sales Channel

    17.16. Australia

        17.16.1. Pricing Analysis

        17.16.2. Market Share Analysis, 2022

            17.16.2.1. By Material Type

            17.16.2.2. By Application

            17.16.2.3. By End Use

            17.16.2.4. By Sales Channel

    17.17. New Zealand

        17.17.1. Pricing Analysis

        17.17.2. Market Share Analysis, 2022

            17.17.2.1. By Material Type

            17.17.2.2. By Application

            17.17.2.3. By End Use

            17.17.2.4. By Sales Channel

    17.18. China

        17.18.1. Pricing Analysis

        17.18.2. Market Share Analysis, 2022

            17.18.2.1. By Material Type

            17.18.2.2. By Application

            17.18.2.3. By End Use

            17.18.2.4. By Sales Channel

    17.19. Japan

        17.19.1. Pricing Analysis

        17.19.2. Market Share Analysis, 2022

            17.19.2.1. By Material Type

            17.19.2.2. By Application

            17.19.2.3. By End Use

            17.19.2.4. By Sales Channel

    17.20. South Korea

        17.20.1. Pricing Analysis

        17.20.2. Market Share Analysis, 2022

            17.20.2.1. By Material Type

            17.20.2.2. By Application

            17.20.2.3. By End Use

            17.20.2.4. By Sales Channel

    17.21. GCC Countries

        17.21.1. Pricing Analysis

        17.21.2. Market Share Analysis, 2022

            17.21.2.1. By Material Type

            17.21.2.2. By Application

            17.21.2.3. By End Use

            17.21.2.4. By Sales Channel

    17.22. South Africa

        17.22.1. Pricing Analysis

        17.22.2. Market Share Analysis, 2022

            17.22.2.1. By Material Type

            17.22.2.2. By Application

            17.22.2.3. By End Use

            17.22.2.4. By Sales Channel

    17.23. Israel

        17.23.1. Pricing Analysis

        17.23.2. Market Share Analysis, 2022

            17.23.2.1. By Material Type

            17.23.2.2. By Application

            17.23.2.3. By End Use

            17.23.2.4. By Sales Channel

18. Market Structure Analysis

    18.1. Competition Dashboard

    18.2. Competition Benchmarking

    18.3. Market Share Analysis of Top Players

        18.3.1. By Regional

        18.3.2. By Material Type

        18.3.3. By Application

        18.3.4. By End Use

        18.3.5. By Sales Channel

19. Competition Analysis

    19.1. Competition Deep Dive

        19.1.1. Indorama Ventures

            19.1.1.1. Overview

            19.1.1.2. Product Portfolio

            19.1.1.3. Profitability by Market Segments

            19.1.1.4. Sales Footprint

            19.1.1.5. Strategy Overview

                19.1.1.5.1. Marketing Strategy

                19.1.1.5.2. Product Strategy

                19.1.1.5.3. Channel Strategy

        19.1.2. Kordsa Teknik Tekstil

            19.1.2.1. Overview

            19.1.2.2. Product Portfolio

            19.1.2.3. Profitability by Market Segments

            19.1.2.4. Sales Footprint

            19.1.2.5. Strategy Overview

                19.1.2.5.1. Marketing Strategy

                19.1.2.5.2. Product Strategy

                19.1.2.5.3. Channel Strategy

        19.1.3. Hyosung Advanced Materials Corporation

            19.1.3.1. Overview

            19.1.3.2. Product Portfolio

            19.1.3.3. Profitability by Market Segments

            19.1.3.4. Sales Footprint

            19.1.3.5. Strategy Overview

                19.1.3.5.1. Marketing Strategy

                19.1.3.5.2. Product Strategy

                19.1.3.5.3. Channel Strategy

        19.1.4. Zhejiang Hailide New Material Co., Ltd.

            19.1.4.1. Overview

            19.1.4.2. Product Portfolio

            19.1.4.3. Profitability by Market Segments

            19.1.4.4. Sales Footprint

            19.1.4.5. Strategy Overview

                19.1.4.5.1. Marketing Strategy

                19.1.4.5.2. Product Strategy

                19.1.4.5.3. Channel Strategy

        19.1.5. Shenma Industrial Co., Ltd.

            19.1.5.1. Overview

            19.1.5.2. Product Portfolio

            19.1.5.3. Profitability by Market Segments

            19.1.5.4. Sales Footprint

            19.1.5.5. Strategy Overview

                19.1.5.5.1. Marketing Strategy

                19.1.5.5.2. Product Strategy

                19.1.5.5.3. Channel Strategy

        19.1.6. Zhejiang Unifull Industrial Fibre Co., Ltd.

            19.1.6.1. Overview

            19.1.6.2. Product Portfolio

            19.1.6.3. Profitability by Market Segments

            19.1.6.4. Sales Footprint

            19.1.6.5. Strategy Overview

                19.1.6.5.1. Marketing Strategy

                19.1.6.5.2. Product Strategy

                19.1.6.5.3. Channel Strategy

        19.1.7. Kolon Industries

            19.1.7.1. Overview

            19.1.7.2. Product Portfolio

            19.1.7.3. Profitability by Market Segments

            19.1.7.4. Sales Footprint

            19.1.7.5. Strategy Overview

                19.1.7.5.1. Marketing Strategy

                19.1.7.5.2. Product Strategy

                19.1.7.5.3. Channel Strategy

        19.1.8. Wuxi Taiji Industry Co., Ltd.

            19.1.8.1. Overview

            19.1.8.2. Product Portfolio

            19.1.8.3. Profitability by Market Segments

            19.1.8.4. Sales Footprint

            19.1.8.5. Strategy Overview

                19.1.8.5.1. Marketing Strategy

                19.1.8.5.2. Product Strategy

                19.1.8.5.3. Channel Strategy

        19.1.9. Far Eastern New Century Corporation

            19.1.9.1. Overview

            19.1.9.2. Product Portfolio

            19.1.9.3. Profitability by Market Segments

            19.1.9.4. Sales Footprint

            19.1.9.5. Strategy Overview

                19.1.9.5.1. Marketing Strategy

                19.1.9.5.2. Product Strategy

                19.1.9.5.3. Channel Strategy

        19.1.10. Oriental Industries (Suzhou) Ltd.

            19.1.10.1. Overview

            19.1.10.2. Product Portfolio

            19.1.10.3. Profitability by Market Segments

            19.1.10.4. Sales Footprint

            19.1.10.5. Strategy Overview

                19.1.10.5.1. Marketing Strategy

                19.1.10.5.2. Product Strategy

                19.1.10.5.3. Channel Strategy

        19.1.11. KORDÁRNA Plus a.s.

            19.1.11.1. Overview

            19.1.11.2. Product Portfolio

            19.1.11.3. Profitability by Market Segments

            19.1.11.4. Sales Footprint

            19.1.11.5. Strategy Overview

                19.1.11.5.1. Marketing Strategy

                19.1.11.5.2. Product Strategy

                19.1.11.5.3. Channel Strategy

20. Assumptions & Acronyms Used

21. Research Methodology

List of Tables

Table 1: Global Market Value (US$ Million) Forecast by Region, 2018 to 2033

Table 2: Global Market Volume (Tons) Forecast by Region, 2018 to 2033

Table 3: Global Market Value (US$ Million) Forecast by Material Type, 2018 to 2033

Table 4: Global Market Volume (Tons) Forecast by Material Type, 2018 to 2033

Table 5: Global Market Value (US$ Million) Forecast by Application, 2018 to 2033

Table 6: Global Market Volume (Tons) Forecast by Application, 2018 to 2033

Table 7: Global Market Value (US$ Million) Forecast by End Use, 2018 to 2033

Table 8: Global Market Volume (Tons) Forecast by End Use, 2018 to 2033

Table 9: Global Market Value (US$ Million) Forecast by Sales Channel, 2018 to 2033

Table 10: Global Market Volume (Tons) Forecast by Sales Channel, 2018 to 2033

Table 11: North America Market Value (US$ Million) Forecast by Country, 2018 to 2033

Table 12: North America Market Volume (Tons) Forecast by Country, 2018 to 2033

Table 13: North America Market Value (US$ Million) Forecast by Material Type, 2018 to 2033

Table 14: North America Market Volume (Tons) Forecast by Material Type, 2018 to 2033

Table 15: North America Market Value (US$ Million) Forecast by Application, 2018 to 2033

Table 16: North America Market Volume (Tons) Forecast by Application, 2018 to 2033

Table 17: North America Market Value (US$ Million) Forecast by End Use, 2018 to 2033

Table 18: North America Market Volume (Tons) Forecast by End Use, 2018 to 2033

Table 19: North America Market Value (US$ Million) Forecast by Sales Channel, 2018 to 2033

Table 20: North America Market Volume (Tons) Forecast by Sales Channel, 2018 to 2033

Table 21: Latin America Market Value (US$ Million) Forecast by Country, 2018 to 2033

Table 22: Latin America Market Volume (Tons) Forecast by Country, 2018 to 2033

Table 23: Latin America Market Value (US$ Million) Forecast by Material Type, 2018 to 2033

Table 24: Latin America Market Volume (Tons) Forecast by Material Type, 2018 to 2033

Table 25: Latin America Market Value (US$ Million) Forecast by Application, 2018 to 2033

Table 26: Latin America Market Volume (Tons) Forecast by Application, 2018 to 2033

Table 27: Latin America Market Value (US$ Million) Forecast by End Use, 2018 to 2033

Table 28: Latin America Market Volume (Tons) Forecast by End Use, 2018 to 2033

Table 29: Latin America Market Value (US$ Million) Forecast by Sales Channel, 2018 to 2033

Table 30: Latin America Market Volume (Tons) Forecast by Sales Channel, 2018 to 2033

Table 31: Western Europe Market Value (US$ Million) Forecast by Country, 2018 to 2033

Table 32: Western Europe Market Volume (Tons) Forecast by Country, 2018 to 2033

Table 33: Western Europe Market Value (US$ Million) Forecast by Material Type, 2018 to 2033

Table 34: Western Europe Market Volume (Tons) Forecast by Material Type, 2018 to 2033

Table 35: Western Europe Market Value (US$ Million) Forecast by Application, 2018 to 2033

Table 36: Western Europe Market Volume (Tons) Forecast by Application, 2018 to 2033

Table 37: Western Europe Market Value (US$ Million) Forecast by End Use, 2018 to 2033

Table 38: Western Europe Market Volume (Tons) Forecast by End Use, 2018 to 2033

Table 39: Western Europe Market Value (US$ Million) Forecast by Sales Channel, 2018 to 2033

Table 40: Western Europe Market Volume (Tons) Forecast by Sales Channel, 2018 to 2033

Table 41: Eastern Europe Market Value (US$ Million) Forecast by Country, 2018 to 2033

Table 42: Eastern Europe Market Volume (Tons) Forecast by Country, 2018 to 2033

Table 43: Eastern Europe Market Value (US$ Million) Forecast by Material Type, 2018 to 2033

Table 44: Eastern Europe Market Volume (Tons) Forecast by Material Type, 2018 to 2033

Table 45: Eastern Europe Market Value (US$ Million) Forecast by Application, 2018 to 2033

Table 46: Eastern Europe Market Volume (Tons) Forecast by Application, 2018 to 2033

Table 47: Eastern Europe Market Value (US$ Million) Forecast by End Use, 2018 to 2033

Table 48: Eastern Europe Market Volume (Tons) Forecast by End Use, 2018 to 2033

Table 49: Eastern Europe Market Value (US$ Million) Forecast by Sales Channel, 2018 to 2033

Table 50: Eastern Europe Market Volume (Tons) Forecast by Sales Channel, 2018 to 2033

Table 51: South Asia and Pacific Market Value (US$ Million) Forecast by Country, 2018 to 2033

Table 52: South Asia and Pacific Market Volume (Tons) Forecast by Country, 2018 to 2033

Table 53: South Asia and Pacific Market Value (US$ Million) Forecast by Material Type, 2018 to 2033

Table 54: South Asia and Pacific Market Volume (Tons) Forecast by Material Type, 2018 to 2033

Table 55: South Asia and Pacific Market Value (US$ Million) Forecast by Application, 2018 to 2033

Table 56: South Asia and Pacific Market Volume (Tons) Forecast by Application, 2018 to 2033

Table 57: South Asia and Pacific Market Value (US$ Million) Forecast by End Use, 2018 to 2033

Table 58: South Asia and Pacific Market Volume (Tons) Forecast by End Use, 2018 to 2033

Table 59: South Asia and Pacific Market Value (US$ Million) Forecast by Sales Channel, 2018 to 2033

Table 60: South Asia and Pacific Market Volume (Tons) Forecast by Sales Channel, 2018 to 2033

Table 61: East Asia Market Value (US$ Million) Forecast by Country, 2018 to 2033

Table 62: East Asia Market Volume (Tons) Forecast by Country, 2018 to 2033

Table 63: East Asia Market Value (US$ Million) Forecast by Material Type, 2018 to 2033

Table 64: East Asia Market Volume (Tons) Forecast by Material Type, 2018 to 2033

Table 65: East Asia Market Value (US$ Million) Forecast by Application, 2018 to 2033

Table 66: East Asia Market Volume (Tons) Forecast by Application, 2018 to 2033

Table 67: East Asia Market Value (US$ Million) Forecast by End Use, 2018 to 2033

Table 68: East Asia Market Volume (Tons) Forecast by End Use, 2018 to 2033

Table 69: East Asia Market Value (US$ Million) Forecast by Sales Channel, 2018 to 2033

Table 70: East Asia Market Volume (Tons) Forecast by Sales Channel, 2018 to 2033

Table 71: Middle East and Africa Market Value (US$ Million) Forecast by Country, 2018 to 2033

Table 72: Middle East and Africa Market Volume (Tons) Forecast by Country, 2018 to 2033

Table 73: Middle East and Africa Market Value (US$ Million) Forecast by Material Type, 2018 to 2033

Table 74: Middle East and Africa Market Volume (Tons) Forecast by Material Type, 2018 to 2033

Table 75: Middle East and Africa Market Value (US$ Million) Forecast by Application, 2018 to 2033

Table 76: Middle East and Africa Market Volume (Tons) Forecast by Application, 2018 to 2033

Table 77: Middle East and Africa Market Value (US$ Million) Forecast by End Use, 2018 to 2033

Table 78: Middle East and Africa Market Volume (Tons) Forecast by End Use, 2018 to 2033

Table 79: Middle East and Africa Market Value (US$ Million) Forecast by Sales Channel, 2018 to 2033

Table 80: Middle East and Africa Market Volume (Tons) Forecast by Sales Channel, 2018 to 2033

List of Charts

Figure 1: Global Market Value (US$ Million) by Material Type, 2023 to 2033

Figure 2: Global Market Value (US$ Million) by Application, 2023 to 2033

Figure 3: Global Market Value (US$ Million) by End Use, 2023 to 2033

Figure 4: Global Market Value (US$ Million) by Sales Channel, 2023 to 2033

Figure 5: Global Market Value (US$ Million) by Region, 2023 to 2033

Figure 6: Global Market Value (US$ Million) Analysis by Region, 2018 to 2033

Figure 7: Global Market Volume (Tons) Analysis by Region, 2018 to 2033

Figure 8: Global Market Value Share (%) and BPS Analysis by Region, 2023 to 2033

Figure 9: Global Market Y-o-Y Growth (%) Projections by Region, 2023 to 2033

Figure 10: Global Market Value (US$ Million) Analysis by Material Type, 2018 to 2033

Figure 11: Global Market Volume (Tons) Analysis by Material Type, 2018 to 2033

Figure 12: Global Market Value Share (%) and BPS Analysis by Material Type, 2023 to 2033

Figure 13: Global Market Y-o-Y Growth (%) Projections by Material Type, 2023 to 2033

Figure 14: Global Market Value (US$ Million) Analysis by Application, 2018 to 2033

Figure 15: Global Market Volume (Tons) Analysis by Application, 2018 to 2033

Figure 16: Global Market Value Share (%) and BPS Analysis by Application, 2023 to 2033

Figure 17: Global Market Y-o-Y Growth (%) Projections by Application, 2023 to 2033

Figure 18: Global Market Value (US$ Million) Analysis by End Use, 2018 to 2033

Figure 19: Global Market Volume (Tons) Analysis by End Use, 2018 to 2033

Figure 20: Global Market Value Share (%) and BPS Analysis by End Use, 2023 to 2033

Figure 21: Global Market Y-o-Y Growth (%) Projections by End Use, 2023 to 2033

Figure 22: Global Market Value (US$ Million) Analysis by Sales Channel, 2018 to 2033

Figure 23: Global Market Volume (Tons) Analysis by Sales Channel, 2018 to 2033

Figure 24: Global Market Value Share (%) and BPS Analysis by Sales Channel, 2023 to 2033

Figure 25: Global Market Y-o-Y Growth (%) Projections by Sales Channel, 2023 to 2033

Figure 26: Global Market Attractiveness by Material Type, 2023 to 2033

Figure 27: Global Market Attractiveness by Application, 2023 to 2033

Figure 28: Global Market Attractiveness by End Use, 2023 to 2033

Figure 29: Global Market Attractiveness by Sales Channel, 2023 to 2033

Figure 30: Global Market Attractiveness by Region, 2023 to 2033

Figure 31: North America Market Value (US$ Million) by Material Type, 2023 to 2033

Figure 32: North America Market Value (US$ Million) by Application, 2023 to 2033

Figure 33: North America Market Value (US$ Million) by End Use, 2023 to 2033

Figure 34: North America Market Value (US$ Million) by Sales Channel, 2023 to 2033

Figure 35: North America Market Value (US$ Million) by Country, 2023 to 2033

Figure 36: North America Market Value (US$ Million) Analysis by Country, 2018 to 2033

Figure 37: North America Market Volume (Tons) Analysis by Country, 2018 to 2033

Figure 38: North America Market Value Share (%) and BPS Analysis by Country, 2023 to 2033

Figure 39: North America Market Y-o-Y Growth (%) Projections by Country, 2023 to 2033

Figure 40: North America Market Value (US$ Million) Analysis by Material Type, 2018 to 2033

Figure 41: North America Market Volume (Tons) Analysis by Material Type, 2018 to 2033

Figure 42: North America Market Value Share (%) and BPS Analysis by Material Type, 2023 to 2033

Figure 43: North America Market Y-o-Y Growth (%) Projections by Material Type, 2023 to 2033

Figure 44: North America Market Value (US$ Million) Analysis by Application, 2018 to 2033

Figure 45: North America Market Volume (Tons) Analysis by Application, 2018 to 2033

Figure 46: North America Market Value Share (%) and BPS Analysis by Application, 2023 to 2033

Figure 47: North America Market Y-o-Y Growth (%) Projections by Application, 2023 to 2033

Figure 48: North America Market Value (US$ Million) Analysis by End Use, 2018 to 2033

Figure 49: North America Market Volume (Tons) Analysis by End Use, 2018 to 2033

Figure 50: North America Market Value Share (%) and BPS Analysis by End Use, 2023 to 2033

Figure 51: North America Market Y-o-Y Growth (%) Projections by End Use, 2023 to 2033

Figure 52: North America Market Value (US$ Million) Analysis by Sales Channel, 2018 to 2033

Figure 53: North America Market Volume (Tons) Analysis by Sales Channel, 2018 to 2033

Figure 54: North America Market Value Share (%) and BPS Analysis by Sales Channel, 2023 to 2033

Figure 55: North America Market Y-o-Y Growth (%) Projections by Sales Channel, 2023 to 2033

Figure 56: North America Market Attractiveness by Material Type, 2023 to 2033

Figure 57: North America Market Attractiveness by Application, 2023 to 2033

Figure 58: North America Market Attractiveness by End Use, 2023 to 2033

Figure 59: North America Market Attractiveness by Sales Channel, 2023 to 2033

Figure 60: North America Market Attractiveness by Country, 2023 to 2033

Figure 61: Latin America Market Value (US$ Million) by Material Type, 2023 to 2033

Figure 62: Latin America Market Value (US$ Million) by Application, 2023 to 2033

Figure 63: Latin America Market Value (US$ Million) by End Use, 2023 to 2033

Figure 64: Latin America Market Value (US$ Million) by Sales Channel, 2023 to 2033

Figure 65: Latin America Market Value (US$ Million) by Country, 2023 to 2033

Figure 66: Latin America Market Value (US$ Million) Analysis by Country, 2018 to 2033

Figure 67: Latin America Market Volume (Tons) Analysis by Country, 2018 to 2033

Figure 68: Latin America Market Value Share (%) and BPS Analysis by Country, 2023 to 2033

Figure 69: Latin America Market Y-o-Y Growth (%) Projections by Country, 2023 to 2033

Figure 70: Latin America Market Value (US$ Million) Analysis by Material Type, 2018 to 2033

Figure 71: Latin America Market Volume (Tons) Analysis by Material Type, 2018 to 2033

Figure 72: Latin America Market Value Share (%) and BPS Analysis by Material Type, 2023 to 2033

Figure 73: Latin America Market Y-o-Y Growth (%) Projections by Material Type, 2023 to 2033

Figure 74: Latin America Market Value (US$ Million) Analysis by Application, 2018 to 2033

Figure 75: Latin America Market Volume (Tons) Analysis by Application, 2018 to 2033

Figure 76: Latin America Market Value Share (%) and BPS Analysis by Application, 2023 to 2033

Figure 77: Latin America Market Y-o-Y Growth (%) Projections by Application, 2023 to 2033

Figure 78: Latin America Market Value (US$ Million) Analysis by End Use, 2018 to 2033

Figure 79: Latin America Market Volume (Tons) Analysis by End Use, 2018 to 2033

Figure 80: Latin America Market Value Share (%) and BPS Analysis by End Use, 2023 to 2033

Figure 81: Latin America Market Y-o-Y Growth (%) Projections by End Use, 2023 to 2033

Figure 82: Latin America Market Value (US$ Million) Analysis by Sales Channel, 2018 to 2033

Figure 83: Latin America Market Volume (Tons) Analysis by Sales Channel, 2018 to 2033

Figure 84: Latin America Market Value Share (%) and BPS Analysis by Sales Channel, 2023 to 2033

Figure 85: Latin America Market Y-o-Y Growth (%) Projections by Sales Channel, 2023 to 2033

Figure 86: Latin America Market Attractiveness by Material Type, 2023 to 2033

Figure 87: Latin America Market Attractiveness by Application, 2023 to 2033

Figure 88: Latin America Market Attractiveness by End Use, 2023 to 2033

Figure 89: Latin America Market Attractiveness by Sales Channel, 2023 to 2033

Figure 90: Latin America Market Attractiveness by Country, 2023 to 2033

Figure 91: Western Europe Market Value (US$ Million) by Material Type, 2023 to 2033

Figure 92: Western Europe Market Value (US$ Million) by Application, 2023 to 2033

Figure 93: Western Europe Market Value (US$ Million) by End Use, 2023 to 2033

Figure 94: Western Europe Market Value (US$ Million) by Sales Channel, 2023 to 2033

Figure 95: Western Europe Market Value (US$ Million) by Country, 2023 to 2033

Figure 96: Western Europe Market Value (US$ Million) Analysis by Country, 2018 to 2033

Figure 97: Western Europe Market Volume (Tons) Analysis by Country, 2018 to 2033

Figure 98: Western Europe Market Value Share (%) and BPS Analysis by Country, 2023 to 2033

Figure 99: Western Europe Market Y-o-Y Growth (%) Projections by Country, 2023 to 2033

Figure 100: Western Europe Market Value (US$ Million) Analysis by Material Type, 2018 to 2033

Figure 101: Western Europe Market Volume (Tons) Analysis by Material Type, 2018 to 2033

Figure 102: Western Europe Market Value Share (%) and BPS Analysis by Material Type, 2023 to 2033

Figure 103: Western Europe Market Y-o-Y Growth (%) Projections by Material Type, 2023 to 2033

Figure 104: Western Europe Market Value (US$ Million) Analysis by Application, 2018 to 2033

Figure 105: Western Europe Market Volume (Tons) Analysis by Application, 2018 to 2033

Figure 106: Western Europe Market Value Share (%) and BPS Analysis by Application, 2023 to 2033

Figure 107: Western Europe Market Y-o-Y Growth (%) Projections by Application, 2023 to 2033

Figure 108: Western Europe Market Value (US$ Million) Analysis by End Use, 2018 to 2033

Figure 109: Western Europe Market Volume (Tons) Analysis by End Use, 2018 to 2033

Figure 110: Western Europe Market Value Share (%) and BPS Analysis by End Use, 2023 to 2033

Figure 111: Western Europe Market Y-o-Y Growth (%) Projections by End Use, 2023 to 2033

Figure 112: Western Europe Market Value (US$ Million) Analysis by Sales Channel, 2018 to 2033

Figure 113: Western Europe Market Volume (Tons) Analysis by Sales Channel, 2018 to 2033

Figure 114: Western Europe Market Value Share (%) and BPS Analysis by Sales Channel, 2023 to 2033

Figure 115: Western Europe Market Y-o-Y Growth (%) Projections by Sales Channel, 2023 to 2033

Figure 116: Western Europe Market Attractiveness by Material Type, 2023 to 2033

Figure 117: Western Europe Market Attractiveness by Application, 2023 to 2033

Figure 118: Western Europe Market Attractiveness by End Use, 2023 to 2033

Figure 119: Western Europe Market Attractiveness by Sales Channel, 2023 to 2033

Figure 120: Western Europe Market Attractiveness by Country, 2023 to 2033

Figure 121: Eastern Europe Market Value (US$ Million) by Material Type, 2023 to 2033

Figure 122: Eastern Europe Market Value (US$ Million) by Application, 2023 to 2033

Figure 123: Eastern Europe Market Value (US$ Million) by End Use, 2023 to 2033

Figure 124: Eastern Europe Market Value (US$ Million) by Sales Channel, 2023 to 2033

Figure 125: Eastern Europe Market Value (US$ Million) by Country, 2023 to 2033

Figure 126: Eastern Europe Market Value (US$ Million) Analysis by Country, 2018 to 2033

Figure 127: Eastern Europe Market Volume (Tons) Analysis by Country, 2018 to 2033

Figure 128: Eastern Europe Market Value Share (%) and BPS Analysis by Country, 2023 to 2033

Figure 129: Eastern Europe Market Y-o-Y Growth (%) Projections by Country, 2023 to 2033

Figure 130: Eastern Europe Market Value (US$ Million) Analysis by Material Type, 2018 to 2033

Figure 131: Eastern Europe Market Volume (Tons) Analysis by Material Type, 2018 to 2033

Figure 132: Eastern Europe Market Value Share (%) and BPS Analysis by Material Type, 2023 to 2033

Figure 133: Eastern Europe Market Y-o-Y Growth (%) Projections by Material Type, 2023 to 2033

Figure 134: Eastern Europe Market Value (US$ Million) Analysis by Application, 2018 to 2033

Figure 135: Eastern Europe Market Volume (Tons) Analysis by Application, 2018 to 2033

Figure 136: Eastern Europe Market Value Share (%) and BPS Analysis by Application, 2023 to 2033

Figure 137: Eastern Europe Market Y-o-Y Growth (%) Projections by Application, 2023 to 2033

Figure 138: Eastern Europe Market Value (US$ Million) Analysis by End Use, 2018 to 2033

Figure 139: Eastern Europe Market Volume (Tons) Analysis by End Use, 2018 to 2033

Figure 140: Eastern Europe Market Value Share (%) and BPS Analysis by End Use, 2023 to 2033

Figure 141: Eastern Europe Market Y-o-Y Growth (%) Projections by End Use, 2023 to 2033

Figure 142: Eastern Europe Market Value (US$ Million) Analysis by Sales Channel, 2018 to 2033

Figure 143: Eastern Europe Market Volume (Tons) Analysis by Sales Channel, 2018 to 2033

Figure 144: Eastern Europe Market Value Share (%) and BPS Analysis by Sales Channel, 2023 to 2033

Figure 145: Eastern Europe Market Y-o-Y Growth (%) Projections by Sales Channel, 2023 to 2033

Figure 146: Eastern Europe Market Attractiveness by Material Type, 2023 to 2033

Figure 147: Eastern Europe Market Attractiveness by Application, 2023 to 2033

Figure 148: Eastern Europe Market Attractiveness by End Use, 2023 to 2033

Figure 149: Eastern Europe Market Attractiveness by Sales Channel, 2023 to 2033

Figure 150: Eastern Europe Market Attractiveness by Country, 2023 to 2033

Figure 151: South Asia and Pacific Market Value (US$ Million) by Material Type, 2023 to 2033

Figure 152: South Asia and Pacific Market Value (US$ Million) by Application, 2023 to 2033

Figure 153: South Asia and Pacific Market Value (US$ Million) by End Use, 2023 to 2033

Figure 154: South Asia and Pacific Market Value (US$ Million) by Sales Channel, 2023 to 2033

Figure 155: South Asia and Pacific Market Value (US$ Million) by Country, 2023 to 2033

Figure 156: South Asia and Pacific Market Value (US$ Million) Analysis by Country, 2018 to 2033

Figure 157: South Asia and Pacific Market Volume (Tons) Analysis by Country, 2018 to 2033

Figure 158: South Asia and Pacific Market Value Share (%) and BPS Analysis by Country, 2023 to 2033

Figure 159: South Asia and Pacific Market Y-o-Y Growth (%) Projections by Country, 2023 to 2033

Figure 160: South Asia and Pacific Market Value (US$ Million) Analysis by Material Type, 2018 to 2033

Figure 161: South Asia and Pacific Market Volume (Tons) Analysis by Material Type, 2018 to 2033

Figure 162: South Asia and Pacific Market Value Share (%) and BPS Analysis by Material Type, 2023 to 2033

Figure 163: South Asia and Pacific Market Y-o-Y Growth (%) Projections by Material Type, 2023 to 2033

Figure 164: South Asia and Pacific Market Value (US$ Million) Analysis by Application, 2018 to 2033

Figure 165: South Asia and Pacific Market Volume (Tons) Analysis by Application, 2018 to 2033

Figure 166: South Asia and Pacific Market Value Share (%) and BPS Analysis by Application, 2023 to 2033

Figure 167: South Asia and Pacific Market Y-o-Y Growth (%) Projections by Application, 2023 to 2033

Figure 168: South Asia and Pacific Market Value (US$ Million) Analysis by End Use, 2018 to 2033

Figure 169: South Asia and Pacific Market Volume (Tons) Analysis by End Use, 2018 to 2033

Figure 170: South Asia and Pacific Market Value Share (%) and BPS Analysis by End Use, 2023 to 2033

Figure 171: South Asia and Pacific Market Y-o-Y Growth (%) Projections by End Use, 2023 to 2033

Figure 172: South Asia and Pacific Market Value (US$ Million) Analysis by Sales Channel, 2018 to 2033

Figure 173: South Asia and Pacific Market Volume (Tons) Analysis by Sales Channel, 2018 to 2033

Figure 174: South Asia and Pacific Market Value Share (%) and BPS Analysis by Sales Channel, 2023 to 2033

Figure 175: South Asia and Pacific Market Y-o-Y Growth (%) Projections by Sales Channel, 2023 to 2033

Figure 176: South Asia and Pacific Market Attractiveness by Material Type, 2023 to 2033

Figure 177: South Asia and Pacific Market Attractiveness by Application, 2023 to 2033

Figure 178: South Asia and Pacific Market Attractiveness by End Use, 2023 to 2033

Figure 179: South Asia and Pacific Market Attractiveness by Sales Channel, 2023 to 2033

Figure 180: South Asia and Pacific Market Attractiveness by Country, 2023 to 2033

Figure 181: East Asia Market Value (US$ Million) by Material Type, 2023 to 2033

Figure 182: East Asia Market Value (US$ Million) by Application, 2023 to 2033

Figure 183: East Asia Market Value (US$ Million) by End Use, 2023 to 2033

Figure 184: East Asia Market Value (US$ Million) by Sales Channel, 2023 to 2033

Figure 185: East Asia Market Value (US$ Million) by Country, 2023 to 2033

Figure 186: East Asia Market Value (US$ Million) Analysis by Country, 2018 to 2033

Figure 187: East Asia Market Volume (Tons) Analysis by Country, 2018 to 2033

Figure 188: East Asia Market Value Share (%) and BPS Analysis by Country, 2023 to 2033

Figure 189: East Asia Market Y-o-Y Growth (%) Projections by Country, 2023 to 2033

Figure 190: East Asia Market Value (US$ Million) Analysis by Material Type, 2018 to 2033

Figure 191: East Asia Market Volume (Tons) Analysis by Material Type, 2018 to 2033

Figure 192: East Asia Market Value Share (%) and BPS Analysis by Material Type, 2023 to 2033

Figure 193: East Asia Market Y-o-Y Growth (%) Projections by Material Type, 2023 to 2033

Figure 194: East Asia Market Value (US$ Million) Analysis by Application, 2018 to 2033

Figure 195: East Asia Market Volume (Tons) Analysis by Application, 2018 to 2033

Figure 196: East Asia Market Value Share (%) and BPS Analysis by Application, 2023 to 2033

Figure 197: East Asia Market Y-o-Y Growth (%) Projections by Application, 2023 to 2033

Figure 198: East Asia Market Value (US$ Million) Analysis by End Use, 2018 to 2033

Figure 199: East Asia Market Volume (Tons) Analysis by End Use, 2018 to 2033

Figure 200: East Asia Market Value Share (%) and BPS Analysis by End Use, 2023 to 2033

Figure 201: East Asia Market Y-o-Y Growth (%) Projections by End Use, 2023 to 2033

Figure 202: East Asia Market Value (US$ Million) Analysis by Sales Channel, 2018 to 2033

Figure 203: East Asia Market Volume (Tons) Analysis by Sales Channel, 2018 to 2033

Figure 204: East Asia Market Value Share (%) and BPS Analysis by Sales Channel, 2023 to 2033

Figure 205: East Asia Market Y-o-Y Growth (%) Projections by Sales Channel, 2023 to 2033

Figure 206: East Asia Market Attractiveness by Material Type, 2023 to 2033

Figure 207: East Asia Market Attractiveness by Application, 2023 to 2033

Figure 208: East Asia Market Attractiveness by End Use, 2023 to 2033

Figure 209: East Asia Market Attractiveness by Sales Channel, 2023 to 2033

Figure 210: East Asia Market Attractiveness by Country, 2023 to 2033

Figure 211: Middle East and Africa Market Value (US$ Million) by Material Type, 2023 to 2033

Figure 212: Middle East and Africa Market Value (US$ Million) by Application, 2023 to 2033

Figure 213: Middle East and Africa Market Value (US$ Million) by End Use, 2023 to 2033

Figure 214: Middle East and Africa Market Value (US$ Million) by Sales Channel, 2023 to 2033

Figure 215: Middle East and Africa Market Value (US$ Million) by Country, 2023 to 2033

Figure 216: Middle East and Africa Market Value (US$ Million) Analysis by Country, 2018 to 2033

Figure 217: Middle East and Africa Market Volume (Tons) Analysis by Country, 2018 to 2033

Figure 218: Middle East and Africa Market Value Share (%) and BPS Analysis by Country, 2023 to 2033

Figure 219: Middle East and Africa Market Y-o-Y Growth (%) Projections by Country, 2023 to 2033

Figure 220: Middle East and Africa Market Value (US$ Million) Analysis by Material Type, 2018 to 2033

Figure 221: Middle East and Africa Market Volume (Tons) Analysis by Material Type, 2018 to 2033

Figure 222: Middle East and Africa Market Value Share (%) and BPS Analysis by Material Type, 2023 to 2033

Figure 223: Middle East and Africa Market Y-o-Y Growth (%) Projections by Material Type, 2023 to 2033

Figure 224: Middle East and Africa Market Value (US$ Million) Analysis by Application, 2018 to 2033

Figure 225: Middle East and Africa Market Volume (Tons) Analysis by Application, 2018 to 2033

Figure 226: Middle East and Africa Market Value Share (%) and BPS Analysis by Application, 2023 to 2033

Figure 227: Middle East and Africa Market Y-o-Y Growth (%) Projections by Application, 2023 to 2033

Figure 228: Middle East and Africa Market Value (US$ Million) Analysis by End Use, 2018 to 2033

Figure 229: Middle East and Africa Market Volume (Tons) Analysis by End Use, 2018 to 2033

Figure 230: Middle East and Africa Market Value Share (%) and BPS Analysis by End Use, 2023 to 2033

Figure 231: Middle East and Africa Market Y-o-Y Growth (%) Projections by End Use, 2023 to 2033

Figure 232: Middle East and Africa Market Value (US$ Million) Analysis by Sales Channel, 2018 to 2033

Figure 233: Middle East and Africa Market Volume (Tons) Analysis by Sales Channel, 2018 to 2033

Figure 234: Middle East and Africa Market Value Share (%) and BPS Analysis by Sales Channel, 2023 to 2033

Figure 235: Middle East and Africa Market Y-o-Y Growth (%) Projections by Sales Channel, 2023 to 2033

Figure 236: Middle East and Africa Market Attractiveness by Material Type, 2023 to 2033

Figure 237: Middle East and Africa Market Attractiveness by Application, 2023 to 2033

Figure 238: Middle East and Africa Market Attractiveness by End Use, 2023 to 2033

Figure 239: Middle East and Africa Market Attractiveness by Sales Channel, 2023 to 2033

Figure 240: Middle East and Africa Market Attractiveness by Country, 2023 to 2033

Recommendations

Chemicals & Materials

Coated Fabrics Market

Published : June 2023

Chemicals & Materials

Tire Cord Market

Published : February 2023

Explore Chemicals & Materials Insights

View Reports