The global photonics market is estimated to be worth USD 988.71 Billion in 2025 and is anticipated to reach USD 1,733.49 Billion by 2035, reflecting a compound annual growth rate (CAGR) of 5.8% during the forecast period. This growth is driven by the increasing demand for high-speed data transmission, advancements in laser technologies, and the expanding applications of photonics in various industries such as telecommunications, healthcare, and manufacturing.
Recent developments in the photonics industry highlight significant technological advancements and strategic collaborations. Companies are focusing on enhancing the efficiency and performance of photonic devices, aiming to meet the growing requirements of modern applications. Innovations in laser technologies, optical sensors, and photonic integrated circuits are paving the way for more compact, energy-efficient, and high-performance solutions.
A notable trend in the market is the integration of photonics with artificial intelligence (AI) and machine learning technologies. This convergence is enabling the development of advanced systems capable of processing vast amounts of data at unprecedented speeds, thereby driving the demand for photonic components and systems. The rise of AI applications in areas such as data centers, autonomous vehicles, and smart cities is further fueling the growth of the photonics market.
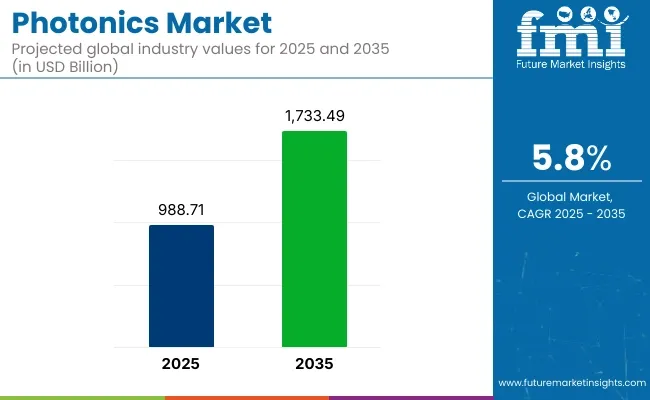
| Attribute | Value |
|---|---|
| Market Size in 2025 | USD 988.71 Billion |
| Market Size in 2035 | USD 1,733.49 Billion |
| CAGR (2025 to 2035) | 5.8% |
On April 9, 2025, the photonics sector experienced significant stock declines following the announcement of new USA trade tariffs. Major companies such as Coherent Corp., Lumentum Holdings, MKS Instruments, and IPG Photonics saw their stock prices drop by over 20% within a week. These tariffs, described as "reciprocal," have introduced uncertainties in the market, affecting investor confidence and leading to increased volatility in the sector. The impact underscores the sensitivity of the photonics industry to global trade policies and the interconnectedness of international markets. This was reported by Optics.org
As the photonics market continues to evolve, ongoing research and development efforts are expected to lead to the introduction of more specialized and efficient products. These advancements will cater to the diverse needs of industries seeking to leverage photonics for improved performance and capabilities.
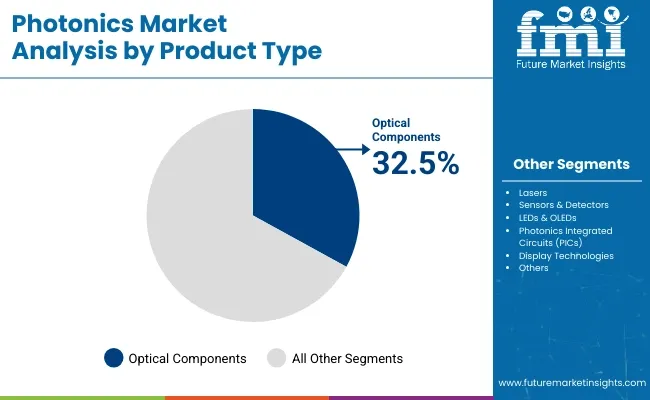
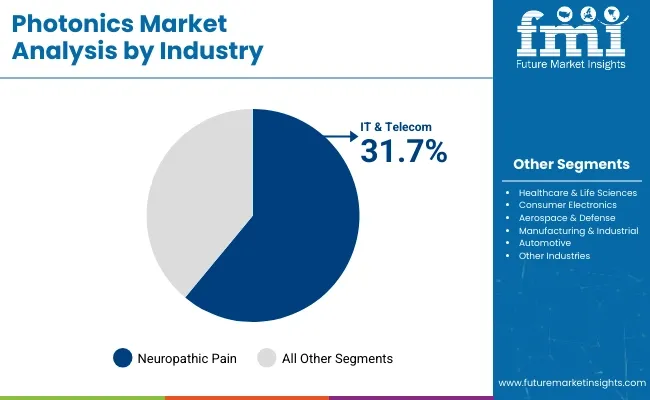
The global photonics market is projected to experience robust growth from 2025 to 2035. Key segments driving this growth include optical components and the IT & telecom industry. These segments are propelled by the increasing demand for photonic technologies in communications, healthcare, and manufacturing, driven by advancements in light-based technologies and the growing need for high-performance optical solutions.
Optical components are expected to account for 32.5% of the photonics market share in 2025. This segment is key to the overall photonics market due to the integral role optical components, such as lenses, mirrors, filters, and fiber optics, play in photonic systems across various industries. Optical components are essential in applications ranging from laser systems, imaging technologies, to fiber-optic communications, providing precision and reliability in light manipulation.
The demand for optical components is growing due to the increasing adoption of photonics in sectors like automotive, healthcare, and consumer electronics, where high-quality light transmission and imaging are critical.
Companies like Lumentum and Thorlabs are driving innovations in optical components by developing advanced materials, coatings, and technologies that enhance the performance and efficiency of photonic systems. As industries move toward more advanced applications such as quantum computing and autonomous vehicles, the optical components segment is expected to continue to dominate the photonics market.
The IT & telecom industry is projected to hold 31.7% of the market share in 2025. This growth is largely attributed to the rising demand for high-speed internet, 5G networks, and data center infrastructure, all of which rely on photonic technologies for faster data transmission and network reliability. Photonics plays a crucial role in modern telecommunications, particularly through the use of fiber optics and optical networks that enable high-bandwidth communication across long distances.
As 5G deployment continues to expand globally, there is a surge in the need for optical components to support faster, more efficient data transmission. Companies such as Ericsson, Cisco, and Huawei are at the forefront of integrating photonics in network systems, with a focus on optical fibers and components that enhance network speed and reliability.
The increasing global digitalization, alongside the rise of cloud computing and IoT, is expected to further fuel the growth of photonics in the IT & telecom sector. As the demand for faster and more reliable communications continues to rise, the IT & telecom industry will remain a key driver of photonics market growth.
The industry is witnessing a phenomenal growth trajectory due to the incessant quest for knowledge and technology breakthroughs in fiber optics, laser technology, and advanced imaging solutions. The telecommunications sector continues to bear the brunt of the high-speed fiber optic networks and data transmission systems demand which, in turn, decelerates investment in photonics with ultra-low-loss and high performance.
The Healthcare and BioPhotonics sector is on the fast track to progress courtesy of the developments in non-invasive imaging technologies, laser-based treatments, and innovative applications of biosensors. The aerospace & defense industry is heavily reliant on photonics for LIDAR, surveillance, and targeting systems with high accuracy where longevity and dependability are prime considerations.
Consumer electronics, like smartphones, AR/VR devices, and optical sensors, are in constant need of miniaturized and cost-efficient photonic solutions. Conversely, industrial manufacturing is transformed through the use of laser cutting, 3D printing, and optical inspection systems with the emphasis on high accuracy and energy conservation.
The industry is gradually progressing towards silicon photonics, quantum optics, and AI-driven imaging which will lead to performance enhancement and cost reduction along with the appearance of new technologies in all sectors.
| Company | Contract/Release Details |
|---|---|
| STMicroelectronics and Amazon Web Services (AWS) | STMicroelectronics announced the launch of a new photonics chip, developed in partnership with AWS, aimed at enhancing speed and reducing power consumption in AI data centers. The chips are expected to enter production later this year. |
| European Union and Dutch Photonic Chip Plants | The European Union will invest €133 million in pilot production facilities for photonic semiconductors in the Netherlands, as part of a broader €380 million initiative to bolster semiconductor production across Europe. |
| Global Foundries | Global Foundries plans to establish a USD 575 million advanced chip packaging and testing center at its Fab 8 campus in Malta, focusing on photonics technology. The project is supported by a USD 75 million grant from the USA Commerce Department and USD 20 million from New York State. |
| QuantX Labs | QuantX Labs received USD 6.4 million in federal funding from the Advanced Strategic Capabilities Accelerator to develop their high-precision timing device, the Cryoclock, enhancing Australia's over-the-horizon radar network. |
| Lightmatter | Photonic startup Lightmatter raised USD 400 million in a Series D funding round to manufacture and deploy photonic chips in data centers, aiming to enhance AI cluster performance and efficiency. |
The global photonics market is at risk due to the likelihood of technological disruptions, significant research and development expenditure, and worldwide political issues. The ongoing improvements in optical communication, quantum computing, and laser technologies result in a correspondingly competitive environment in which companies must adapt and innovate easily to be on the market. Not being able to go in with the times would result in being left behind.
The other big challenge remains the large amounts of capital needed to establish a manufacturing unit for photonics. The production line of fiber optics, laser diodes, and optical sensors requires systematic materials and high precision work, hence increasing cost barriers and making a problem for new entrants. The companies which are unable to scale production effectively in the first place can have a hard time achieving profitability.
The geopolitical conditions very much affect the supply chains, particularly those associated with rare-earth elements and semiconductors which are used in photonic components. Trade restrictions, export bans, and fluctuating tariffs might, in turn, lead to the unavailability of some key materials, thus dealing with price volatility and supply shortages. Over-reliance on a small number of dominant companies within the semiconductor sector further exacerbates the prospects.
| Countries | CAGR (2025 to 2035) |
|---|---|
| The USA | 6.3% |
| The UK | 5.4% |
| France | 4.8% |
| Germany | 5.0% |
| Italy | 4.6% |
| South Korea | 5.8% |
| Japan | 5.2% |
| China | 7.0% |
| Australia | 4.5% |
| New Zealand | 4.2% |
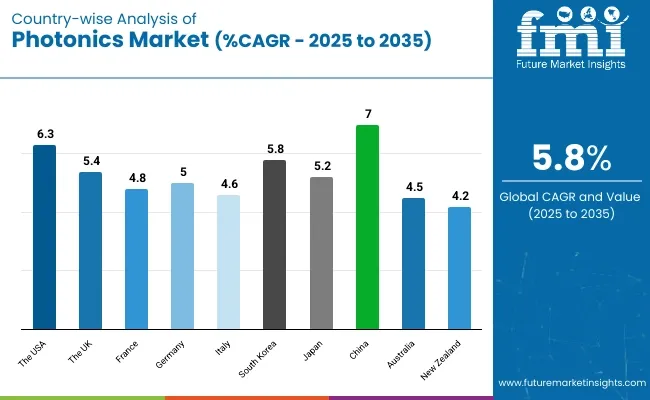
The USA photonics market will expand at a 6.3% CAGR from 2025 to 2035 on account of technological advancements, government expenditure growth, and growing demand for high-speed optical communication. The nation is a global leader in R&D in photonics, and major players make investments in semiconductor photonics, quantum optics, and integrated photonics.
Silicon photonics is one of the key drivers of AI and data center expansion, with companies developing power-efficient optical interconnects. The USA defense and aerospace industries depend on photonics for high-order sensing, navigation, and defense systems. The healthcare industry enjoys diagnostics and medical imaging using lasers and photonic therapies.
The nation's robust semiconductor sector and public-private partnerships between academia and the private sector drive innovation in photonics. Additionally, the adoption of LiDAR technology in autonomous cars continues to drive innovation further. The USA government drives photonics through programs such as the National Photonics Initiative (NPI) to continue driving innovation and next-generation technology commercialization further.
The UK photonics industry will grow at a 5.4% CAGR from 2025 to 2035, with strong growth in industrial manufacturing, healthcare, and communications industries. The nation has a well-established photonics ecosystem facilitated by innovation centers and research institutions that spearhead the development of laser systems, fiber optics, and quantum technologies.
The progress of Industry 4.0 and smart manufacturing has been driving the need for laser processing and optical sensing forward. In the medical field, biophotonics are also gaining prominence in non-invasive diagnostics and imaging systems. Quantum photonics is not going to be left behind in the UK, either, with government-sponsored initiatives taking quantum computing and secure communication forward.
The requirements of 5G implementations and broadband speeds further solidify the position of fiber optic technology. Photonics are being incorporated into future-proof communications networks by companies, with greater data rates promising as they continue to evolve. With increased investments and open policies, the UK is a robust photonics innovation hub.
France's photonics industry will advance at a 4.8% CAGR during the 2025 to 2035 period, driven by its superiority in optics, lasers, and quantum. France possesses a highly concentrated photonics cluster with elite research institutions interacting with industry partners to create leading photonic devices.
Photonics is being used by the aerospace and defense industries in laser weapons, secure optical communications, and satellite imagery. The French healthcare industry also applies biophotonics to improve diagnostics and surgical accuracy. Increasing applications of photonic sensors in industrial automation also drive market growth.
France remains the leading country in quantum photonics, and the government's policy is to improve quantum computing and quantum encryption technology. State subsidies and EU-financed projects strengthen the industry for further development.
The German photonics industry will develop at a 5.0% CAGR in the forecast period of 2025 to 2035 on account of its robust manufacturing base, advancements in optical technology, and leadership in the production of lasers. Germany is the largest market for photonics in Europe, and it has widespread uses in the automotive, medical, and telecommunication sectors.
Industry 4.0 technologies are generating demand for precise laser processing, machine vision, and optical sensing. Automotive technology has autonomous vehicles equipped with LiDAR technology, while the medical industry continues to invest in photonic medical devices.
Germany also leads in photonic semiconductor production, which makes chips for high-speed computing and 5G communication. Its research setup is financed by money, both public and private, and it stays updated on technological innovation.
Italy's photonics industry will expand at a 4.6% CAGR during 2025 to 2035 on the back of its excellence in industrial applications, optical imaging, and laser technology. Italy is also a leader in photonics, art restoration, medical imaging, and automotive lighting.
Photonics are being embraced by manufacturing for laser cutting, precision machining, and metrology, leading to enhanced production efficiency. Optical technology in the healthcare sector is enhancing diagnostic capacity, particularly for ophthalmology and dermatology.
Italy also invests in green photonics with research targeted at energy-saving lighting and solar cell technology. With state-sponsored programs financing photonics research, Italy remains a central presence in European photonics, albeit declining.
South Korea's photonics market will expand at a 5.8% CAGR from 2025 to 2035, fueled by high-tech uptake, the robust semiconductor sector, and government spending on next-generation optics. South Korea is among the strongest nations in OLED display technology, laser production, and photonic consumer electronics sensors.
Its growth in 6G communications networks and optical computing based on AI drives the demand for photonics. South Korea also utilizes photonics in its rapidly growing robotics sector to improve machine vision and automation. With emphasis on high-end quantum communication and photonic AI chips, the nation continues to be at the forefront of cutting-edge photonic applications.
Japan's photonics industry will grow at a 5.2% CAGR from 2025 through 2035, driven by its dominance of precision optics, semiconductor photonics, and high-end laser systems. Japan dominates photonic integration into consumer products, medical devices, and industrial automation.
Japanese companies are still at the forefront of silicon photonics development, which increases the capacity of data transmission. LiDAR-based navigation and photonic sensors increase automotive safety and vehicle technology. Long-term growth of the photonics industry is maintained through substantial R&D outlays and partnerships between industry and universities.
The industry is likely to expand at a 7.0% CAGR from 2025 to 2035 on the strength of its leadership in fiber optics, laser production, and quantum photonics. China is also leading the world in developing photonic chips, which are used in AI computing and ultra-high-speed communication.
With record levels of expenditure in LiDAR, 5G, and optical sensors, China is unequivocally still a world leader in photonics. Its setup manufacturing hub allows for quick commercialization of photonic technology. With friendly policies towards domestic semiconductors and quantum technology, China is still an influence in photonics.
The industry is likely to grow at a 4.5% CAGR from 2025 to 2035 due to the expansion of optical sensing, quantum photonics, and defense technology. Australia is far ahead in photonics research, with universities creating advanced laser technologies.
Photonic sensors are utilized in the mining sector for resource exploration, and biophotonics are used in the healthcare sector for diagnosis. Government-funded research activities continue to improve photonics capabilities, fueling market growth.
New Zealand's photonics industry will grow at a 4.2% Compound Annual Growth Rate during 2025 to 2035 on the strength of growth from agriculture, health, and environment monitoring. Photonics is leading precision farming, and laser imaging enables medical uses.
Photonics applications within industries are not controlled in New Zealand since research institutions have led the way in optical sensors and quantum optics technologies. The development of high-tech sectors ensures constant demand for photonic technology.
The photonics market is growing by leaps and bounds due to the speedy developments in technology, miniaturization, and integration with such new fields as silicon photonics and quantum computing. The adoption has also propelled the increasing use of fiber optics, photonic integrated circuits (PICs), lasers, and optical sensors, which form the foundation of competition across telecommunications, healthcare, and industrial automation.
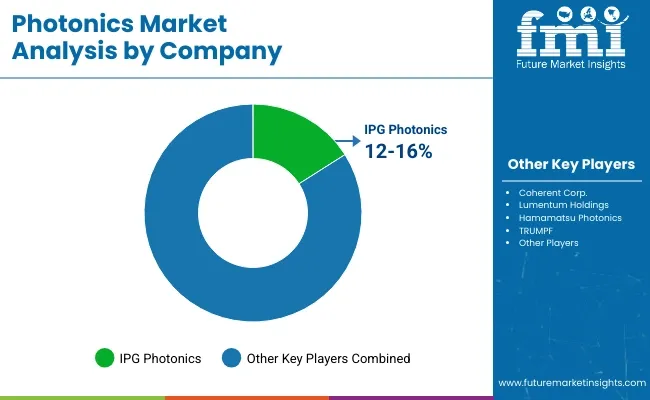
Leading players such as IPG Photonics, Coherent Corp, Lumentum Holdings, Hamamatsu Photonics, and TRUMPF have a stranglehold on the market owing to their investment in R&D, advanced manufacturing facilities, and extensive product portfolios, while start-ups and niche players are disrupting conventional markets through innovations in AI-driven optics, quantum photonics, as well as energy-efficient laser systems.
High-speed optical communication, biomedical imaging advancement, and extension of photonics into sensors for autonomous vehicles and LiDAR technology are responsible for mobilizing the market. The organizations also focus on everything from cost efficiency and energy consumption to scalability of production in their attempts to match the rising demand.
Government regulations, regional manufacturing capabilities, supply chain resilience, and partnerships between academia and industry are among the strategic factors shaping the competition. Ultimately, this fast-evolving market will embrace firms that invest in next-generation photonic solutions alongside smart manufacturing processes as well as cross-industry collaboration.
Recent Developments
In 2024, STMicroelectronics released a new photonics chip that was co-developed with Amazon Web Services (AWS). The chip is designed to increase speed and lower power consumption in AI data centers through light-based transceivers.
In 2024, Exail took over Leukos, a company specializing in advanced laser sources for metrology, spectroscopy, and imaging applications, to enhance its capabilities in photonics technologies.
| Report Attributes | Details |
|---|---|
| Current Total Market Size (2025) | USD 988.71 billion |
| Projected Market Size (2035) | USD 1,733.49 billion |
| CAGR (2025 to 2035) | 5.8% |
| Base Year for Estimation | 2024 |
| Historical Period | 2020 to 2024 |
| Projections Period | 2025 to 2035 |
| Quantitative Units | USD billion for dollar sales |
| Product Types Analyzed (Segment 1) | Lasers, Optical Components, Sensors & Detectors, LEDs & OLEDs, Photonics Integrated Circuits (PICs), Display Technologies |
| Materials Analyzed (Segment 2) | Silicon, Gallium Arsenide, Indium Phosphide, Silicon Carbide, Others |
| Industries Analyzed (Segment 3) | Telecommunication & IT, Healthcare & Life Sciences, Consumer Electronics, Aerospace & Defense, Manufacturing & Industrial, Automotive, Other Industries |
| Regions Covered | North America, Latin America, East Asia, South Asia & Pacific, Western Europe, Eastern Europe, Middle East and Africa (MEA) |
| Countries Covered | United States, Canada, Mexico, Brazil, Argentina, Germany, France, United Kingdom, Italy, Spain, Netherlands, China, India, Japan, South Korea, ANZ, GCC Countries, South Africa |
| Key Players influencing the Photonics Market | IPG Photonics, Coherent Corp., Lumentum Holdings, Hamamatsu Photonics, TRUMPF, Jenoptik, MKS Instruments, AMS-OSRAM, II-VI Incorporated |
| Additional Attributes | dollar sales, CAGR trends, product type segmentation, material-based demand, industry-specific adoption trends, competitor dollar sales & market share, regional growth patterns |
In terms of product type, the industry is divided into Lasers, Optical Components, Sensors & Detectors, LEDs & OLEDs, Photonics Integrated Circuits (PICs) and Display Technologies.
In terms of material, the industry is divided into Silicon, Gallium Arsenide, Indium Phosphide, Silicon Carbide and Others.
The industry is classified as Telecommunication & IT, Healthcare & Life Sciences, Consumer Electronics, Aerospace & Defense, Manufacturing & Industrial, Automotive and Other Industries.
Key countries of North America, Latin America, East Asia, South Asia & Pacific, Western Europe, Eastern Europe, and Middle East & Africa (MEA) have been covered in the report.
The global Photonics industry is projected to witness CAGR of 5.8% between 2025 and 2035.
The global Photonics industry stood at USD 941,140.3 million in 2024.
The global Photonics industry is anticipated to reach USD 1,733,488.4 million by 2035 end.
South Asia & Pacific is set to record the highest CAGR of 15.4% in the assessment period.
The key players operating in the global Photonics industry IPG Photonics, Coherent Corp., Lumentum Holdings, Hamamatsu Photonics, TRUMPF among others.


Full Research Suite comprises of:
Market outlook & trends analysis
Interviews & case studies
Strategic recommendations
Vendor profiles & capabilities analysis
5-year forecasts
8 regions and 60+ country-level data splits
Market segment data splits
12 months of continuous data updates
DELIVERED AS:
PDF EXCEL ONLINE
Biophotonics Market Growth - Trends & Forecast 2025 to 2035
Quantum Photonics Market Size and Share Forecast Outlook 2025 to 2035

Thank you!
You will receive an email from our Business Development Manager. Please be sure to check your SPAM/JUNK folder too.
Chat With
MaRIA