Crystal Malt Market Size and Share Forecast Outlook 2025 to 2035

The Crystal Malt Market is estimated to be valued at USD 570.3 million in 2025 and is projected to reach USD 844.2 million by 2035, registering a compound annual growth rate (CAGR) of 4.0% over the forecast period.
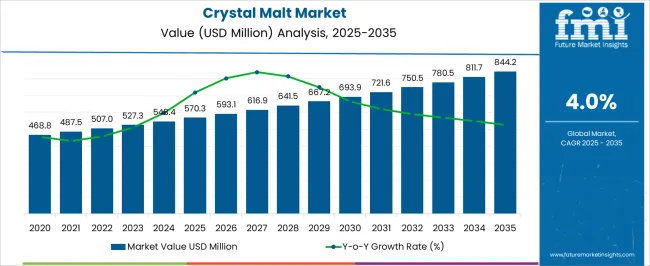
Quick Stats for Crystal Malt Market

  • Crystal Malt Market Value (2025): USD 570.3 million
  • Crystal Malt Market Forecast Value (2035): USD 844.2 million
  • Crystal Malt Market Forecast CAGR: 4.0%
  • Leading Segment in Crystal Malt Market in 2025: Conventional Crystal Malt (64.1%)
  • Key Growth Regions in Crystal Malt Market: North America, Asia-Pacific, Europe
  • Top Key Players in Crystal Malt Market: Cargill, Inc, Minch Malt Ltd, Simpsons Malt, Great Western Malting, Crisp Malting Group Ltd, BSG CraftBrewing, Proximity Malt
Crystal Malt Market Market Value Analysis

Crystal Malt Market Key Takeaways

Metric Value
Crystal Malt Market Estimated Value in (2025 E) USD 570.3 million
Crystal Malt Market Forecast Value in (2035 F) USD 844.2 million
Forecast CAGR (2025 to 2035) 4.0%

Why is the Crystal Malt Market Growing?

The Crystal Malt market is witnessing steady growth driven by the rising global demand for specialty malts in beverage production, particularly beer brewing. Current market conditions reflect a preference for malt varieties that enhance flavor, color, and aroma while providing consistency in brewing applications. The market is supported by increasing investments in craft and industrial breweries and a growing consumer inclination toward premium and flavored beer products.

Factors such as ease of integration into existing brewing processes and the ability to produce distinctive sensory profiles are enabling broader adoption. Additionally, the trend of experimenting with innovative brewing techniques and specialty malt blends is contributing to the expansion of the market.

The emphasis on quality ingredients, coupled with the increasing awareness of product origin and production methods, is encouraging breweries to adopt high-quality crystal malts Moving forward, opportunities are expected in the development of new malt varieties, enhanced flavor profiles, and sustainable sourcing methods, which will support long-term growth across both established and emerging beer markets.

Segmental Analysis

The crystal malt market is segmented by nature, source, end use, and geographic regions. By nature, crystal malt market is divided into Conventional Crystal Malt and Organic Crystal Malt. In terms of source, crystal malt market is classified into Barley, Rye, and Wheat. Based on end use, crystal malt market is segmented into Beer Breweries, Beverages, Alcoholic, Non-Alcoholic, and Bakery And Confectionery. Regionally, the crystal malt industry is classified into North America, Latin America, Western Europe, Eastern Europe, Balkan & Baltic Countries, Russia & Belarus, Central Asia, East Asia, South Asia & Pacific, and the Middle East & Africa.
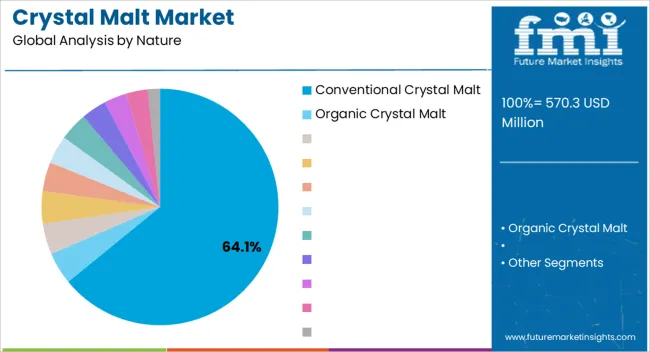
Insights into the Conventional Crystal Malt Segment

Crystal Malt Market Analysis By Nature

The Conventional Crystal Malt segment is projected to hold 64.10% of the overall Crystal Malt market revenue share in 2025, establishing it as the leading type within the market. This dominance is being driven by its consistent performance in enhancing beer flavor, aroma, and color, which aligns with the brewing requirements of large-scale and craft breweries.

Adoption has been accelerated by the malt’s ability to produce predictable results in fermentation, supporting scalability and quality control. Furthermore, its widespread availability and standardized production processes have ensured reliable supply chains, reducing operational risk for brewers.

The segment has benefited from increased consumer preference for beers with rich, balanced flavors, as well as from breweries seeking versatile malt that can be combined with other specialty malts to create differentiated products Future growth is expected to be supported by continuous innovation in brewing techniques and increasing demand for premium and flavored beers, which require high-quality crystal malts capable of delivering consistent sensory attributes.
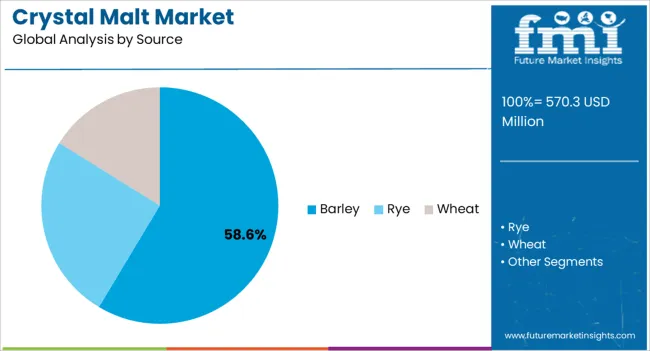
Insights into the Barley Source Segment

Crystal Malt Market Analysis By Source

Barley is expected to account for 58.60% of the Crystal Malt market revenue share in 2025, making it the dominant source for malt production. The segment’s growth is being driven by barley’s superior malting properties, including high enzyme activity, favorable protein content, and predictable gelatinization characteristics, which contribute to consistent brewing performance.

Barley-based malts are preferred for their ability to deliver uniform flavor, aroma, and color, making them the choice for large-scale industrial breweries as well as craft beer producers. The reliability of barley supply, supported by established agricultural practices and global cultivation networks, has further strengthened this segment.

Additionally, barley’s versatility allows it to be adapted into various malt types, providing brewers with flexibility in developing diverse beer profiles With breweries increasingly focusing on quality, efficiency, and flavor consistency, the barley source segment is expected to maintain its leadership and continue supporting the expansion of the Crystal Malt market.
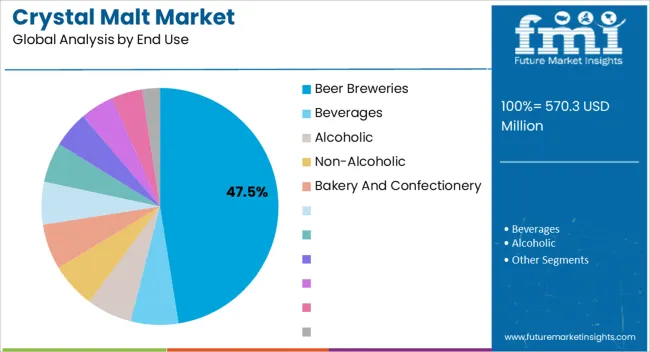
Insights into the Beer Breweries End-Use Segment

Crystal Malt Market Analysis By End Use

The Beer Breweries end-use segment is anticipated to hold 47.50% of the total Crystal Malt market revenue in 2025, establishing it as the largest consuming industry for crystal malt. This leading position is being driven by the consistent demand for specialty malts that enhance flavor, color, and aroma while maintaining stability during fermentation.

Breweries are increasingly relying on crystal malts to create distinct beer profiles that cater to both mainstream and craft markets, reflecting a growing consumer preference for premium and artisanal beer products. The segment has benefited from the expansion of commercial and craft brewing operations, along with the rising adoption of innovative brewing techniques that require high-quality malt inputs.

Additionally, the integration of crystal malt into standardized brewing recipes has improved operational efficiency and product consistency, further reinforcing its adoption With the ongoing global growth of the beer industry and increasing focus on flavor differentiation, the beer breweries segment is expected to continue its dominance, driving long-term demand for crystal malts.

Market Overview

Crystal Malt market Outlook

Malt is produced from grains through a process known as malting, which comprises partial germination, to adjust or change the grains' natural food substances. Malt is mostly prepared from barley, while corn, rice wheat, and rye are utilized less as often as possible.

The primary use of malt is in fermenting/brewing beer and in preparing other alcoholic and non-alcoholic beverages. Besides, the malt is widely used in confectioneries and baked goods. The extensive use of malt in beers, alcohol, other drinks, and food products make it a go-to product for food and beverage industry.

Crystal malt is a category of malt made from specialty grains and is used to incorporate and manipulate the flavour and colour of any brew. Crystal malt is a conventional British colour malt next to chocolate, amber, brown, and black malts, and is used to provide the desired colour to any beer and other beverages. Crystal malts are valued conferring to their colour depth, which is usually expressed in degrees Lovibond (°L). Crystal malts range from 20° L to around 200° L with the most common crystals in the range of 30° to 40°. Crystal malt is prepared from steeped and germinated barley grains.

The germinated grains are then stewed followed by a process called as kilning. Addition of crystal malt is a common way to add a sweet essence to beer. The saccharinity of crystal malt has distinctive caramel tone, and thus the crystal malts are occasionally called as caramel malts. Crystal malt sweetness is the main characteristic of numerous styles of beer.
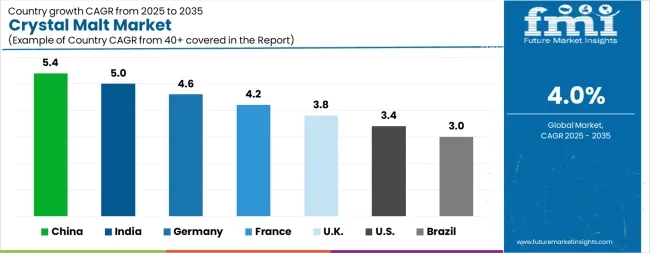
Analysis of Crystal Malt Market By Key Countries

Crystal Malt Market Cagr Analysis By Country
Country CAGR
China 5.4%
India 5.0%
Germany 4.6%
France 4.2%
UK 3.8%
USA 3.4%
Brazil 3.0%

Country-wise Analysis

The Crystal Malt Market is expected to register a CAGR of 4.0% during the forecast period, exhibiting varied country level momentum. China leads with the highest CAGR of 5.4%, followed by India at 5.0%. Developed markets such as Germany, France, and the UK continue to expand steadily, while the USA is likely to grow at consistent rates. Brazil posts the lowest CAGR at 3.0%, yet still underscores a broadly positive trajectory for the global Crystal Malt Market. In 2024, Germany held a dominant revenue in the Western Europe market and is expected to grow with a CAGR of 4.6%. The USA Crystal Malt Market is estimated to be valued at USD 215.4 million in 2025 and is anticipated to reach a valuation of USD 300.9 million by 2035. Sales are projected to rise at a CAGR of 3.4% over the forecast period between 2025 and 2035. While Japan and South Korea markets are estimated to be valued at USD 27.8 million and USD 14.5 million respectively in 2025.
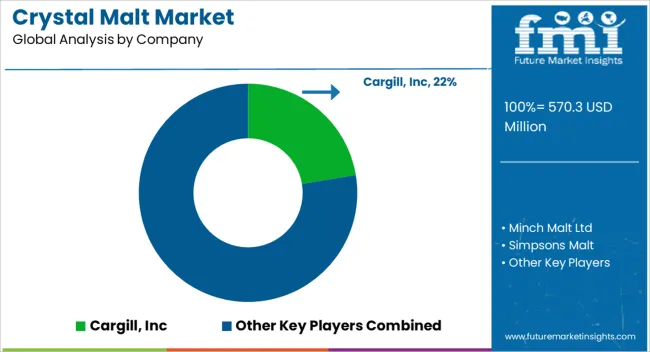
Key Players in the Crystal Malt Market

Crystal Malt Market Analysis By Company

  • Cargill, Inc
  • Minch Malt Ltd
  • Simpsons Malt
  • Great Western Malting
  • Crisp Malting Group Ltd
  • BSG CraftBrewing
  • Proximity Malt

Scope of the Report

Item Value
Quantitative Units USD 570.3 Million
Nature Conventional Crystal Malt and Organic Crystal Malt
Source Barley, Rye, and Wheat
End Use Beer Breweries, Beverages, Alcoholic, Non-Alcoholic, and Bakery And Confectionery
Regions Covered North America, Europe, Asia-Pacific, Latin America, Middle East & Africa
Country Covered United States, Canada, Germany, France, United Kingdom, China, Japan, India, Brazil, South Africa
Key Companies Profiled Cargill, Inc, Minch Malt Ltd, Simpsons Malt, Great Western Malting, Crisp Malting Group Ltd, BSG CraftBrewing, and Proximity Malt

Crystal Malt Market by Segments

Nature:

  • Conventional Crystal Malt
  • Organic Crystal Malt

Source:

  • Barley
  • Rye
  • Wheat

End Use:

  • Beer Breweries
  • Beverages
  • Alcoholic
  • Non-Alcoholic
  • Bakery And Confectionery

Region:

  • North America
    • USA
    • Canada
    • Mexico
  • Latin America
    • Brazil
    • Chile
    • Rest of Latin America
  • Western Europe
    • Germany
    • UK
    • Italy
    • Spain
    • France
    • Nordic
    • BENELUX
    • Rest of Western Europe
  • Eastern Europe
    • Russia
    • Poland
    • Hungary
    • Balkan & Baltic
    • Rest of Eastern Europe
  • East Asia
    • China
    • Japan
    • South Korea
  • South Asia and Pacific
    • India
    • ASEAN
    • Australia & New Zealand
    • Rest of South Asia and Pacific
  • Middle East & Africa
    • Kingdom of Saudi Arabia
    • Other GCC Countries
    • Turkiye
    • South Africa
    • Other African Union
    • Rest of Middle East & Africa

Table of Content

X
  1. Executive Summary
    • Global Market Outlook
    • Demand-side Trends
    • Supply-side Trends
    • Technology Roadmap Analysis
    • Analysis and Recommendations
  2. Market Overview
    • Market Coverage / Taxonomy
    • Market Definition / Scope / Limitations
  3. Market Background
    • Market Dynamics
      • Drivers
      • Restraints
      • Opportunity
      • Trends
    • Scenario Forecast
      • Demand in Optimistic Scenario
      • Demand in Likely Scenario
      • Demand in Conservative Scenario
    • Opportunity Map Analysis
    • Product Life Cycle Analysis
    • Supply Chain Analysis
    • Investment Feasibility Matrix
    • Value Chain Analysis
    • PESTLE and Porter’s Analysis
    • Regulatory Landscape
    • Regional Parent Market Outlook
    • Production and Consumption Statistics
    • Import and Export Statistics
  4. Global Market Analysis 2020 to 2024 and Forecast, 2025 to 2035
    • Historical Market Size Value (USD Million) Analysis, 2020 to 2024
    • Current and Future Market Size Value (USD Million) Projections, 2025 to 2035
      • Y-o-Y Growth Trend Analysis
      • Absolute $ Opportunity Analysis
  5. Global Market Pricing Analysis 2020 to 2024 and Forecast 2025 to 2035
  6. Global Market Analysis 2020 to 2024 and Forecast 2025 to 2035, By Nature
    • Introduction / Key Findings
    • Historical Market Size Value (USD Million) Analysis By Nature , 2020 to 2024
    • Current and Future Market Size Value (USD Million) Analysis and Forecast By Nature , 2025 to 2035
      • Conventional
      • Organic
    • Y-o-Y Growth Trend Analysis By Nature , 2020 to 2024
    • Absolute $ Opportunity Analysis By Nature , 2025 to 2035
  7. Global Market Analysis 2020 to 2024 and Forecast 2025 to 2035, By Source
    • Introduction / Key Findings
    • Historical Market Size Value (USD Million) Analysis By Source, 2020 to 2024
    • Current and Future Market Size Value (USD Million) Analysis and Forecast By Source, 2025 to 2035
      • Barley
      • Rye
      • Wheat
    • Y-o-Y Growth Trend Analysis By Source, 2020 to 2024
    • Absolute $ Opportunity Analysis By Source, 2025 to 2035
  8. Global Market Analysis 2020 to 2024 and Forecast 2025 to 2035, By End Use
    • Introduction / Key Findings
    • Historical Market Size Value (USD Million) Analysis By End Use, 2020 to 2024
    • Current and Future Market Size Value (USD Million) Analysis and Forecast By End Use, 2025 to 2035
      • Beer Breweries
      • Beverages
      • Alcoholic
      • Non-Alcoholic
      • Bakery And Confectionery
    • Y-o-Y Growth Trend Analysis By End Use, 2020 to 2024
    • Absolute $ Opportunity Analysis By End Use, 2025 to 2035
  9. Global Market Analysis 2020 to 2024 and Forecast 2025 to 2035, By Region
    • Introduction
    • Historical Market Size Value (USD Million) Analysis By Region, 2020 to 2024
    • Current Market Size Value (USD Million) Analysis and Forecast By Region, 2025 to 2035
      • North America
      • Latin America
      • Western Europe
      • Eastern Europe
      • East Asia
      • South Asia and Pacific
      • Middle East & Africa
    • Market Attractiveness Analysis By Region
  10. North America Market Analysis 2020 to 2024 and Forecast 2025 to 2035, By Country
    • Historical Market Size Value (USD Million) Trend Analysis By Market Taxonomy, 2020 to 2024
    • Market Size Value (USD Million) Forecast By Market Taxonomy, 2025 to 2035
      • By Country
        • USA
        • Canada
        • Mexico
      • By Nature
      • By Source
      • By End Use
    • Market Attractiveness Analysis
      • By Country
      • By Nature
      • By Source
      • By End Use
    • Key Takeaways
  11. Latin America Market Analysis 2020 to 2024 and Forecast 2025 to 2035, By Country
    • Historical Market Size Value (USD Million) Trend Analysis By Market Taxonomy, 2020 to 2024
    • Market Size Value (USD Million) Forecast By Market Taxonomy, 2025 to 2035
      • By Country
        • Brazil
        • Chile
        • Rest of Latin America
      • By Nature
      • By Source
      • By End Use
    • Market Attractiveness Analysis
      • By Country
      • By Nature
      • By Source
      • By End Use
    • Key Takeaways
  12. Western Europe Market Analysis 2020 to 2024 and Forecast 2025 to 2035, By Country
    • Historical Market Size Value (USD Million) Trend Analysis By Market Taxonomy, 2020 to 2024
    • Market Size Value (USD Million) Forecast By Market Taxonomy, 2025 to 2035
      • By Country
        • Germany
        • UK
        • Italy
        • Spain
        • France
        • Nordic
        • BENELUX
        • Rest of Western Europe
      • By Nature
      • By Source
      • By End Use
    • Market Attractiveness Analysis
      • By Country
      • By Nature
      • By Source
      • By End Use
    • Key Takeaways
  13. Eastern Europe Market Analysis 2020 to 2024 and Forecast 2025 to 2035, By Country
    • Historical Market Size Value (USD Million) Trend Analysis By Market Taxonomy, 2020 to 2024
    • Market Size Value (USD Million) Forecast By Market Taxonomy, 2025 to 2035
      • By Country
        • Russia
        • Poland
        • Hungary
        • Balkan & Baltic
        • Rest of Eastern Europe
      • By Nature
      • By Source
      • By End Use
    • Market Attractiveness Analysis
      • By Country
      • By Nature
      • By Source
      • By End Use
    • Key Takeaways
  14. East Asia Market Analysis 2020 to 2024 and Forecast 2025 to 2035, By Country
    • Historical Market Size Value (USD Million) Trend Analysis By Market Taxonomy, 2020 to 2024
    • Market Size Value (USD Million) Forecast By Market Taxonomy, 2025 to 2035
      • By Country
        • China
        • Japan
        • South Korea
      • By Nature
      • By Source
      • By End Use
    • Market Attractiveness Analysis
      • By Country
      • By Nature
      • By Source
      • By End Use
    • Key Takeaways
  15. South Asia and Pacific Market Analysis 2020 to 2024 and Forecast 2025 to 2035, By Country
    • Historical Market Size Value (USD Million) Trend Analysis By Market Taxonomy, 2020 to 2024
    • Market Size Value (USD Million) Forecast By Market Taxonomy, 2025 to 2035
      • By Country
        • India
        • ASEAN
        • Australia & New Zealand
        • Rest of South Asia and Pacific
      • By Nature
      • By Source
      • By End Use
    • Market Attractiveness Analysis
      • By Country
      • By Nature
      • By Source
      • By End Use
    • Key Takeaways
  16. Middle East & Africa Market Analysis 2020 to 2024 and Forecast 2025 to 2035, By Country
    • Historical Market Size Value (USD Million) Trend Analysis By Market Taxonomy, 2020 to 2024
    • Market Size Value (USD Million) Forecast By Market Taxonomy, 2025 to 2035
      • By Country
        • Kingdom of Saudi Arabia
        • Other GCC Countries
        • Turkiye
        • South Africa
        • Other African Union
        • Rest of Middle East & Africa
      • By Nature
      • By Source
      • By End Use
    • Market Attractiveness Analysis
      • By Country
      • By Nature
      • By Source
      • By End Use
    • Key Takeaways
  17. Key Countries Market Analysis
    • USA
      • Pricing Analysis
      • Market Share Analysis, 2024
        • By Nature
        • By Source
        • By End Use
    • Canada
      • Pricing Analysis
      • Market Share Analysis, 2024
        • By Nature
        • By Source
        • By End Use
    • Mexico
      • Pricing Analysis
      • Market Share Analysis, 2024
        • By Nature
        • By Source
        • By End Use
    • Brazil
      • Pricing Analysis
      • Market Share Analysis, 2024
        • By Nature
        • By Source
        • By End Use
    • Chile
      • Pricing Analysis
      • Market Share Analysis, 2024
        • By Nature
        • By Source
        • By End Use
    • Germany
      • Pricing Analysis
      • Market Share Analysis, 2024
        • By Nature
        • By Source
        • By End Use
    • UK
      • Pricing Analysis
      • Market Share Analysis, 2024
        • By Nature
        • By Source
        • By End Use
    • Italy
      • Pricing Analysis
      • Market Share Analysis, 2024
        • By Nature
        • By Source
        • By End Use
    • Spain
      • Pricing Analysis
      • Market Share Analysis, 2024
        • By Nature
        • By Source
        • By End Use
    • France
      • Pricing Analysis
      • Market Share Analysis, 2024
        • By Nature
        • By Source
        • By End Use
    • India
      • Pricing Analysis
      • Market Share Analysis, 2024
        • By Nature
        • By Source
        • By End Use
    • ASEAN
      • Pricing Analysis
      • Market Share Analysis, 2024
        • By Nature
        • By Source
        • By End Use
    • Australia & New Zealand
      • Pricing Analysis
      • Market Share Analysis, 2024
        • By Nature
        • By Source
        • By End Use
    • China
      • Pricing Analysis
      • Market Share Analysis, 2024
        • By Nature
        • By Source
        • By End Use
    • Japan
      • Pricing Analysis
      • Market Share Analysis, 2024
        • By Nature
        • By Source
        • By End Use
    • South Korea
      • Pricing Analysis
      • Market Share Analysis, 2024
        • By Nature
        • By Source
        • By End Use
    • Russia
      • Pricing Analysis
      • Market Share Analysis, 2024
        • By Nature
        • By Source
        • By End Use
    • Poland
      • Pricing Analysis
      • Market Share Analysis, 2024
        • By Nature
        • By Source
        • By End Use
    • Hungary
      • Pricing Analysis
      • Market Share Analysis, 2024
        • By Nature
        • By Source
        • By End Use
    • Kingdom of Saudi Arabia
      • Pricing Analysis
      • Market Share Analysis, 2024
        • By Nature
        • By Source
        • By End Use
    • Turkiye
      • Pricing Analysis
      • Market Share Analysis, 2024
        • By Nature
        • By Source
        • By End Use
    • South Africa
      • Pricing Analysis
      • Market Share Analysis, 2024
        • By Nature
        • By Source
        • By End Use
  18. Market Structure Analysis
    • Competition Dashboard
    • Competition Benchmarking
    • Market Share Analysis of Top Players
      • By Regional
      • By Nature
      • By Source
      • By End Use
  19. Competition Analysis
    • Competition Deep Dive
      • Cargill, Inc
        • Overview
        • Product Portfolio
        • Profitability by Market Segments (Product/Age /Sales Channel/Region)
        • Sales Footprint
        • Strategy Overview
          • Marketing Strategy
          • Product Strategy
          • Channel Strategy
      • Minch Malt Ltd
      • Simpsons Malt
      • Great Western Malting
      • Crisp Malting Group Ltd
      • BSG CraftBrewing
      • Proximity Malt
  20. Assumptions & Acronyms Used
  21. Research Methodology

List of Tables

  • Table 1: Global Market Value (USD Million) Forecast by Region, 2020-2035
  • Table 2: Global Market Value (USD Million) Forecast by Nature , 2020-2035
  • Table 3: Global Market Value (USD Million) Forecast by Source, 2020-2035
  • Table 4: Global Market Value (USD Million) Forecast by End Use, 2020-2035
  • Table 5: North America Market Value (USD Million) Forecast by Country, 2020-2035
  • Table 6: North America Market Value (USD Million) Forecast by Nature , 2020-2035
  • Table 7: North America Market Value (USD Million) Forecast by Source, 2020-2035
  • Table 8: North America Market Value (USD Million) Forecast by End Use, 2020-2035
  • Table 9: Latin America Market Value (USD Million) Forecast by Country, 2020-2035
  • Table 10: Latin America Market Value (USD Million) Forecast by Nature , 2020-2035
  • Table 11: Latin America Market Value (USD Million) Forecast by Source, 2020-2035
  • Table 12: Latin America Market Value (USD Million) Forecast by End Use, 2020-2035
  • Table 13: Western Europe Market Value (USD Million) Forecast by Country, 2020-2035
  • Table 14: Western Europe Market Value (USD Million) Forecast by Nature , 2020-2035
  • Table 15: Western Europe Market Value (USD Million) Forecast by Source, 2020-2035
  • Table 16: Western Europe Market Value (USD Million) Forecast by End Use, 2020-2035
  • Table 17: Eastern Europe Market Value (USD Million) Forecast by Country, 2020-2035
  • Table 18: Eastern Europe Market Value (USD Million) Forecast by Nature , 2020-2035
  • Table 19: Eastern Europe Market Value (USD Million) Forecast by Source, 2020-2035
  • Table 20: Eastern Europe Market Value (USD Million) Forecast by End Use, 2020-2035
  • Table 21: East Asia Market Value (USD Million) Forecast by Country, 2020-2035
  • Table 22: East Asia Market Value (USD Million) Forecast by Nature , 2020-2035
  • Table 23: East Asia Market Value (USD Million) Forecast by Source, 2020-2035
  • Table 24: East Asia Market Value (USD Million) Forecast by End Use, 2020-2035
  • Table 25: South Asia and Pacific Market Value (USD Million) Forecast by Country, 2020-2035
  • Table 26: South Asia and Pacific Market Value (USD Million) Forecast by Nature , 2020-2035
  • Table 27: South Asia and Pacific Market Value (USD Million) Forecast by Source, 2020-2035
  • Table 28: South Asia and Pacific Market Value (USD Million) Forecast by End Use, 2020-2035
  • Table 29: Middle East & Africa Market Value (USD Million) Forecast by Country, 2020-2035
  • Table 30: Middle East & Africa Market Value (USD Million) Forecast by Nature , 2020-2035
  • Table 31: Middle East & Africa Market Value (USD Million) Forecast by Source, 2020-2035
  • Table 32: Middle East & Africa Market Value (USD Million) Forecast by End Use, 2020-2035

List of Figures

  • Figure 1: Global Market Pricing Analysis
  • Figure 2: Global Market Value (USD Million) Forecast 2020-2035
  • Figure 3: Global Market Value Share and BPS Analysis by Nature , 2025 and 2035
  • Figure 4: Global Market Y-o-Y Growth Comparison by Nature , 2025-2035
  • Figure 5: Global Market Attractiveness Analysis by Nature
  • Figure 6: Global Market Value Share and BPS Analysis by Source, 2025 and 2035
  • Figure 7: Global Market Y-o-Y Growth Comparison by Source, 2025-2035
  • Figure 8: Global Market Attractiveness Analysis by Source
  • Figure 9: Global Market Value Share and BPS Analysis by End Use, 2025 and 2035
  • Figure 10: Global Market Y-o-Y Growth Comparison by End Use, 2025-2035
  • Figure 11: Global Market Attractiveness Analysis by End Use
  • Figure 12: Global Market Value (USD Million) Share and BPS Analysis by Region, 2025 and 2035
  • Figure 13: Global Market Y-o-Y Growth Comparison by Region, 2025-2035
  • Figure 14: Global Market Attractiveness Analysis by Region
  • Figure 15: North America Market Incremental Dollar Opportunity, 2025-2035
  • Figure 16: Latin America Market Incremental Dollar Opportunity, 2025-2035
  • Figure 17: Western Europe Market Incremental Dollar Opportunity, 2025-2035
  • Figure 18: Eastern Europe Market Incremental Dollar Opportunity, 2025-2035
  • Figure 19: East Asia Market Incremental Dollar Opportunity, 2025-2035
  • Figure 20: South Asia and Pacific Market Incremental Dollar Opportunity, 2025-2035
  • Figure 21: Middle East & Africa Market Incremental Dollar Opportunity, 2025-2035
  • Figure 22: North America Market Value Share and BPS Analysis by Country, 2025 and 2035
  • Figure 23: North America Market Value Share and BPS Analysis by Nature , 2025 and 2035
  • Figure 24: North America Market Y-o-Y Growth Comparison by Nature , 2025-2035
  • Figure 25: North America Market Attractiveness Analysis by Nature
  • Figure 26: North America Market Value Share and BPS Analysis by Source, 2025 and 2035
  • Figure 27: North America Market Y-o-Y Growth Comparison by Source, 2025-2035
  • Figure 28: North America Market Attractiveness Analysis by Source
  • Figure 29: North America Market Value Share and BPS Analysis by End Use, 2025 and 2035
  • Figure 30: North America Market Y-o-Y Growth Comparison by End Use, 2025-2035
  • Figure 31: North America Market Attractiveness Analysis by End Use
  • Figure 32: Latin America Market Value Share and BPS Analysis by Country, 2025 and 2035
  • Figure 33: Latin America Market Value Share and BPS Analysis by Nature , 2025 and 2035
  • Figure 34: Latin America Market Y-o-Y Growth Comparison by Nature , 2025-2035
  • Figure 35: Latin America Market Attractiveness Analysis by Nature
  • Figure 36: Latin America Market Value Share and BPS Analysis by Source, 2025 and 2035
  • Figure 37: Latin America Market Y-o-Y Growth Comparison by Source, 2025-2035
  • Figure 38: Latin America Market Attractiveness Analysis by Source
  • Figure 39: Latin America Market Value Share and BPS Analysis by End Use, 2025 and 2035
  • Figure 40: Latin America Market Y-o-Y Growth Comparison by End Use, 2025-2035
  • Figure 41: Latin America Market Attractiveness Analysis by End Use
  • Figure 42: Western Europe Market Value Share and BPS Analysis by Country, 2025 and 2035
  • Figure 43: Western Europe Market Value Share and BPS Analysis by Nature , 2025 and 2035
  • Figure 44: Western Europe Market Y-o-Y Growth Comparison by Nature , 2025-2035
  • Figure 45: Western Europe Market Attractiveness Analysis by Nature
  • Figure 46: Western Europe Market Value Share and BPS Analysis by Source, 2025 and 2035
  • Figure 47: Western Europe Market Y-o-Y Growth Comparison by Source, 2025-2035
  • Figure 48: Western Europe Market Attractiveness Analysis by Source
  • Figure 49: Western Europe Market Value Share and BPS Analysis by End Use, 2025 and 2035
  • Figure 50: Western Europe Market Y-o-Y Growth Comparison by End Use, 2025-2035
  • Figure 51: Western Europe Market Attractiveness Analysis by End Use
  • Figure 52: Eastern Europe Market Value Share and BPS Analysis by Country, 2025 and 2035
  • Figure 53: Eastern Europe Market Value Share and BPS Analysis by Nature , 2025 and 2035
  • Figure 54: Eastern Europe Market Y-o-Y Growth Comparison by Nature , 2025-2035
  • Figure 55: Eastern Europe Market Attractiveness Analysis by Nature
  • Figure 56: Eastern Europe Market Value Share and BPS Analysis by Source, 2025 and 2035
  • Figure 57: Eastern Europe Market Y-o-Y Growth Comparison by Source, 2025-2035
  • Figure 58: Eastern Europe Market Attractiveness Analysis by Source
  • Figure 59: Eastern Europe Market Value Share and BPS Analysis by End Use, 2025 and 2035
  • Figure 60: Eastern Europe Market Y-o-Y Growth Comparison by End Use, 2025-2035
  • Figure 61: Eastern Europe Market Attractiveness Analysis by End Use
  • Figure 62: East Asia Market Value Share and BPS Analysis by Country, 2025 and 2035
  • Figure 63: East Asia Market Value Share and BPS Analysis by Nature , 2025 and 2035
  • Figure 64: East Asia Market Y-o-Y Growth Comparison by Nature , 2025-2035
  • Figure 65: East Asia Market Attractiveness Analysis by Nature
  • Figure 66: East Asia Market Value Share and BPS Analysis by Source, 2025 and 2035
  • Figure 67: East Asia Market Y-o-Y Growth Comparison by Source, 2025-2035
  • Figure 68: East Asia Market Attractiveness Analysis by Source
  • Figure 69: East Asia Market Value Share and BPS Analysis by End Use, 2025 and 2035
  • Figure 70: East Asia Market Y-o-Y Growth Comparison by End Use, 2025-2035
  • Figure 71: East Asia Market Attractiveness Analysis by End Use
  • Figure 72: South Asia and Pacific Market Value Share and BPS Analysis by Country, 2025 and 2035
  • Figure 73: South Asia and Pacific Market Value Share and BPS Analysis by Nature , 2025 and 2035
  • Figure 74: South Asia and Pacific Market Y-o-Y Growth Comparison by Nature , 2025-2035
  • Figure 75: South Asia and Pacific Market Attractiveness Analysis by Nature
  • Figure 76: South Asia and Pacific Market Value Share and BPS Analysis by Source, 2025 and 2035
  • Figure 77: South Asia and Pacific Market Y-o-Y Growth Comparison by Source, 2025-2035
  • Figure 78: South Asia and Pacific Market Attractiveness Analysis by Source
  • Figure 79: South Asia and Pacific Market Value Share and BPS Analysis by End Use, 2025 and 2035
  • Figure 80: South Asia and Pacific Market Y-o-Y Growth Comparison by End Use, 2025-2035
  • Figure 81: South Asia and Pacific Market Attractiveness Analysis by End Use
  • Figure 82: Middle East & Africa Market Value Share and BPS Analysis by Country, 2025 and 2035
  • Figure 83: Middle East & Africa Market Value Share and BPS Analysis by Nature , 2025 and 2035
  • Figure 84: Middle East & Africa Market Y-o-Y Growth Comparison by Nature , 2025-2035
  • Figure 85: Middle East & Africa Market Attractiveness Analysis by Nature
  • Figure 86: Middle East & Africa Market Value Share and BPS Analysis by Source, 2025 and 2035
  • Figure 87: Middle East & Africa Market Y-o-Y Growth Comparison by Source, 2025-2035
  • Figure 88: Middle East & Africa Market Attractiveness Analysis by Source
  • Figure 89: Middle East & Africa Market Value Share and BPS Analysis by End Use, 2025 and 2035
  • Figure 90: Middle East & Africa Market Y-o-Y Growth Comparison by End Use, 2025-2035
  • Figure 91: Middle East & Africa Market Attractiveness Analysis by End Use
  • Figure 92: Global Market - Tier Structure Analysis
  • Figure 93: Global Market - Company Share Analysis

Frequently Asked Questions

How big is the crystal malt market in 2025?

The global crystal malt market is estimated to be valued at USD 570.3 million in 2025.

What will be the size of crystal malt market in 2035?

The market size for the crystal malt market is projected to reach USD 844.2 million by 2035.

How much will be the crystal malt market growth between 2025 and 2035?

The crystal malt market is expected to grow at a 4.0% CAGR between 2025 and 2035.

What are the key product types in the crystal malt market?

The key product types in crystal malt market are conventional crystal malt and organic crystal malt.

Which source segment to contribute significant share in the crystal malt market in 2025?

In terms of source, barley segment to command 58.6% share in the crystal malt market in 2025.

Explore Similar Insights

Future Market Insights

Crystal Malt Market

Chat With MaRIA

Chat With

MaRIA

Hi There, I am MaRIA, Your Market Research Intelligence Assistant. How may I help you?