Reports

- Global Locations -

Headquarters

Future Market Insights, Inc.

Christiana Corporate, 200
Continental Drive, Suite 401,
Newark, Delaware - 19713,
United States

T: +1-845-579-5705

Americas

Future Market Insights, Inc.

616 Corporate Way, Suite 2-9018,
Valley Cottage, NY 10989, United States

T: +1-347-918-3531

MEA

Future Market Insights

1602-6 Jumeirah Bay X2 Tower, Plot No: JLT-PH2-X2A,
Jumeirah Lakes Towers, Dubai,
United Arab Emirates

Europe

Future Market Insights

3rd Floor, 207 Regent Street,
W1B 3HH London
United Kingdom

T: + 44 (0) 20 8123 9659
D: +44 (0) 20 3287 4268

Asia Pacific

Future Market Insights

IndiaLand Global Tech Park, Unit UG-1, Behind Grand HighStreet, Phase 1, Hinjawadi, MH, Pune – 411057, India

Malt Beverage Market Outlook (2022-2032)

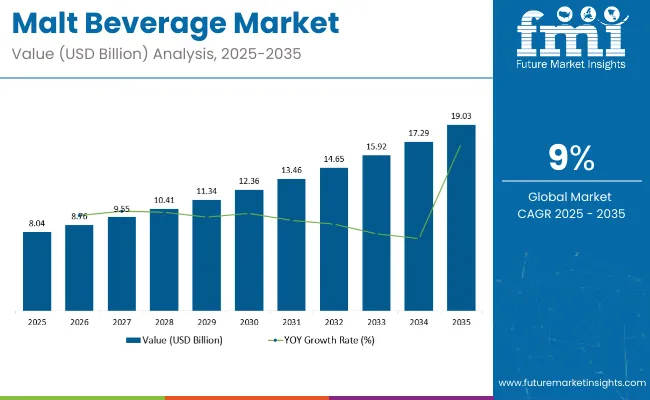
[324 Pages Report] The malt beverage market is expected to reach a malt beverage market evaluation of CAGR of 10.1% in the global malt beverage market, during the forecast period.

The malt beverage market future trend is likely to grow a valuation of US$ 6.43 Billion in 2022, and is anticipated to cross US$ 16.83 Billion by 2032.

Attributes Details
Malt Beverage Market Size (2022) US$ 6.43 Billion
Malt Beverage Market Size (2032) US$ 16.83 Billion
Malt Beverage Market CAGR 10.1%

Demand for malt beverage will recover steadily in the short term, with an optimistic malt beverage market growth outlook in the long run.

Sales of malt beverage have increased in recent years, owing to refined taste and a wider variety of flavours, as well as growing health concerns about sugary drinks.

In the next four to five years, the malt beverage market is expected to grow at a healthy CAGR. Major malt beverage market growth drivers include an increase in health-conscious consumers, as well as rising consumer preferences for organic malt beverage.

Breweries are emphasising the adoption of malt beverage in their products. Rising malt beverage prices in the coming years are expected to be a major restraining factor, slowing current malt beverage market growth and malt beverage market future trends.

Don't pay for what you don't need

Customize your report by selecting specific countries or regions and save 30%!

What are the Key Attributes that Drive the Malt Beverage Market?

Demand for malted beverages is fueled by population growth, urbanization, rising disposable income, and changes in consumption patterns. Other factors that contribute to the malt beverage market growth include a fast-paced lifestyle and a high standard of living and escalating the malt beverage market adoption trends.

The rising popularity of ready-to-eat products, the consistent enhancement of customised malt beverage, the rise of hybridized and crossover product alternatives, the increasing focus on health and well-being, and the demand for malt beverage along with healthy drinks are the driving factors fueling the malt beverage market growth.

Raising awareness about the benefits of malt-based products through various promotional programmes, as well as the introduction of new product variants, are some of the key drivers assisting malt beverage market development sooner rather than later.

What are the Scopes of the Malt Beverage Market?

Malt beverage market manufacturers in the shipment are focusing on the production of exquisite flavor with cutting-edge packaging of malt beverages in transit of quality mark and production.  Due to consumers welcome the introduction of new beverages, prominent malt beverage market players are attempting to capitalize on this malt beverage market opportunity.

Increased R&D activities by major players for the development of new innovative products and the addition of novel products to their portfolios by existing as well as new entrants are expected to create revenue malt beverage market opportunities as well as malt beverage market key trends and opportunities for players in the malt beverages market in the coming years.

The increasing merger and acquisition activity among major and minor local players is expected to support target malt beverage market growth.

Nandini Roy Choudhury

Principal Consultant

Talk to Analyst

Find your sweet spots for generating winning opportunities in this market.

What is the Regional Analysis of the Malt Beverage Market?

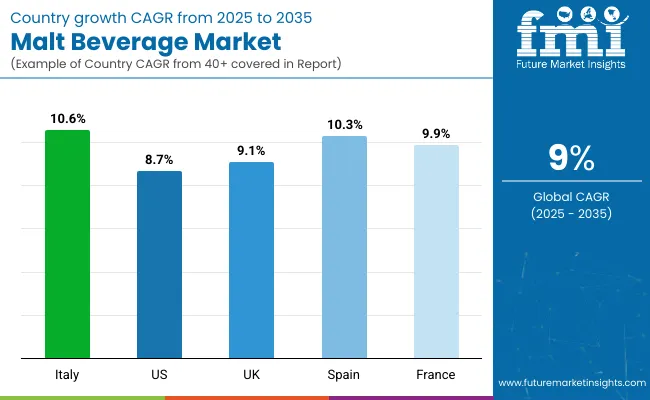
France meets a large portion of Europe's demand for malt beverage, due to the presence of a slew of consumers and manufacturers in the country. With increasing consumer density, the country's potential is expected to increase over the long run having a malt beverage market share of 35.2%.

Asia Pacific is the most important in the malt beverage market, followed by Europe. Taiwan is currently in second place in terms of demand for malt beverage, owing to the country's high consumption rates impacting malt beverage market adoption trends.

With an increasing number of consumers demanding organic beverages and manufacturers of baby food and beverages using organic cereals, it is safe to say that malt beverage market trends are on the rise and have been growing exponentially surging the malt beverage market future trends.

Organic drinks, including malt drink, are expected to grow in sales of malt beverage. Due to the ubiquity of these beverages, manufacturers of malt beverage the sales of malt beverage have been compelled to introduce novel beverages, particularly with a variety of flavours, in order to capitalise on the growing customer preference for intriguing flavours.

Furthermore, the medical benefits of malt have prompted malt beverage market producers in the shipment to introduce malt-based energy and health drinks hence boosting the malt beverage market size.

What are the Key Developments of Malt Beverage Market?

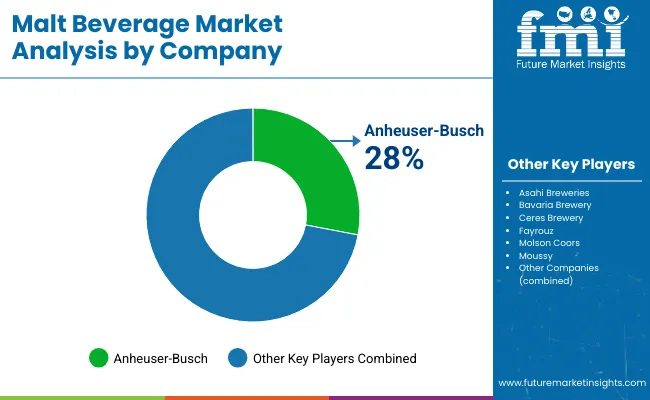
Anheuser-Busch Malt Beverages, Asahi Breweries Malt Beverages, Bavaria Brewery Malt Beverages, Ceres Brewery Malt Beverages, Fayrouz, Coors Brewing Company Malt Beverages, Moussy, Guinness Nigeria Malt Beverages, Nestle SA, and Suntory International Corporation are key global malt beverage market players manufacturing various types of quinoa products.

Get the data you need at a Fraction of the cost

Personalize your report by choosing insights you need
and save 40%!

Report Scope

Report Attribute Details
Growth Rate CAGR of 10.1% from 2022 to 2032
Base year for estimation 2021
Historical data 2015 to 2020
Forecast period 2022 to 2032
Quantitative units Revenue in USD Million and CAGR from 2022 to 2032
Report coverage Revenue forecast, volume forecast, company ranking, competitive landscape, growth factors, and trends, Pricing Analysis
Segments covered Nature, Sales, Product Type, End Use, and Region
Regional scope North America; Western Europe, Eastern Europe, Middle East, Africa, ASEAN, South Asia, Rest of Asia, Australia and New Zealand
Country scope USA; Canada; Mexico; Germany; UK; France; Italy; Spain; Russia; Belgium; Poland; Czech Republic; China; India; Japan; Australia; Brazil; Argentina; Colombia; Saudi Arabia; UAE; Iran; South Africa
Key companies profiled MusclePharm CorporationNutrabolt Corporation, BPI Sports LLC, Magnum Nutraceuticals, GAT Sport, Nutrex Research Inc., Beast Sports Nutrition, SynTech Nutrition (Medix Laboratories NV), EFX Sports, ALLMAX Nutrition Inc., etc.
Customization scope Free report customization (equivalent to up to 8 analysts working days) with purchase. Addition or alteration to country, regional & segment scope.
Pricing and purchase options Avail customized purchase options to meet your exact research needs.

Key Segments

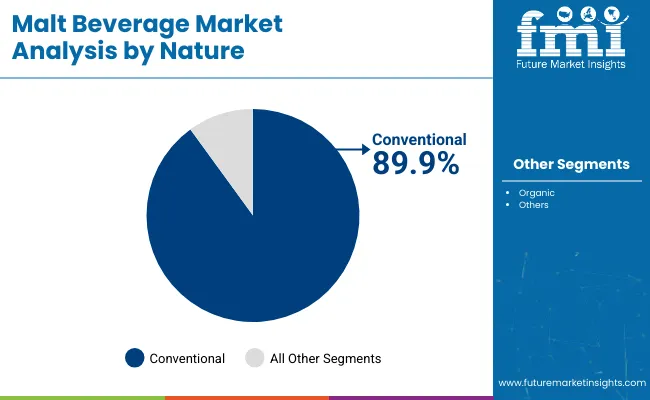
By Nature:

  • Organic
  • Conventional

By Sales Channel:

  • Direct
  • Indirect
  • Online

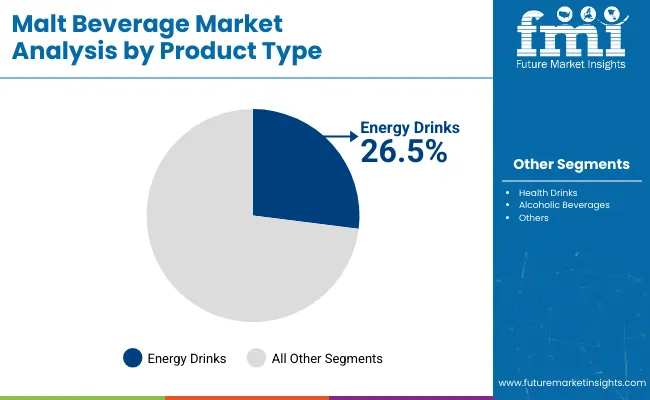
By Product Type:

  • Health Drink
  • Alcoholic Beverage
  • Energy Drink

By End-Use:

  • HoReCa
  • Beverage Industry
  • Food Industry

By Region:

  • North America
  • Latin America
  • Asia Pacific
  • MEA
  • Europe

Frequently Asked Questions

How is the Malt Beverage Market Growing?

The malt beverage market size is predicted to grow at 10.1% CAGR through 2032.

Which Region Holds the Highest Revenue Potential in the Malt Beverage Market?

Europe malt beverage market holds the highest revenue potential with malt beverage market share of 35.2%.

What is the Current Malt Beverage Market Size?

The malt beverage market size is anticipated to be over US$ 6.43 Billion in 2022.

What is the Future Scope of Growth for the Malt Beverage Market?

The malt beverage market is expected to surpass US$ 16.83 Billion by 2032.

What is the North America’s Malt Beverage Market Share?

North America’s malt beverage market holds the malt beverage market share of 28.6%.

Table of Content

1. Executive Summary

    1.1. Global Market Outlook

    1.2. Demand-side Trends

    1.3. Supply-side Trends

    1.4. Technology Roadmap Analysis

    1.5. Analysis and Recommendations

2. Market Overview

    2.1. Market Coverage / Taxonomy

    2.2. Market Definition / Scope / Limitations

3. Market Background

    3.1. Market Dynamics

        3.1.1. Drivers

        3.1.2. Restraints

        3.1.3. Opportunity

        3.1.4. Trends

    3.2. Scenario Forecast

        3.2.1. Demand in Optimistic Scenario

        3.2.2. Demand in Likely Scenario

        3.2.3. Demand in Conservative Scenario

    3.3. Opportunity Map Analysis

    3.4. Product Life Cycle Analysis

    3.5. Supply Chain Analysis

        3.5.1. Supply Side Participants and their Roles

            3.5.1.1. Producers

            3.5.1.2. Mid-Level Participants (Traders/ Agents/ Brokers)

            3.5.1.3. Wholesalers and Distributors

        3.5.2. Value Added and Value Created at Node in the Supply Chain

        3.5.3. List of Raw Material Suppliers

        3.5.4. List of Existing and Potential Buyer’s

    3.6. Investment Feasibility Matrix

    3.7. Value Chain Analysis

        3.7.1. Profit Margin Analysis

        3.7.2. Wholesalers and Distributors

        3.7.3. Retailers

    3.8. PESTLE and Porter’s Analysis

    3.9. Regulatory Landscape

        3.9.1. By Key Regions

        3.9.2. By Key Countries

    3.10. Regional Parent Market Outlook

    3.11. Production and Consumption Statistics

    3.12. Import and Export Statistics

4. Global Malt Beverages Market Analysis 2017-2021 and Forecast, 2022-2032

    4.1. Historical Market Size Value (US$ Mn) & Volume (Litres) Analysis, 2017-2021

    4.2. Current and Future Market Size Value (US$ Mn) & Volume (Litres) Projections, 2022-2032

        4.2.1. Y-o-Y Growth Trend Analysis

        4.2.2. Absolute $ Opportunity Analysis

5. Global Malt Beverages Market Analysis 2017-2021 and Forecast 2022-2032, By Product Type

    5.1. Introduction / Key Findings

    5.2. Historical Market Size Value (US$ Mn) & Volume (Litres) Analysis By Product Type, 2017-2021

    5.3. Current and Future Market Size Value (US$ Mn) & Volume (Litres) Analysis and Forecast By Product Type, 2022-2032

        5.3.1. Flavored

        5.3.2. Unflavored

    5.4. Y-o-Y Growth Trend Analysis By Product Type, 2017-2021

    5.5. Absolute $ Opportunity Analysis By Product Type, 2022-2032

6. Global Malt Beverages Market Analysis 2017-2021 and Forecast 2022-2032, By Application

    6.1. Introduction / Key Findings

    6.2. Historical Market Size Value (US$ Mn) & Volume (Litres) Analysis By Application, 2017-2021

    6.3. Current and Future Market Size Value (US$ Mn) & Volume (Litres) Analysis and Forecast By Application, 2022-2032

        6.3.1. Alcoholic Beverages

        6.3.2. Non-alcoholic Beverages. 

    6.4. Y-o-Y Growth Trend Analysis By Application, 2017-2021

    6.5. Absolute $ Opportunity Analysis By Application, 2022-2032

7. Global Malt Beverages Market Analysis 2017-2021 and Forecast 2022-2032, By Region

    7.1. Introduction

    7.2. Historical Market Size Value (US$ Mn) & Volume (Litres) Analysis By Region, 2017-2021

    7.3. Current Market Size Value (US$ Mn) & Volume (Litres) Analysis and Forecast By Region, 2022-2032

        7.3.1. North America

        7.3.2. Latin America

        7.3.3. Europe

        7.3.4. East Asia

        7.3.5. South Asia & Pacific

        7.3.6. MEA

    7.4. Market Attractiveness Analysis By Region

8. North America Malt Beverages Market Analysis 2017-2021 and Forecast 2022-2032, By Country

    8.1. Historical Market Size Value (US$ Mn) & Volume (Litres) Trend Analysis By Market Taxonomy, 2017-2021

    8.2. Market Size Value (US$ Mn) & Volume (Litres) Forecast By Market Taxonomy, 2022-2032

        8.2.1. By Country

            8.2.1.1. U.S.

            8.2.1.2. Canada

        8.2.2. By Product Type

        8.2.3. By Application

    8.3. Market Attractiveness Analysis

        8.3.1. By Country

        8.3.2. By Product Type

        8.3.3. By Application

    8.4. Key Takeaways

9. Latin America Malt Beverages Market Analysis 2017-2021 and Forecast 2022-2032, By Country

    9.1. Historical Market Size Value (US$ Mn) & Volume (Litres) Trend Analysis By Market Taxonomy, 2017-2021

    9.2. Market Size Value (US$ Mn) & Volume (Litres) Forecast By Market Taxonomy, 2022-2032

        9.2.1. By Country

            9.2.1.1. Mexico

            9.2.1.2. Brazil

            9.2.1.3. Rest of Latin America

        9.2.2. By Product Type

        9.2.3. By Application

    9.3. Market Attractiveness Analysis

        9.3.1. By Country

        9.3.2. By Product Type

        9.3.3. By Application

    9.4. Key Takeaways

10. Europe Malt Beverages Market Analysis 2017-2021 and Forecast 2022-2032, By Country

    10.1. Historical Market Size Value (US$ Mn) & Volume (Litres) Trend Analysis By Market Taxonomy, 2017-2021

    10.2. Market Size Value (US$ Mn) & Volume (Litres) Forecast By Market Taxonomy, 2022-2032

        10.2.1. By Country

            10.2.1.1. Germany

            10.2.1.2. Italy

            10.2.1.3. France

            10.2.1.4. U.K.

            10.2.1.5. Spain

            10.2.1.6. BENELUX

            10.2.1.7. Russia

            10.2.1.8. Rest of Europe

        10.2.2. By Product Type

        10.2.3. By Application

    10.3. Market Attractiveness Analysis

        10.3.1. By Country

        10.3.2. By Product Type

        10.3.3. By Application

    10.4. Key Takeaways

11. East Asia Malt Beverages Market Analysis 2017-2021 and Forecast 2022-2032, By Country

    11.1. Historical Market Size Value (US$ Mn) & Volume (Litres) Trend Analysis By Market Taxonomy, 2017-2021

    11.2. Market Size Value (US$ Mn) & Volume (Litres) Forecast By Market Taxonomy, 2022-2032

        11.2.1. By Country

            11.2.1.1. China

            11.2.1.2. Japan

            11.2.1.3. South Korea

        11.2.2. By Product Type

        11.2.3. By Application

    11.3. Market Attractiveness Analysis

        11.3.1. By Country

        11.3.2. By Product Type

        11.3.3. By Application

    11.4. Key Takeaways

12. South Asia & Pacific Malt Beverages Market Analysis 2017-2021 and Forecast 2022-2032, By Country

    12.1. Historical Market Size Value (US$ Mn) & Volume (Litres) Trend Analysis By Market Taxonomy, 2017-2021

    12.2. Market Size Value (US$ Mn) & Volume (Litres) Forecast By Market Taxonomy, 2022-2032

        12.2.1. By Country

            12.2.1.1. India

            12.2.1.2. ASEAN

            12.2.1.3. Australia and New Zealand

            12.2.1.4. Rest of South Asia & Pacific

        12.2.2. By Product Type

        12.2.3. By Application

    12.3. Market Attractiveness Analysis

        12.3.1. By Country

        12.3.2. By Product Type

        12.3.3. By Application

    12.4. Key Takeaways

13. MEA Malt Beverages Market Analysis 2017-2021 and Forecast 2022-2032, By Country

    13.1. Historical Market Size Value (US$ Mn) & Volume (Litres) Trend Analysis By Market Taxonomy, 2017-2021

    13.2. Market Size Value (US$ Mn) & Volume (Litres) Forecast By Market Taxonomy, 2022-2032

        13.2.1. By Country

            13.2.1.1. GCC Countries

            13.2.1.2. Turkey

            13.2.1.3. South Africa

            13.2.1.4. Rest of MEA

        13.2.2. By Product Type

        13.2.3. By Application

    13.3. Market Attractiveness Analysis

        13.3.1. By Country

        13.3.2. By Product Type

        13.3.3. By Application

    13.4. Key Takeaways

14. Key Countries Malt Beverages Market Analysis

    14.1. U.S.

        14.1.1. Pricing Analysis

        14.1.2. Market Share Analysis, 2021

            14.1.2.1. By Product Type

            14.1.2.2. By Application

    14.2. Canada

        14.2.1. Pricing Analysis

        14.2.2. Market Share Analysis, 2021

            14.2.2.1. By Product Type

            14.2.2.2. By Application

    14.3. Mexico

        14.3.1. Pricing Analysis

        14.3.2. Market Share Analysis, 2021

            14.3.2.1. By Product Type

            14.3.2.2. By Application

    14.4. Brazil

        14.4.1. Pricing Analysis

        14.4.2. Market Share Analysis, 2021

            14.4.2.1. By Product Type

            14.4.2.2. By Application

    14.5. Germany

        14.5.1. Pricing Analysis

        14.5.2. Market Share Analysis, 2021

            14.5.2.1. By Product Type

            14.5.2.2. By Application

    14.6. Italy

        14.6.1. Pricing Analysis

        14.6.2. Market Share Analysis, 2021

            14.6.2.1. By Product Type

            14.6.2.2. By Application

    14.7. France

        14.7.1. Pricing Analysis

        14.7.2. Market Share Analysis, 2021

            14.7.2.1. By Product Type

            14.7.2.2. By Application

    14.8. U.K.

        14.8.1. Pricing Analysis

        14.8.2. Market Share Analysis, 2021

            14.8.2.1. By Product Type

            14.8.2.2. By Application

    14.9. Spain

        14.9.1. Pricing Analysis

        14.9.2. Market Share Analysis, 2021

            14.9.2.1. By Product Type

            14.9.2.2. By Application

    14.10. BENELUX

        14.10.1. Pricing Analysis

        14.10.2. Market Share Analysis, 2021

            14.10.2.1. By Product Type

            14.10.2.2. By Application

    14.11. Russia

        14.11.1. Pricing Analysis

        14.11.2. Market Share Analysis, 2021

            14.11.2.1. By Product Type

            14.11.2.2. By Application

    14.12. China

        14.12.1. Pricing Analysis

        14.12.2. Market Share Analysis, 2021

            14.12.2.1. By Product Type

            14.12.2.2. By Application

    14.13. Japan

        14.13.1. Pricing Analysis

        14.13.2. Market Share Analysis, 2021

            14.13.2.1. By Product Type

            14.13.2.2. By Application

    14.14. South Korea

        14.14.1. Pricing Analysis

        14.14.2. Market Share Analysis, 2021

            14.14.2.1. By Product Type

            14.14.2.2. By Application

    14.15. India

        14.15.1. Pricing Analysis

        14.15.2. Market Share Analysis, 2021

            14.15.2.1. By Product Type

            14.15.2.2. By Application

    14.16. ASEAN

        14.16.1. Pricing Analysis

        14.16.2. Market Share Analysis, 2021

            14.16.2.1. By Product Type

            14.16.2.2. By Application

    14.17. Australia and New Zealand

        14.17.1. Pricing Analysis

        14.17.2. Market Share Analysis, 2021

            14.17.2.1. By Product Type

            14.17.2.2. By Application

    14.18. GCC Countries

        14.18.1. Pricing Analysis

        14.18.2. Market Share Analysis, 2021

            14.18.2.1. By Product Type

            14.18.2.2. By Application

    14.19. Turkey

        14.19.1. Pricing Analysis

        14.19.2. Market Share Analysis, 2021

            14.19.2.1. By Product Type

            14.19.2.2. By Application

    14.20. South Africa

        14.20.1. Pricing Analysis

        14.20.2. Market Share Analysis, 2021

            14.20.2.1. By Product Type

            14.20.2.2. By Application

15. Market Structure Analysis

    15.1. Competition Dashboard

    15.2. Competition Benchmarking

    15.3. Market Share Analysis of Top Players

        15.3.1. By Regional

        15.3.2. By Product Type

        15.3.3. By Application

16. Competition Analysis

    16.1. Competition Deep Dive

        16.1.1. Anheuser-Busch Malt Beverages

            16.1.1.1. Overview

            16.1.1.2. Product Portfolio

            16.1.1.3. Profitability by Market Segments

            16.1.1.4. Sales Footprint

            16.1.1.5. Strategy Overview

                16.1.1.5.1. Marketing Strategy

                16.1.1.5.2. Product Strategy

                16.1.1.5.3. Channel Strategy

        16.1.2. Asahi Breweries Malt Beverages

            16.1.2.1. Overview

            16.1.2.2. Product Portfolio

            16.1.2.3. Profitability by Market Segments

            16.1.2.4. Sales Footprint

            16.1.2.5. Strategy Overview

                16.1.2.5.1. Marketing Strategy

                16.1.2.5.2. Product Strategy

                16.1.2.5.3. Channel Strategy

        16.1.3. Bavaria Brewery Malt Beverages

            16.1.3.1. Overview

            16.1.3.2. Product Portfolio

            16.1.3.3. Profitability by Market Segments

            16.1.3.4. Sales Footprint

            16.1.3.5. Strategy Overview

                16.1.3.5.1. Marketing Strategy

                16.1.3.5.2. Product Strategy

                16.1.3.5.3. Channel Strategy

        16.1.4. Ceres Brewery Malt Beverages

            16.1.4.1. Overview

            16.1.4.2. Product Portfolio

            16.1.4.3. Profitability by Market Segments

            16.1.4.4. Sales Footprint

            16.1.4.5. Strategy Overview

                16.1.4.5.1. Marketing Strategy

                16.1.4.5.2. Product Strategy

                16.1.4.5.3. Channel Strategy

        16.1.5. Fayrouz

            16.1.5.1. Overview

            16.1.5.2. Product Portfolio

            16.1.5.3. Profitability by Market Segments

            16.1.5.4. Sales Footprint

            16.1.5.5. Strategy Overview

                16.1.5.5.1. Marketing Strategy

                16.1.5.5.2. Product Strategy

                16.1.5.5.3. Channel Strategy

        16.1.6. Molson Coors

            16.1.6.1. Overview

            16.1.6.2. Product Portfolio

            16.1.6.3. Profitability by Market Segments

            16.1.6.4. Sales Footprint

            16.1.6.5. Strategy Overview

                16.1.6.5.1. Marketing Strategy

                16.1.6.5.2. Product Strategy

                16.1.6.5.3. Channel Strategy

        16.1.7. Moussy

            16.1.7.1. Overview

            16.1.7.2. Product Portfolio

            16.1.7.3. Profitability by Market Segments

            16.1.7.4. Sales Footprint

            16.1.7.5. Strategy Overview

                16.1.7.5.1. Marketing Strategy

                16.1.7.5.2. Product Strategy

                16.1.7.5.3. Channel Strategy

        16.1.8. Guinness Nigeria Malt Beverages

            16.1.8.1. Overview

            16.1.8.2. Product Portfolio

            16.1.8.3. Profitability by Market Segments

            16.1.8.4. Sales Footprint

            16.1.8.5. Strategy Overview

                16.1.8.5.1. Marketing Strategy

                16.1.8.5.2. Product Strategy

                16.1.8.5.3. Channel Strategy

        16.1.9. Nestle SA

            16.1.9.1. Overview

            16.1.9.2. Product Portfolio

            16.1.9.3. Profitability by Market Segments

            16.1.9.4. Sales Footprint

            16.1.9.5. Strategy Overview

                16.1.9.5.1. Marketing Strategy

                16.1.9.5.2. Product Strategy

                16.1.9.5.3. Channel Strategy

        16.1.10. Suntory International Corporation

            16.1.10.1. Overview

            16.1.10.2. Product Portfolio

            16.1.10.3. Profitability by Market Segments

            16.1.10.4. Sales Footprint

            16.1.10.5. Strategy Overview

                16.1.10.5.1. Marketing Strategy

                16.1.10.5.2. Product Strategy

                16.1.10.5.3. Channel Strategy

17. Assumptions & Acronyms Used

18. Research Methodology

Don't pay for what you don't need

Customize your report by selecting specific countries or regions and save 30%!

List of Tables

Table 1: Global Malt Beverages Market Value (US$ Mn) Forecast by Region, 2017-2032

Table 2: Global Malt Beverages Market Volume (Litres) Forecast by Region, 2017-2032

Table 3: Global Malt Beverages Market Value (US$ Mn) Forecast by Product Type, 2017-2032

Table 4: Global Malt Beverages Market Volume (Litres) Forecast by Product Type, 2017-2032

Table 5: Global Malt Beverages Market Value (US$ Mn) Forecast by Application, 2017-2032

Table 6: Global Malt Beverages Market Volume (Litres) Forecast by Application, 2017-2032

Table 7: North America Malt Beverages Market Value (US$ Mn) Forecast by Country, 2017-2032

Table 8: North America Malt Beverages Market Volume (Litres) Forecast by Country, 2017-2032

Table 9: North America Malt Beverages Market Value (US$ Mn) Forecast by Product Type, 2017-2032

Table 10: North America Malt Beverages Market Volume (Litres) Forecast by Product Type, 2017-2032

Table 11: North America Malt Beverages Market Value (US$ Mn) Forecast by Application, 2017-2032

Table 12: North America Malt Beverages Market Volume (Litres) Forecast by Application, 2017-2032

Table 13: Latin America Malt Beverages Market Value (US$ Mn) Forecast by Country, 2017-2032

Table 14: Latin America Malt Beverages Market Volume (Litres) Forecast by Country, 2017-2032

Table 15: Latin America Malt Beverages Market Value (US$ Mn) Forecast by Product Type, 2017-2032

Table 16: Latin America Malt Beverages Market Volume (Litres) Forecast by Product Type, 2017-2032

Table 17: Latin America Malt Beverages Market Value (US$ Mn) Forecast by Application, 2017-2032

Table 18: Latin America Malt Beverages Market Volume (Litres) Forecast by Application, 2017-2032

Table 19: Europe Malt Beverages Market Value (US$ Mn) Forecast by Country, 2017-2032

Table 20: Europe Malt Beverages Market Volume (Litres) Forecast by Country, 2017-2032

Table 21: Europe Malt Beverages Market Value (US$ Mn) Forecast by Product Type, 2017-2032

Table 22: Europe Malt Beverages Market Volume (Litres) Forecast by Product Type, 2017-2032

Table 23: Europe Malt Beverages Market Value (US$ Mn) Forecast by Application, 2017-2032

Table 24: Europe Malt Beverages Market Volume (Litres) Forecast by Application, 2017-2032

Table 25: East Asia Malt Beverages Market Value (US$ Mn) Forecast by Country, 2017-2032

Table 26: East Asia Malt Beverages Market Volume (Litres) Forecast by Country, 2017-2032

Table 27: East Asia Malt Beverages Market Value (US$ Mn) Forecast by Product Type, 2017-2032

Table 28: East Asia Malt Beverages Market Volume (Litres) Forecast by Product Type, 2017-2032

Table 29: East Asia Malt Beverages Market Value (US$ Mn) Forecast by Application, 2017-2032

Table 30: East Asia Malt Beverages Market Volume (Litres) Forecast by Application, 2017-2032

Table 31: South Asia & Pacific Malt Beverages Market Value (US$ Mn) Forecast by Country, 2017-2032

Table 32: South Asia & Pacific Malt Beverages Market Volume (Litres) Forecast by Country, 2017-2032

Table 33: South Asia & Pacific Malt Beverages Market Value (US$ Mn) Forecast by Product Type, 2017-2032

Table 34: South Asia & Pacific Malt Beverages Market Volume (Litres) Forecast by Product Type, 2017-2032

Table 35: South Asia & Pacific Malt Beverages Market Value (US$ Mn) Forecast by Application, 2017-2032

Table 36: South Asia & Pacific Malt Beverages Market Volume (Litres) Forecast by Application, 2017-2032

Table 37: MEA Malt Beverages Market Value (US$ Mn) Forecast by Country, 2017-2032

Table 38: MEA Malt Beverages Market Volume (Litres) Forecast by Country, 2017-2032

Table 39: MEA Malt Beverages Market Value (US$ Mn) Forecast by Product Type, 2017-2032

Table 40: MEA Malt Beverages Market Volume (Litres) Forecast by Product Type, 2017-2032

Table 41: MEA Malt Beverages Market Value (US$ Mn) Forecast by Application, 2017-2032

Table 42: MEA Malt Beverages Market Volume (Litres) Forecast by Application, 2017-2032
Nandini Roy Choudhury

Principal Consultant

Talk to Analyst

Find your sweet spots for generating winning opportunities in this market.

List of Charts

Figure 1: Global Malt Beverages Market Value (US$ Mn) by Product Type, 2022-2032

Figure 2: Global Malt Beverages Market Value (US$ Mn) by Application, 2022-2032

Figure 3: Global Malt Beverages Market Value (US$ Mn) by Region, 2022-2032

Figure 4: Global Malt Beverages Market Value (US$ Mn) Analysis by Region, 2017-2032

Figure 5: Global Malt Beverages Market Volume (Litres) Analysis by Region, 2017-2032

Figure 6: Global Malt Beverages Market Value Share (%) and BPS Analysis by Region, 2022-2032

Figure 7: Global Malt Beverages Market Y-o-Y Growth (%) Projections by Region, 2022-2032

Figure 8: Global Malt Beverages Market Value (US$ Mn) Analysis by Product Type, 2017-2032

Figure 9: Global Malt Beverages Market Volume (Litres) Analysis by Product Type, 2017-2032

Figure 10: Global Malt Beverages Market Value Share (%) and BPS Analysis by Product Type, 2022-2032

Figure 11: Global Malt Beverages Market Y-o-Y Growth (%) Projections by Product Type, 2022-2032

Figure 12: Global Malt Beverages Market Value (US$ Mn) Analysis by Application, 2017-2032

Figure 13: Global Malt Beverages Market Volume (Litres) Analysis by Application, 2017-2032

Figure 14: Global Malt Beverages Market Value Share (%) and BPS Analysis by Application, 2022-2032

Figure 15: Global Malt Beverages Market Y-o-Y Growth (%) Projections by Application, 2022-2032

Figure 16: Global Malt Beverages Market Attractiveness by Product Type, 2022-2032

Figure 17: Global Malt Beverages Market Attractiveness by Application, 2022-2032

Figure 18: Global Malt Beverages Market Attractiveness by Region, 2022-2032

Figure 19: North America Malt Beverages Market Value (US$ Mn) by Product Type, 2022-2032

Figure 20: North America Malt Beverages Market Value (US$ Mn) by Application, 2022-2032

Figure 21: North America Malt Beverages Market Value (US$ Mn) by Country, 2022-2032

Figure 22: North America Malt Beverages Market Value (US$ Mn) Analysis by Country, 2017-2032

Figure 23: North America Malt Beverages Market Volume (Litres) Analysis by Country, 2017-2032

Figure 24: North America Malt Beverages Market Value Share (%) and BPS Analysis by Country, 2022-2032

Figure 25: North America Malt Beverages Market Y-o-Y Growth (%) Projections by Country, 2022-2032

Figure 26: North America Malt Beverages Market Value (US$ Mn) Analysis by Product Type, 2017-2032

Figure 27: North America Malt Beverages Market Volume (Litres) Analysis by Product Type, 2017-2032

Figure 28: North America Malt Beverages Market Value Share (%) and BPS Analysis by Product Type, 2022-2032

Figure 29: North America Malt Beverages Market Y-o-Y Growth (%) Projections by Product Type, 2022-2032

Figure 30: North America Malt Beverages Market Value (US$ Mn) Analysis by Application, 2017-2032

Figure 31: North America Malt Beverages Market Volume (Litres) Analysis by Application, 2017-2032

Figure 32: North America Malt Beverages Market Value Share (%) and BPS Analysis by Application, 2022-2032

Figure 33: North America Malt Beverages Market Y-o-Y Growth (%) Projections by Application, 2022-2032

Figure 34: North America Malt Beverages Market Attractiveness by Product Type, 2022-2032

Figure 35: North America Malt Beverages Market Attractiveness by Application, 2022-2032

Figure 36: North America Malt Beverages Market Attractiveness by Country, 2022-2032

Figure 37: Latin America Malt Beverages Market Value (US$ Mn) by Product Type, 2022-2032

Figure 38: Latin America Malt Beverages Market Value (US$ Mn) by Application, 2022-2032

Figure 39: Latin America Malt Beverages Market Value (US$ Mn) by Country, 2022-2032

Figure 40: Latin America Malt Beverages Market Value (US$ Mn) Analysis by Country, 2017-2032

Figure 41: Latin America Malt Beverages Market Volume (Litres) Analysis by Country, 2017-2032

Figure 42: Latin America Malt Beverages Market Value Share (%) and BPS Analysis by Country, 2022-2032

Figure 43: Latin America Malt Beverages Market Y-o-Y Growth (%) Projections by Country, 2022-2032

Figure 44: Latin America Malt Beverages Market Value (US$ Mn) Analysis by Product Type, 2017-2032

Figure 45: Latin America Malt Beverages Market Volume (Litres) Analysis by Product Type, 2017-2032

Figure 46: Latin America Malt Beverages Market Value Share (%) and BPS Analysis by Product Type, 2022-2032

Figure 47: Latin America Malt Beverages Market Y-o-Y Growth (%) Projections by Product Type, 2022-2032

Figure 48: Latin America Malt Beverages Market Value (US$ Mn) Analysis by Application, 2017-2032

Figure 49: Latin America Malt Beverages Market Volume (Litres) Analysis by Application, 2017-2032

Figure 50: Latin America Malt Beverages Market Value Share (%) and BPS Analysis by Application, 2022-2032

Figure 51: Latin America Malt Beverages Market Y-o-Y Growth (%) Projections by Application, 2022-2032

Figure 52: Latin America Malt Beverages Market Attractiveness by Product Type, 2022-2032

Figure 53: Latin America Malt Beverages Market Attractiveness by Application, 2022-2032

Figure 54: Latin America Malt Beverages Market Attractiveness by Country, 2022-2032

Figure 55: Europe Malt Beverages Market Value (US$ Mn) by Product Type, 2022-2032

Figure 56: Europe Malt Beverages Market Value (US$ Mn) by Application, 2022-2032

Figure 57: Europe Malt Beverages Market Value (US$ Mn) by Country, 2022-2032

Figure 58: Europe Malt Beverages Market Value (US$ Mn) Analysis by Country, 2017-2032

Figure 59: Europe Malt Beverages Market Volume (Litres) Analysis by Country, 2017-2032

Figure 60: Europe Malt Beverages Market Value Share (%) and BPS Analysis by Country, 2022-2032

Figure 61: Europe Malt Beverages Market Y-o-Y Growth (%) Projections by Country, 2022-2032

Figure 62: Europe Malt Beverages Market Value (US$ Mn) Analysis by Product Type, 2017-2032

Figure 63: Europe Malt Beverages Market Volume (Litres) Analysis by Product Type, 2017-2032

Figure 64: Europe Malt Beverages Market Value Share (%) and BPS Analysis by Product Type, 2022-2032

Figure 65: Europe Malt Beverages Market Y-o-Y Growth (%) Projections by Product Type, 2022-2032

Figure 66: Europe Malt Beverages Market Value (US$ Mn) Analysis by Application, 2017-2032

Figure 67: Europe Malt Beverages Market Volume (Litres) Analysis by Application, 2017-2032

Figure 68: Europe Malt Beverages Market Value Share (%) and BPS Analysis by Application, 2022-2032

Figure 69: Europe Malt Beverages Market Y-o-Y Growth (%) Projections by Application, 2022-2032

Figure 70: Europe Malt Beverages Market Attractiveness by Product Type, 2022-2032

Figure 71: Europe Malt Beverages Market Attractiveness by Application, 2022-2032

Figure 72: Europe Malt Beverages Market Attractiveness by Country, 2022-2032

Figure 73: East Asia Malt Beverages Market Value (US$ Mn) by Product Type, 2022-2032

Figure 74: East Asia Malt Beverages Market Value (US$ Mn) by Application, 2022-2032

Figure 75: East Asia Malt Beverages Market Value (US$ Mn) by Country, 2022-2032

Figure 76: East Asia Malt Beverages Market Value (US$ Mn) Analysis by Country, 2017-2032

Figure 77: East Asia Malt Beverages Market Volume (Litres) Analysis by Country, 2017-2032

Figure 78: East Asia Malt Beverages Market Value Share (%) and BPS Analysis by Country, 2022-2032

Figure 79: East Asia Malt Beverages Market Y-o-Y Growth (%) Projections by Country, 2022-2032

Figure 80: East Asia Malt Beverages Market Value (US$ Mn) Analysis by Product Type, 2017-2032

Figure 81: East Asia Malt Beverages Market Volume (Litres) Analysis by Product Type, 2017-2032

Figure 82: East Asia Malt Beverages Market Value Share (%) and BPS Analysis by Product Type, 2022-2032

Figure 83: East Asia Malt Beverages Market Y-o-Y Growth (%) Projections by Product Type, 2022-2032

Figure 84: East Asia Malt Beverages Market Value (US$ Mn) Analysis by Application, 2017-2032

Figure 85: East Asia Malt Beverages Market Volume (Litres) Analysis by Application, 2017-2032

Figure 86: East Asia Malt Beverages Market Value Share (%) and BPS Analysis by Application, 2022-2032

Figure 87: East Asia Malt Beverages Market Y-o-Y Growth (%) Projections by Application, 2022-2032

Figure 88: East Asia Malt Beverages Market Attractiveness by Product Type, 2022-2032

Figure 89: East Asia Malt Beverages Market Attractiveness by Application, 2022-2032

Figure 90: East Asia Malt Beverages Market Attractiveness by Country, 2022-2032

Figure 91: South Asia & Pacific Malt Beverages Market Value (US$ Mn) by Product Type, 2022-2032

Figure 92: South Asia & Pacific Malt Beverages Market Value (US$ Mn) by Application, 2022-2032

Figure 93: South Asia & Pacific Malt Beverages Market Value (US$ Mn) by Country, 2022-2032

Figure 94: South Asia & Pacific Malt Beverages Market Value (US$ Mn) Analysis by Country, 2017-2032

Figure 95: South Asia & Pacific Malt Beverages Market Volume (Litres) Analysis by Country, 2017-2032

Figure 96: South Asia & Pacific Malt Beverages Market Value Share (%) and BPS Analysis by Country, 2022-2032

Figure 97: South Asia & Pacific Malt Beverages Market Y-o-Y Growth (%) Projections by Country, 2022-2032

Figure 98: South Asia & Pacific Malt Beverages Market Value (US$ Mn) Analysis by Product Type, 2017-2032

Figure 99: South Asia & Pacific Malt Beverages Market Volume (Litres) Analysis by Product Type, 2017-2032

Figure 100: South Asia & Pacific Malt Beverages Market Value Share (%) and BPS Analysis by Product Type, 2022-2032

Figure 101: South Asia & Pacific Malt Beverages Market Y-o-Y Growth (%) Projections by Product Type, 2022-2032

Figure 102: South Asia & Pacific Malt Beverages Market Value (US$ Mn) Analysis by Application, 2017-2032

Figure 103: South Asia & Pacific Malt Beverages Market Volume (Litres) Analysis by Application, 2017-2032

Figure 104: South Asia & Pacific Malt Beverages Market Value Share (%) and BPS Analysis by Application, 2022-2032

Figure 105: South Asia & Pacific Malt Beverages Market Y-o-Y Growth (%) Projections by Application, 2022-2032

Figure 106: South Asia & Pacific Malt Beverages Market Attractiveness by Product Type, 2022-2032

Figure 107: South Asia & Pacific Malt Beverages Market Attractiveness by Application, 2022-2032

Figure 108: South Asia & Pacific Malt Beverages Market Attractiveness by Country, 2022-2032

Figure 109: MEA Malt Beverages Market Value (US$ Mn) by Product Type, 2022-2032

Figure 110: MEA Malt Beverages Market Value (US$ Mn) by Application, 2022-2032

Figure 111: MEA Malt Beverages Market Value (US$ Mn) by Country, 2022-2032

Figure 112: MEA Malt Beverages Market Value (US$ Mn) Analysis by Country, 2017-2032

Figure 113: MEA Malt Beverages Market Volume (Litres) Analysis by Country, 2017-2032

Figure 114: MEA Malt Beverages Market Value Share (%) and BPS Analysis by Country, 2022-2032

Figure 115: MEA Malt Beverages Market Y-o-Y Growth (%) Projections by Country, 2022-2032

Figure 116: MEA Malt Beverages Market Value (US$ Mn) Analysis by Product Type, 2017-2032

Figure 117: MEA Malt Beverages Market Volume (Litres) Analysis by Product Type, 2017-2032

Figure 118: MEA Malt Beverages Market Value Share (%) and BPS Analysis by Product Type, 2022-2032

Figure 119: MEA Malt Beverages Market Y-o-Y Growth (%) Projections by Product Type, 2022-2032

Figure 120: MEA Malt Beverages Market Value (US$ Mn) Analysis by Application, 2017-2032

Figure 121: MEA Malt Beverages Market Volume (Litres) Analysis by Application, 2017-2032

Figure 122: MEA Malt Beverages Market Value Share (%) and BPS Analysis by Application, 2022-2032

Figure 123: MEA Malt Beverages Market Y-o-Y Growth (%) Projections by Application, 2022-2032

Figure 124: MEA Malt Beverages Market Attractiveness by Product Type, 2022-2032

Figure 125: MEA Malt Beverages Market Attractiveness by Application, 2022-2032

Figure 126: MEA Malt Beverages Market Attractiveness by Country, 2022-2032

Recommendations

Food and Beverage

Maltodextrin Market

Published : March 2024

Food and Beverage

Malted barley flour Market

Published : May 2023

Food and Beverage

Malt Ingredients Market

Published : January 2023

Food and Beverage

Malt Market

Published : October 2022

Explore Food and Beverage Insights

View Reports