Maltodextrin Market Outlook 2025 to 2035

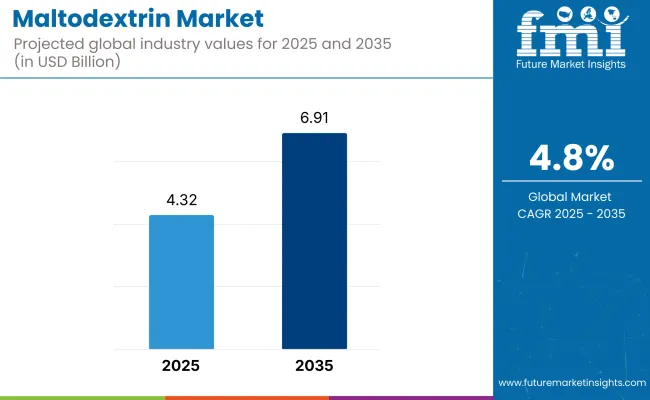
The demand for Maltodextrin market is expected to be valued at USD 4.32 Billion in 2025, forecasted at a CAGR of 4.8% to have an estimated value of USD 6.91 Billion from 2025 to 2035. From 2020 to 2025 a CAGR of 4.6% was registered for the market.
Despite being a carbohydrate maltodextrin goes through a number of processes. Starch from potatoes corn wheat or rice is used to make this white powder. In order to further break it down its creators first cook it and then add acids or enzymes.

The end result is a white powder with a neutral flavor that dissolves in water. To replace sugar and enhance texture shelf life and flavor the powder is added to the products mentioned above. The white powder that is produced is tasteless and soluble in water. Apart from the amount of sugar they contain maltodextrins and corn syrup solids are chemically similar.

Attributes Description
Estimated Global Industry Size (2025E) USD 4.32 Billion
Projected Global Industry Value (2035F) USD 6.91 Billion
Value-based CAGR (2025 to 2035) 4.8%

The market is still expanding steadily on a global scale mostly due to its extensive use in a variety of sectors including food and beverage pharmaceuticals and cosmetics. As demand for clean-label and health-focused products grows, functional food ingredients continue to shape product innovation across global markets.

As maltodextrin can be used as a thickening agent stabilizer and filler in processed foods and beverages the food and beverage industry continue to be the biggest consumer. Convenience and functional food consumption are on the rise which is driving up demand in the market.
Category-wise Insights

Corn Based Dominates Maltodextrin Market

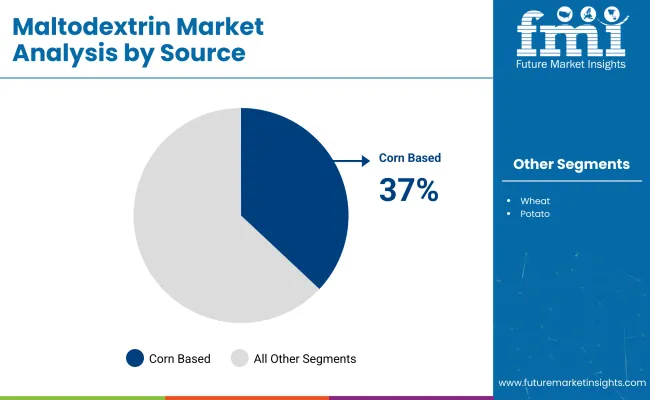
Segment Value Share (2025)
Corn Based (Source) 37%

By 2025 maltodextrin derived from corn is anticipated to hold a 37% market share. These are some of the elements affecting the development of maltodextrin derived from corn. For the most part maltodextrin producers prefer to use corn as their source because of its abundance and ease of extraction.

Maltodextrin derived from corn thus wins the source segment. Because the maltodextrin made from corn retains its flavor and texture there is a constant need for corn-based maltodextrin.
Food and Beverages Rules the Maltodextrin Market

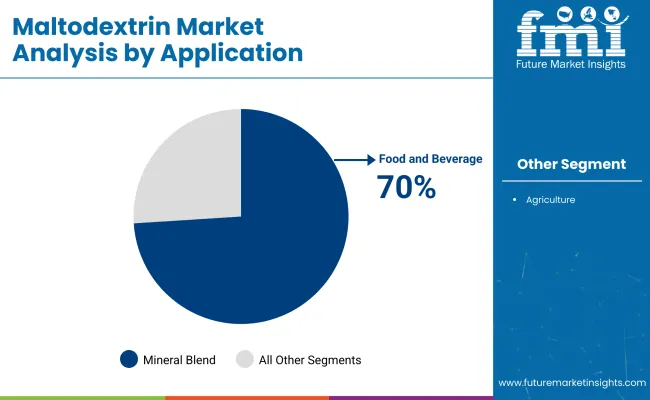
Segment Value Share (2025)
Food and Beverages (Application) 70%

In 2025 the largest segment share was accounted for by food and beverages. The industry that uses maltodextrin the most in a variety of products is food and beverage. Among maltodextrins qualities are their capacity to replace fat thicken stabilize bulk and prevent caking. are incorporated into the recipes of food and drink products.

Making powder from liquid or oil-based products is one of the industrys most common applications for maltodextrin. To make instant pudding mixes for example maltodextrin is utilized. It is also frequently utilized as a fat substitute in low-calorie food products without changing the final products flavor or mouthfeel.

Key Industry Highlights

Awareness in It’s Funtion is Driving the Market Growth

The components of maltodextrin are glucose oligosaccharides polysaccharides and maltose. In order to produce maltodextrin which is 15-25% dextrose equivalent starch must be hydrolyzed refined and then spray-dried. One of the artificial sugars with a subtle sweetness is maltodextrin.

Maltodextrin is a widely used food additive that can be found in a variety of packaged foods including but not limited to seasonings cereal potato chips desserts soups and sauces canned fruits snacks spice mixes baked goods instant pudding salad dressings nutrition bars sauces yogurt sugar-free sweeteners cake mixes and meal replacement shakes.

2020 to 2024 Global Maltodextrin Sales Analysis Compared to Demand Forecasts for 2025 to 2035

During the period 2020 to 2024, the sales grew at a CAGR of 4.6%, and it is predicted to continue to grow at a CAGR of 4.8% during the forecast period of 2025 to 2035.

The need for maltodextrin is increasing due to the growing popularity of maltodextrin syrups. Maltodextrin and food products containing it are becoming more and more popular due to the growing interest in natural and organic ingredients. The use of sports supplements is rising as more people participate in sports as part of fitness trends. Due to the widespread use of maltodextrin in these sports supplements the products demand is rising.

The demand for maltodextrin is being driven by its use in fast soups and snacks like chips. Because maltodextrin is used in so many different products including drinks dietary supplements pastes and more there is a greater demand for it. Peoples growing inclination towards gluten-free diets is driving up demand for maltodextrin. The market for maltodextrin is seeing growth as ice cream production expands and the treat becomes more popular even in far-flung areas.

The maltodextrin market is being driven by consumer demand for clean-label products. More parents are choosing to use infant formula for their children as a result of growing awareness about it. Increased parental acceptance of maltodextrin which is used in infant formula is helping the market.

The markets growth is anticipated to be constrained by substitutes for sugar alternative thickening agents and other factors. For instance, agave and corn syrup are thought to be good substitutes for maltodextrin.

Market Concentration

Tier 1 companies comprises industry leaders acquiring a 30% share in the global business market. These leaders are distinguished by their extensive product portfolio and high production capacity. These industry leaders stand out due to their broad geographic reach, in-depth knowledge of manufacturing and reconditioning across various formats and strong customer base. They offer a variety of services and manufacturing with the newest technology while adhering to legal requirements for the best quality.

Tier 2 companies comprises of mid-size players having a presence in some regions and highly influencing the local commerce and has a market share of 50%. These are distinguished by their robust global presence and solid business acumen. These industry participants may not have cutting-edge technology or a broad global reach but they do have good technology and guarantee regulatory compliance.

Tier 3 companies comprises mostly of small-scale businesses serving niche economies and serving at the local presence having a market share of 20%. Due to their notable focus on meeting local needs these businesses are categorized as belonging to the tier 3 share segment, they are minor players with a constrained geographic scope. As an unorganized ecosystem Tier 3 in this context refers to a sector that in contrast to its organized competitors, lacks extensive structure and formalization.

Country wise Insights

The following table shows the forecasted growth rates of the significant three geographies revenues. USA, Germany and India come under the exhibit of high consumption, recording CAGRs of 3.9%, 3.2% and 6.1%, respectively, through 2035.

Country CAGR 2025 to 2035
United States 3.9%
Germany 3.2%
India 6.1%

USA Dominates the North America Maltodextrin Market

In the USA the markets compound annual growth rate (CAGR) is projected to be 3.9% during the forecast period. The demand for maltodextrin is rising in the USA due to the growing popularity of gluten-free diets and Americans growing health consciousness.

The United States growing obesity problem is causing people there to prefer healthier foods. The demand for maltodextrin is rising in the nation as a result of its use in supplements health shakes and other food items.

India Contributes to the Maltodextrin Market Growth

It is anticipated that the Indian market will grow at a CAGR of 6.1% until 2035. Because of its flavor and ease of production corn-based maltodextrin is becoming more and more popular in India where the market is expanding along the corn avenue. Indias growing gym-going population is contributing to the countrys increased use of dietary supplements which is good for the maltodextrin market.

Germany Emerges in Maltodextrin Market

In Germany the market is anticipated to grow at a CAGR of 3.2%. In Germany people are becoming more health conscious and avoiding sugar. Thus, maltodextrin is becoming more and more popular in Germany as a sugar substitute. Germanys sports culture is encouraging more people to use sports supplements which is driving up demand for maltodextrin in the nation.

Competition Outlook

The goal of market participants is to increase the use of maltodextrin in food and other applications. As a result, working together with other food and beverage industry stakeholders is typical. Using maltodextrin to enhance foods flavor and texture is the main goal of Grain Processing Corporation one of the well-known businesses in the industry.

Through acquisitions the business is also increasing its market share. To gain a competitive advantage other business in the market are attempting to lower production costs.

Leading Manufacturers

  • Grain Processing Corp
  • Cargill Inc.
  • Roquette
  • Matsutani
  • Ingredion
  • ADM
  • Tate and Lyle
  • Avebe
  • Agrana Group
  • Nowamyl
  • ZhuchengDongxiao Biotechnology
  • Tereos
  • Lehmann Food Ingredients

Key Segmentation

By Source:

By source, methods industry has been categorized into Corn, Wheat and Potato

By Application:

By application, industry has been categorized into Agriculture, Food and beverages

By Region:

Industry analysis has been carried out in key countries of North America; Europe, Middle East, Africa, ASEAN, South Asia, Asia, New Zealand and Australia

Table of Content

  1. Executive Summary
  2. Industry Introduction, including Taxonomy and Market Definition
  3. Trends and Success Factors, including Macro-economic Factors, Market Dynamics, and Recent Industry Developments
  4. Global Demand Analysis 2020 to 2024 and Forecast 2025 to 2035, including Historical Analysis and Future Projections
  5. Pricing Analysis
  6. Global Analysis 2020 to 2024 and Forecast 2025 to 2035
    • Source
    • Application
  7. By Source
    • Corn
    • Wheat
    • Potato
  8. By Application
    • Agriculture
    • Food and beverages
  9. By Region
    • North America
    • Latin America
    • Western Europe
    • Eastern Europe
    • Balkans & Baltic
    • Russia & Belarus
    • Central Asia
    • East Asia
    • South Asia & Pacific
    • Middle East & Africa
  10. North America Sales Analysis 2020 to 2024 and Forecast 2025 to 2035, by Key Segments and Countries
  11. Latin America Sales Analysis 2020 to 2024 and Forecast 2025 to 2035, by Key Segments and Countries
  12. Western Europe Sales Analysis 2020 to 2024 and Forecast 2025 to 2035, by Key Segments and Countries
  13. Eastern Europe Sales Analysis 2020 to 2024 and Forecast 2025 to 2035, by Key Segments and Countries
  14. Balkans & Baltic Sales Analysis 2020 to 2024 and Forecast 2025 to 2035, by Key Segments and Countries
  15. Russia & Belarus Sales Analysis 2020 to 2024 and Forecast 2025 to 2035, by Key Segments and Countries
  16. Central Asia Sales Analysis 2020 to 2024 and Forecast 2025 to 2035, by Key Segments and Countries
  17. East Asia Sales Analysis 2020 to 2024 and Forecast 2025 to 2035, by Key Segments and Countries
  18. 18 South Asia & Pacific Sales Analysis 2020 to 2024 and Forecast 2025 to 2035, by Key Segments and Countries
  19. 19 Middle East & Africa Sales Analysis 2020 to 2024 and Forecast 2025 to 2035, by Key Segments and Countries
  20. Sales Forecast to 2035 by Source and Application for 30 Countries
  21. Competitive Assessment, Company Share Analysis by Key Players, and Competition Dashboard
  22. Company Profile
    • Grain Processing Corp
    • Cargill Inc.
    • Roquette
    • Matsutani
    • Ingredion
    • ADM
    • Tate and Lyle
    • Avebe
    • Agrana Group
    • Nowamyl

List of Tables

Table 1: Global Market Value (US$ Million) Forecast by Region, 2019 to 2034

Table 2: Global Market Volume (Tons) Forecast by Region, 2019 to 2034

Table 3: Global Market Value (US$ Million) Forecast by Source, 2019 to 2034

Table 4: Global Market Volume (Tons) Forecast by Source, 2019 to 2034

Table 5: Global Market Value (US$ Million) Forecast by Form, 2019 to 2034

Table 6: Global Market Volume (Tons) Forecast by Form, 2019 to 2034

Table 7: Global Market Value (US$ Million) Forecast by Application, 2019 to 2034

Table 8: Global Market Volume (Tons) Forecast by Application, 2019 to 2034

Table 9: North America Market Value (US$ Million) Forecast by Country, 2019 to 2034

Table 10: North America Market Volume (Tons) Forecast by Country, 2019 to 2034

Table 11: North America Market Value (US$ Million) Forecast by Source, 2019 to 2034

Table 12: North America Market Volume (Tons) Forecast by Source, 2019 to 2034

Table 13: North America Market Value (US$ Million) Forecast by Form, 2019 to 2034

Table 14: North America Market Volume (Tons) Forecast by Form, 2019 to 2034

Table 15: North America Market Value (US$ Million) Forecast by Application, 2019 to 2034

Table 16: North America Market Volume (Tons) Forecast by Application, 2019 to 2034

Table 17: Latin America Market Value (US$ Million) Forecast by Country, 2019 to 2034

Table 18: Latin America Market Volume (Tons) Forecast by Country, 2019 to 2034

Table 19: Latin America Market Value (US$ Million) Forecast by Source, 2019 to 2034

Table 20: Latin America Market Volume (Tons) Forecast by Source, 2019 to 2034

Table 21: Latin America Market Value (US$ Million) Forecast by Form, 2019 to 2034

Table 22: Latin America Market Volume (Tons) Forecast by Form, 2019 to 2034

Table 23: Latin America Market Value (US$ Million) Forecast by Application, 2019 to 2034

Table 24: Latin America Market Volume (Tons) Forecast by Application, 2019 to 2034

Table 25: Western Europe Market Value (US$ Million) Forecast by Country, 2019 to 2034

Table 26: Western Europe Market Volume (Tons) Forecast by Country, 2019 to 2034

Table 27: Western Europe Market Value (US$ Million) Forecast by Source, 2019 to 2034

Table 28: Western Europe Market Volume (Tons) Forecast by Source, 2019 to 2034

Table 29: Western Europe Market Value (US$ Million) Forecast by Form, 2019 to 2034

Table 30: Western Europe Market Volume (Tons) Forecast by Form, 2019 to 2034

Table 31: Western Europe Market Value (US$ Million) Forecast by Application, 2019 to 2034

Table 32: Western Europe Market Volume (Tons) Forecast by Application, 2019 to 2034

Table 33: Eastern Europe Market Value (US$ Million) Forecast by Country, 2019 to 2034

Table 34: Eastern Europe Market Volume (Tons) Forecast by Country, 2019 to 2034

Table 35: Eastern Europe Market Value (US$ Million) Forecast by Source, 2019 to 2034

Table 36: Eastern Europe Market Volume (Tons) Forecast by Source, 2019 to 2034

Table 37: Eastern Europe Market Value (US$ Million) Forecast by Form, 2019 to 2034

Table 38: Eastern Europe Market Volume (Tons) Forecast by Form, 2019 to 2034

Table 39: Eastern Europe Market Value (US$ Million) Forecast by Application, 2019 to 2034

Table 40: Eastern Europe Market Volume (Tons) Forecast by Application, 2019 to 2034

Table 41: South Asia and Pacific Market Value (US$ Million) Forecast by Country, 2019 to 2034

Table 42: South Asia and Pacific Market Volume (Tons) Forecast by Country, 2019 to 2034

Table 43: South Asia and Pacific Market Value (US$ Million) Forecast by Source, 2019 to 2034

Table 44: South Asia and Pacific Market Volume (Tons) Forecast by Source, 2019 to 2034

Table 45: South Asia and Pacific Market Value (US$ Million) Forecast by Form, 2019 to 2034

Table 46: South Asia and Pacific Market Volume (Tons) Forecast by Form, 2019 to 2034

Table 47: South Asia and Pacific Market Value (US$ Million) Forecast by Application, 2019 to 2034

Table 48: South Asia and Pacific Market Volume (Tons) Forecast by Application, 2019 to 2034

Table 49: East Asia Market Value (US$ Million) Forecast by Country, 2019 to 2034

Table 50: East Asia Market Volume (Tons) Forecast by Country, 2019 to 2034

Table 51: East Asia Market Value (US$ Million) Forecast by Source, 2019 to 2034

Table 52: East Asia Market Volume (Tons) Forecast by Source, 2019 to 2034

Table 53: East Asia Market Value (US$ Million) Forecast by Form, 2019 to 2034

Table 54: East Asia Market Volume (Tons) Forecast by Form, 2019 to 2034

Table 55: East Asia Market Value (US$ Million) Forecast by Application, 2019 to 2034

Table 56: East Asia Market Volume (Tons) Forecast by Application, 2019 to 2034

Table 57: Middle East and Africa Market Value (US$ Million) Forecast by Country, 2019 to 2034

Table 58: Middle East and Africa Market Volume (Tons) Forecast by Country, 2019 to 2034

Table 59: Middle East and Africa Market Value (US$ Million) Forecast by Source, 2019 to 2034

Table 60: Middle East and Africa Market Volume (Tons) Forecast by Source, 2019 to 2034

Table 61: Middle East and Africa Market Value (US$ Million) Forecast by Form, 2019 to 2034

Table 62: Middle East and Africa Market Volume (Tons) Forecast by Form, 2019 to 2034

Table 63: Middle East and Africa Market Value (US$ Million) Forecast by Application, 2019 to 2034

Table 64: Middle East and Africa Market Volume (Tons) Forecast by Application, 2019 to 2034

List of Figures

Figure 1: Global Market Value (US$ Million) by Source, 2024 to 2034

Figure 2: Global Market Value (US$ Million) by Form, 2024 to 2034

Figure 3: Global Market Value (US$ Million) by Application, 2024 to 2034

Figure 4: Global Market Value (US$ Million) by Region, 2024 to 2034

Figure 5: Global Market Value (US$ Million) Analysis by Region, 2019 to 2034

Figure 6: Global Market Volume (Tons) Analysis by Region, 2019 to 2034

Figure 7: Global Market Value Share (%) and BPS Analysis by Region, 2024 to 2034

Figure 8: Global Market Y-o-Y Growth (%) Projections by Region, 2024 to 2034

Figure 9: Global Market Value (US$ Million) Analysis by Source, 2019 to 2034

Figure 10: Global Market Volume (Tons) Analysis by Source, 2019 to 2034

Figure 11: Global Market Value Share (%) and BPS Analysis by Source, 2024 to 2034

Figure 12: Global Market Y-o-Y Growth (%) Projections by Source, 2024 to 2034

Figure 13: Global Market Value (US$ Million) Analysis by Form, 2019 to 2034

Figure 14: Global Market Volume (Tons) Analysis by Form, 2019 to 2034

Figure 15: Global Market Value Share (%) and BPS Analysis by Form, 2024 to 2034

Figure 16: Global Market Y-o-Y Growth (%) Projections by Form, 2024 to 2034

Figure 17: Global Market Value (US$ Million) Analysis by Application, 2019 to 2034

Figure 18: Global Market Volume (Tons) Analysis by Application, 2019 to 2034

Figure 19: Global Market Value Share (%) and BPS Analysis by Application, 2024 to 2034

Figure 20: Global Market Y-o-Y Growth (%) Projections by Application, 2024 to 2034

Figure 21: Global Market Attractiveness by Source, 2024 to 2034

Figure 22: Global Market Attractiveness by Form, 2024 to 2034

Figure 23: Global Market Attractiveness by Application, 2024 to 2034

Figure 24: Global Market Attractiveness by Region, 2024 to 2034

Figure 25: North America Market Value (US$ Million) by Source, 2024 to 2034

Figure 26: North America Market Value (US$ Million) by Form, 2024 to 2034

Figure 27: North America Market Value (US$ Million) by Application, 2024 to 2034

Figure 28: North America Market Value (US$ Million) by Country, 2024 to 2034

Figure 29: North America Market Value (US$ Million) Analysis by Country, 2019 to 2034

Figure 30: North America Market Volume (Tons) Analysis by Country, 2019 to 2034

Figure 31: North America Market Value Share (%) and BPS Analysis by Country, 2024 to 2034

Figure 32: North America Market Y-o-Y Growth (%) Projections by Country, 2024 to 2034

Figure 33: North America Market Value (US$ Million) Analysis by Source, 2019 to 2034

Figure 34: North America Market Volume (Tons) Analysis by Source, 2019 to 2034

Figure 35: North America Market Value Share (%) and BPS Analysis by Source, 2024 to 2034

Figure 36: North America Market Y-o-Y Growth (%) Projections by Source, 2024 to 2034

Figure 37: North America Market Value (US$ Million) Analysis by Form, 2019 to 2034

Figure 38: North America Market Volume (Tons) Analysis by Form, 2019 to 2034

Figure 39: North America Market Value Share (%) and BPS Analysis by Form, 2024 to 2034

Figure 40: North America Market Y-o-Y Growth (%) Projections by Form, 2024 to 2034

Figure 41: North America Market Value (US$ Million) Analysis by Application, 2019 to 2034

Figure 42: North America Market Volume (Tons) Analysis by Application, 2019 to 2034

Figure 43: North America Market Value Share (%) and BPS Analysis by Application, 2024 to 2034

Figure 44: North America Market Y-o-Y Growth (%) Projections by Application, 2024 to 2034

Figure 45: North America Market Attractiveness by Source, 2024 to 2034

Figure 46: North America Market Attractiveness by Form, 2024 to 2034

Figure 47: North America Market Attractiveness by Application, 2024 to 2034

Figure 48: North America Market Attractiveness by Country, 2024 to 2034

Figure 49: Latin America Market Value (US$ Million) by Source, 2024 to 2034

Figure 50: Latin America Market Value (US$ Million) by Form, 2024 to 2034

Figure 51: Latin America Market Value (US$ Million) by Application, 2024 to 2034

Figure 52: Latin America Market Value (US$ Million) by Country, 2024 to 2034

Figure 53: Latin America Market Value (US$ Million) Analysis by Country, 2019 to 2034

Figure 54: Latin America Market Volume (Tons) Analysis by Country, 2019 to 2034

Figure 55: Latin America Market Value Share (%) and BPS Analysis by Country, 2024 to 2034

Figure 56: Latin America Market Y-o-Y Growth (%) Projections by Country, 2024 to 2034

Figure 57: Latin America Market Value (US$ Million) Analysis by Source, 2019 to 2034

Figure 58: Latin America Market Volume (Tons) Analysis by Source, 2019 to 2034

Figure 59: Latin America Market Value Share (%) and BPS Analysis by Source, 2024 to 2034

Figure 60: Latin America Market Y-o-Y Growth (%) Projections by Source, 2024 to 2034

Figure 61: Latin America Market Value (US$ Million) Analysis by Form, 2019 to 2034

Figure 62: Latin America Market Volume (Tons) Analysis by Form, 2019 to 2034

Figure 63: Latin America Market Value Share (%) and BPS Analysis by Form, 2024 to 2034

Figure 64: Latin America Market Y-o-Y Growth (%) Projections by Form, 2024 to 2034

Figure 65: Latin America Market Value (US$ Million) Analysis by Application, 2019 to 2034

Figure 66: Latin America Market Volume (Tons) Analysis by Application, 2019 to 2034

Figure 67: Latin America Market Value Share (%) and BPS Analysis by Application, 2024 to 2034

Figure 68: Latin America Market Y-o-Y Growth (%) Projections by Application, 2024 to 2034

Figure 69: Latin America Market Attractiveness by Source, 2024 to 2034

Figure 70: Latin America Market Attractiveness by Form, 2024 to 2034

Figure 71: Latin America Market Attractiveness by Application, 2024 to 2034

Figure 72: Latin America Market Attractiveness by Country, 2024 to 2034

Figure 73: Western Europe Market Value (US$ Million) by Source, 2024 to 2034

Figure 74: Western Europe Market Value (US$ Million) by Form, 2024 to 2034

Figure 75: Western Europe Market Value (US$ Million) by Application, 2024 to 2034

Figure 76: Western Europe Market Value (US$ Million) by Country, 2024 to 2034

Figure 77: Western Europe Market Value (US$ Million) Analysis by Country, 2019 to 2034

Figure 78: Western Europe Market Volume (Tons) Analysis by Country, 2019 to 2034

Figure 79: Western Europe Market Value Share (%) and BPS Analysis by Country, 2024 to 2034

Figure 80: Western Europe Market Y-o-Y Growth (%) Projections by Country, 2024 to 2034

Figure 81: Western Europe Market Value (US$ Million) Analysis by Source, 2019 to 2034

Figure 82: Western Europe Market Volume (Tons) Analysis by Source, 2019 to 2034

Figure 83: Western Europe Market Value Share (%) and BPS Analysis by Source, 2024 to 2034

Figure 84: Western Europe Market Y-o-Y Growth (%) Projections by Source, 2024 to 2034

Figure 85: Western Europe Market Value (US$ Million) Analysis by Form, 2019 to 2034

Figure 86: Western Europe Market Volume (Tons) Analysis by Form, 2019 to 2034

Figure 87: Western Europe Market Value Share (%) and BPS Analysis by Form, 2024 to 2034

Figure 88: Western Europe Market Y-o-Y Growth (%) Projections by Form, 2024 to 2034

Figure 89: Western Europe Market Value (US$ Million) Analysis by Application, 2019 to 2034

Figure 90: Western Europe Market Volume (Tons) Analysis by Application, 2019 to 2034

Figure 91: Western Europe Market Value Share (%) and BPS Analysis by Application, 2024 to 2034

Figure 92: Western Europe Market Y-o-Y Growth (%) Projections by Application, 2024 to 2034

Figure 93: Western Europe Market Attractiveness by Source, 2024 to 2034

Figure 94: Western Europe Market Attractiveness by Form, 2024 to 2034

Figure 95: Western Europe Market Attractiveness by Application, 2024 to 2034

Figure 96: Western Europe Market Attractiveness by Country, 2024 to 2034

Figure 97: Eastern Europe Market Value (US$ Million) by Source, 2024 to 2034

Figure 98: Eastern Europe Market Value (US$ Million) by Form, 2024 to 2034

Figure 99: Eastern Europe Market Value (US$ Million) by Application, 2024 to 2034

Figure 100: Eastern Europe Market Value (US$ Million) by Country, 2024 to 2034

Figure 101: Eastern Europe Market Value (US$ Million) Analysis by Country, 2019 to 2034

Figure 102: Eastern Europe Market Volume (Tons) Analysis by Country, 2019 to 2034

Figure 103: Eastern Europe Market Value Share (%) and BPS Analysis by Country, 2024 to 2034

Figure 104: Eastern Europe Market Y-o-Y Growth (%) Projections by Country, 2024 to 2034

Figure 105: Eastern Europe Market Value (US$ Million) Analysis by Source, 2019 to 2034

Figure 106: Eastern Europe Market Volume (Tons) Analysis by Source, 2019 to 2034

Figure 107: Eastern Europe Market Value Share (%) and BPS Analysis by Source, 2024 to 2034

Figure 108: Eastern Europe Market Y-o-Y Growth (%) Projections by Source, 2024 to 2034

Figure 109: Eastern Europe Market Value (US$ Million) Analysis by Form, 2019 to 2034

Figure 110: Eastern Europe Market Volume (Tons) Analysis by Form, 2019 to 2034

Figure 111: Eastern Europe Market Value Share (%) and BPS Analysis by Form, 2024 to 2034

Figure 112: Eastern Europe Market Y-o-Y Growth (%) Projections by Form, 2024 to 2034

Figure 113: Eastern Europe Market Value (US$ Million) Analysis by Application, 2019 to 2034

Figure 114: Eastern Europe Market Volume (Tons) Analysis by Application, 2019 to 2034

Figure 115: Eastern Europe Market Value Share (%) and BPS Analysis by Application, 2024 to 2034

Figure 116: Eastern Europe Market Y-o-Y Growth (%) Projections by Application, 2024 to 2034

Figure 117: Eastern Europe Market Attractiveness by Source, 2024 to 2034

Figure 118: Eastern Europe Market Attractiveness by Form, 2024 to 2034

Figure 119: Eastern Europe Market Attractiveness by Application, 2024 to 2034

Figure 120: Eastern Europe Market Attractiveness by Country, 2024 to 2034

Figure 121: South Asia and Pacific Market Value (US$ Million) by Source, 2024 to 2034

Figure 122: South Asia and Pacific Market Value (US$ Million) by Form, 2024 to 2034

Figure 123: South Asia and Pacific Market Value (US$ Million) by Application, 2024 to 2034

Figure 124: South Asia and Pacific Market Value (US$ Million) by Country, 2024 to 2034

Figure 125: South Asia and Pacific Market Value (US$ Million) Analysis by Country, 2019 to 2034

Figure 126: South Asia and Pacific Market Volume (Tons) Analysis by Country, 2019 to 2034

Figure 127: South Asia and Pacific Market Value Share (%) and BPS Analysis by Country, 2024 to 2034

Figure 128: South Asia and Pacific Market Y-o-Y Growth (%) Projections by Country, 2024 to 2034

Figure 129: South Asia and Pacific Market Value (US$ Million) Analysis by Source, 2019 to 2034

Figure 130: South Asia and Pacific Market Volume (Tons) Analysis by Source, 2019 to 2034

Figure 131: South Asia and Pacific Market Value Share (%) and BPS Analysis by Source, 2024 to 2034

Figure 132: South Asia and Pacific Market Y-o-Y Growth (%) Projections by Source, 2024 to 2034

Figure 133: South Asia and Pacific Market Value (US$ Million) Analysis by Form, 2019 to 2034

Figure 134: South Asia and Pacific Market Volume (Tons) Analysis by Form, 2019 to 2034

Figure 135: South Asia and Pacific Market Value Share (%) and BPS Analysis by Form, 2024 to 2034

Figure 136: South Asia and Pacific Market Y-o-Y Growth (%) Projections by Form, 2024 to 2034

Figure 137: South Asia and Pacific Market Value (US$ Million) Analysis by Application, 2019 to 2034

Figure 138: South Asia and Pacific Market Volume (Tons) Analysis by Application, 2019 to 2034

Figure 139: South Asia and Pacific Market Value Share (%) and BPS Analysis by Application, 2024 to 2034

Figure 140: South Asia and Pacific Market Y-o-Y Growth (%) Projections by Application, 2024 to 2034

Figure 141: South Asia and Pacific Market Attractiveness by Source, 2024 to 2034

Figure 142: South Asia and Pacific Market Attractiveness by Form, 2024 to 2034

Figure 143: South Asia and Pacific Market Attractiveness by Application, 2024 to 2034

Figure 144: South Asia and Pacific Market Attractiveness by Country, 2024 to 2034

Figure 145: East Asia Market Value (US$ Million) by Source, 2024 to 2034

Figure 146: East Asia Market Value (US$ Million) by Form, 2024 to 2034

Figure 147: East Asia Market Value (US$ Million) by Application, 2024 to 2034

Figure 148: East Asia Market Value (US$ Million) by Country, 2024 to 2034

Figure 149: East Asia Market Value (US$ Million) Analysis by Country, 2019 to 2034

Figure 150: East Asia Market Volume (Tons) Analysis by Country, 2019 to 2034

Figure 151: East Asia Market Value Share (%) and BPS Analysis by Country, 2024 to 2034

Figure 152: East Asia Market Y-o-Y Growth (%) Projections by Country, 2024 to 2034

Figure 153: East Asia Market Value (US$ Million) Analysis by Source, 2019 to 2034

Figure 154: East Asia Market Volume (Tons) Analysis by Source, 2019 to 2034

Figure 155: East Asia Market Value Share (%) and BPS Analysis by Source, 2024 to 2034

Figure 156: East Asia Market Y-o-Y Growth (%) Projections by Source, 2024 to 2034

Figure 157: East Asia Market Value (US$ Million) Analysis by Form, 2019 to 2034

Figure 158: East Asia Market Volume (Tons) Analysis by Form, 2019 to 2034

Figure 159: East Asia Market Value Share (%) and BPS Analysis by Form, 2024 to 2034

Figure 160: East Asia Market Y-o-Y Growth (%) Projections by Form, 2024 to 2034

Figure 161: East Asia Market Value (US$ Million) Analysis by Application, 2019 to 2034

Figure 162: East Asia Market Volume (Tons) Analysis by Application, 2019 to 2034

Figure 163: East Asia Market Value Share (%) and BPS Analysis by Application, 2024 to 2034

Figure 164: East Asia Market Y-o-Y Growth (%) Projections by Application, 2024 to 2034

Figure 165: East Asia Market Attractiveness by Source, 2024 to 2034

Figure 166: East Asia Market Attractiveness by Form, 2024 to 2034

Figure 167: East Asia Market Attractiveness by Application, 2024 to 2034

Figure 168: East Asia Market Attractiveness by Country, 2024 to 2034

Figure 169: Middle East and Africa Market Value (US$ Million) by Source, 2024 to 2034

Figure 170: Middle East and Africa Market Value (US$ Million) by Form, 2024 to 2034

Figure 171: Middle East and Africa Market Value (US$ Million) by Application, 2024 to 2034

Figure 172: Middle East and Africa Market Value (US$ Million) by Country, 2024 to 2034

Figure 173: Middle East and Africa Market Value (US$ Million) Analysis by Country, 2019 to 2034

Figure 174: Middle East and Africa Market Volume (Tons) Analysis by Country, 2019 to 2034

Figure 175: Middle East and Africa Market Value Share (%) and BPS Analysis by Country, 2024 to 2034

Figure 176: Middle East and Africa Market Y-o-Y Growth (%) Projections by Country, 2024 to 2034

Figure 177: Middle East and Africa Market Value (US$ Million) Analysis by Source, 2019 to 2034

Figure 178: Middle East and Africa Market Volume (Tons) Analysis by Source, 2019 to 2034

Figure 179: Middle East and Africa Market Value Share (%) and BPS Analysis by Source, 2024 to 2034

Figure 180: Middle East and Africa Market Y-o-Y Growth (%) Projections by Source, 2024 to 2034

Figure 181: Middle East and Africa Market Value (US$ Million) Analysis by Form, 2019 to 2034

Figure 182: Middle East and Africa Market Volume (Tons) Analysis by Form, 2019 to 2034

Figure 183: Middle East and Africa Market Value Share (%) and BPS Analysis by Form, 2024 to 2034

Figure 184: Middle East and Africa Market Y-o-Y Growth (%) Projections by Form, 2024 to 2034

Figure 185: Middle East and Africa Market Value (US$ Million) Analysis by Application, 2019 to 2034

Figure 186: Middle East and Africa Market Volume (Tons) Analysis by Application, 2019 to 2034

Figure 187: Middle East and Africa Market Value Share (%) and BPS Analysis by Application, 2024 to 2034

Figure 188: Middle East and Africa Market Y-o-Y Growth (%) Projections by Application, 2024 to 2034

Figure 189: Middle East and Africa Market Attractiveness by Source, 2024 to 2034

Figure 190: Middle East and Africa Market Attractiveness by Form, 2024 to 2034

Figure 191: Middle East and Africa Market Attractiveness by Application, 2024 to 2034

Figure 192: Middle East and Africa Market Attractiveness by Country, 2024 to 2034

Frequently Asked Questions

At what rate will the industry grow?

The market is expected to grow at a CAGR of 4.8% throughout the forecast period.

What is the expected value of the industry by 2035?

By 2035, the sales value is expected to be worth USD 6.91 Billion.

What are the key factors driving the market?

Awareness in its function is increasing demand for Maltodextrin Market.

Which region accounts for the highest consumption?

North America is expected to dominate the global consumption.

Who are the key players in manufacturing?

Some of the key players in manufacturing include Roquette, Matsutani, Ingredion and more.

Explore Similar Insights

Future Market Insights

Maltodextrin Market