Tapioca Maltodextrin Market Size and Share Forecast Outlook 2025 to 2035

The global tapioca maltodextrin market is projected to grow from USD 670.6 million in 2025 to USD 1,397.9 million by 2035, registering a CAGR of 7.6%. Market expansion is driven by rising demand for clean-label and non-GMO food ingredients, especially in functional foods, beverages, and sports nutrition. Manufacturers are leveraging tapioca maltodextrin’s superior solubility, neutral taste, and stabilizing properties to enhance product texture and shelf life.

Quick Stats for Tapioca Maltodextrin Market

  • Market Value (2025): USD 670.6 million
  • Forecast Value (2035): USD 1,397.9 million
  • Forecast CAGR: 7.6%
  • Top End-use Industry Segment: Food & Beverage (50% market share in 2025)
  • Top DE Value Segment: Medium DE (41.2% share in 2025)
  • Key Growth Region: East Asia (Japan is the fastest-growing market with 8.1% CAGR)
Attribute Values
Estimated Industry Size (2025E) USD 670.6 million
Projected Industry Value (2035F) USD 1,397.9 million
CAGR (2025 to 2035) 7.6%

The market holds an approximately 5.0% share of the modified starch market, supported by its clean-label appeal, neutral taste, and superior bulking properties. Within specialty carbohydrates, it accounts for approximately 8.94% share, driven by its role in fat replacement, encapsulation, and energy-boosting applications in food and beverage formulations.

The market also contributes approximately 0.96% to the global food additives industry, aligning with the demand for natural, non-GMO, and allergen-free ingredients across processed foods, beverages, and nutritional supplements.

Government regulations impacting the market focus on food safety, labelling standards, and clean-label compliance. Regulations by bodies such as the US FDA, European Food Safety Authority (EFSA), and Food Safety and Standards Authority of India (FSSAI) ensure that tapioca maltodextrin meets stringent purity, safety, and non-GMO standards. These frameworks support the adoption of tapioca-based variants over conventional corn-based alternatives, ensuring transparent ingredient labelling and fostering consumer trust in natural and sustainable food ingredients.

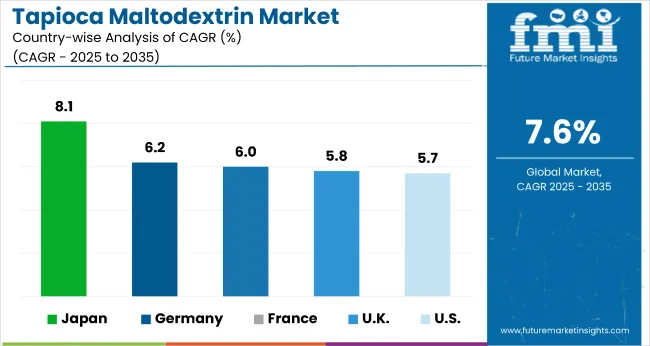
Japan is projected to be the fastest-growing market, expanding at a CAGR of 8.1% from 2025 to 2035. The medium DE segment will lead the dextrose equivalent category with a 41.2% share, while the pharmaceutical segment will hold 26.7% share by end-use. The UK and France markets are also expected to grow steadily, with CAGRs of 5.8% and 6%, respectively.

Tapioca Maltodextrin Market Analysis by Top Investment Segments

The tapioca maltodextrin market is segmented by dextrose equivalent (DE) value, processing technique, functionality, end-use industry, and region. By DE value, the market is divided into low DE (1-5), medium DE (6-10), and high DE (11-20). Based on processing technique, the market is classified into native processing, modified processing, and pregelatinized processing.

By functionality, the market is segmented into stabilizing agents, thickening agents, binding agents, and nutritional enhancers. Based on end-use industry, it is divided into food & beverage, pharmaceutical, nutritional supplements, and personal care & cosmetics. Regionally, the market is classified into North America, Latin America, Western Europe, Eastern Europe, Balkans & Baltic, Russia & Belarus, Central Asia, East Asia, South Asia & Pacific, and Middle East & Africa.
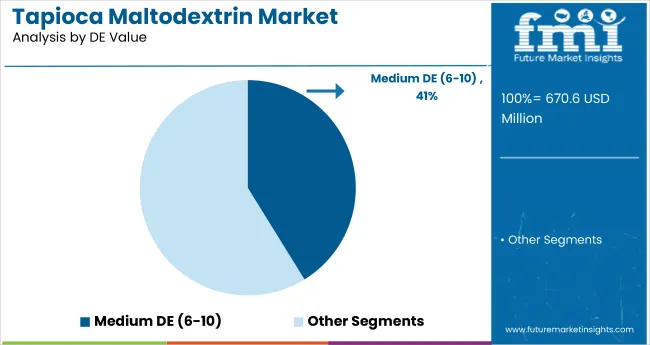
Medium DE (6-10) to Lead the DE Value Segment with 41.2% Market Share

Tapioca Maltodextrin Market By De Value

Medium DE is projected to lead the DE value segment, accounting for 41.2% of the global market share by 2025. This segment is widely used in food and beverage applications for its balance of sweetness and solubility.
  • The moderate sweetness and turbidity make it suitable for sports drinks, energy bars, and confections.
  • Increased demand for flavour and colour carriers will drive growth in this segment

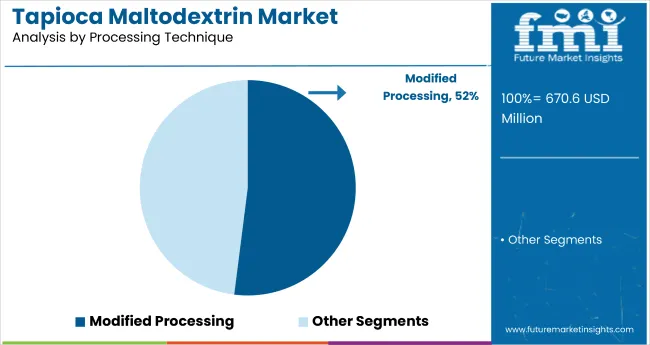
Modified Processing to Dominate 52% of the Processing Technique Segment in 2025

Tapioca Maltodextrin Market By Processing Technique

Modified processing is expected to dominate the processing technique segment, accounting for 52% of the market share in 2025. This segment benefits from enhanced stability, improved solubility, and wider usability across multiple end-use sectors.
  • Modified variants offer enhanced functional properties such as improved stability and solubility.
  • Their versatility makes them preferred in processed foods, pharmaceuticals, and dietary supplements.

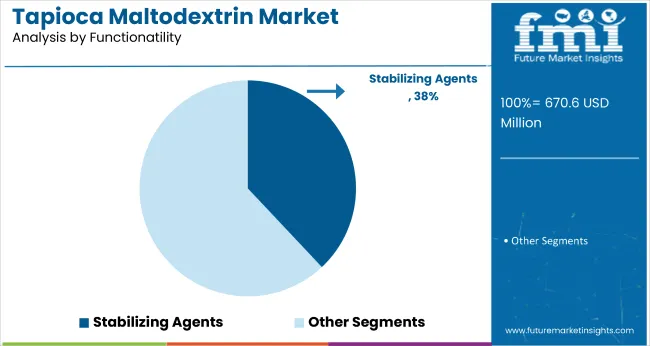
Stabilizing Agents to Lead the Functionality Segment with 38% Market Share

Tapioca Maltodextrin Market By Functionality

Stabilizing agents are expected to lead the functionality segment, accounting for 38% of the global market share by 2025. Its neutral taste and texturizing benefits drive widespread adoption.

  • Widely used to enhance texture and consistency in beverages, sauces, and dairy products.
  • Demand is driven by manufacturers focusing on product stability and extended shelf life.

Food & Beverage to Lead the End-use Industry Segment with 50% Market Share

Food & beverage is expected to dominate the end-use industry segment, accounting for 50% of the global market share by 2025. Its use improves mouthfeel, stability, and shelf life in products.

  • High utilization in instant mixes, beverages, and processed foods due to its neutral taste and bulking properties.
  • Rising demand for clean-label ingredients drives adoption in this sector.

Top Tapioca Maltodextrin Market Dynamics

The global tapioca maltodextrin market is experiencing steady growth, driven by increasing demand for clean-label, natural, and non-GMO ingredients across food, beverage, pharmaceutical, and cosmetic industries. Tapioca maltodextrin plays a crucial role as a stabilizer, thickener, and bulking agent, enhancing product texture, shelf life, and formulation consistency without altering taste.

Recent Trends in the Tapioca Maltodextrin Market

  • The shift towards organic and sustainably sourced tapioca maltodextrin is gaining traction, with manufacturers introducing certified organic variants to cater to health-conscious consumers.
  • Technologies like enzymatic hydrolysis and spray drying enhance efficiency, purity, and consistency.

Challenges in the Tapioca Maltodextrin Market
  • Fluctuating raw material prices of cassava and supply chain disruptions impact production costs, affecting market stability and profitability for manufacturers.
  • Strict regulatory standards for food safety, clean labelling, and purity compliance across countries pose challenges for manufacturers.

Top Countries Manufacturing, Processing, Regulating, and Generating Demand for Tapioca Maltodextrin

Country Wise Analysis Of Tapioca Maltodextrin Market

Japan leads the tapioca maltodextrin market due to strong demand in functional foods, beverages, and sports nutrition.

Germany and France, follow closely, supported by strict EU clean-label regulations and consumer preference for non-GMO and organic ingredients. While, the UK market is projected to grow at 5.8% CAGR and the USA market at 5.7% CAGR.

The report covers in-depth analysis of 40+ countries, with the five top-performing OECD nations highlighted below.

In-depth Analysis of Tapioca Maltodextrin Demand in Japan

The Japan Tapioca Maltodextrin revenue is growing at a CAGR of 8.1% from 2025 to 2035. Growth is driven by increasing demand for clean-label stabilizers and thickeners in beverages, sauces, and confectionery products.

  • High demand in functional foods, confectionery, and beverages
  • Preference for enzymatically processed, clean-label variants

Growth Outlook for Tapioca Maltodextrin in Germany

The sales of Tapioca Maltodextrin in Germany are expanding at 6.2% CAGR during the forecast period. Growth is driven by EU clean-label initiatives and rising demand for non-GMO and allergen-free ingredients.

  • Strong EU compliance pressures in processed food and bakery
  • High demand for organic and non-GMO certified variants

Demand Trajectory for Industrial Food Ingredients in France

The demand for tapioca maltodextrin market in France is projected to grow at a 6% CAGR during the forecast period. Demand is driven by national food safety standards and consumer inclination towards clean-label, gluten-free, and non-GMO products.

  • Balanced sweetness driving usage in beverages and confectionery
  • High adoption in gluten-free and clean-label formulations

Analysis of Tapioca Maltodextrin in the USA

The USA tapioca maltodextrin market is projected to grow at 5.7% CAGR from 2025 to 2035. The growth is driven by sports nutrition, protein powders, and meal replacement products due to its rapid digestibility and energy-supplying properties.

  • Strong demand in sports nutrition and dietary supplements
  • Preference for non-GMO and gluten-free tapioca-based variants

Tapioca Maltodextrin Trends in the UK

The UK tapioca maltodextrin revenue is projected to grow at a CAGR of 5.8% from 2025 to 2035. Growth is driven by the demand for clean-label and plant-based ingredients.

  • Focus on beverages, bakery, and nutritional supplements
  • Moderate growth supported by clean-label and natural ingredient trends

Leading Tapioca Maltodextrin Suppliers and Manufacturers

The tapioca maltodextrin market is moderately consolidated, with leading players like Ingredion Incorporated, Cargill, Incorporated, Tate & Lyle PLC, ADM (Archer Daniels Midland Company), and Roquette Frères dominating the industry. These companies provide high-quality tapioca maltodextrin catering to applications in food and beverages, pharmaceuticals, and personal care sectors. Ingredion Incorporated focuses on clean-label, non-GMO, and organic variants, while Cargill specializes in high-purity maltodextrin with global distribution.

Tate & Lyle PLC delivers innovative texturizing solutions for low-fat and sugar-reduced products. ADM offers starch derivatives aligned with health and wellness trends, and Roquette Frères is known for its advanced processing technologies ensuring consistent quality. Other key players like Shafi Gluco Chem (Pvt) Limited, Tereos, Global Sweeteners Holdings Limited, AGRANA Beteiligungs-AG, and Grain Processing Corporation contribute by providing specialized, sustainably sourced, and high-performance tapioca maltodextrin for diverse industrial applications.

Recent Tapioca Maltodextrin Industry News

  • In February 2025, Ingredion Incorporated reported robust fourth-quarter earnings for 2024. The company achieved an adjusted earnings per share (EPS) of USD 2.63 for Q4, surpassing analyst expectations, and a full-year adjusted EPS of USD 10.65.
  • In October 2024, Shafi Gluco Chem (Pvt) Limited participated in Supply Side West 2024, showcasing its range of rice and tapioca-based sweeteners and proteins to industry leaders in the dietary supplement and functional food sectors.

Tapioca Maltodextrin Market Report Scope

Report Attributes Details
Market Size (2025) USD 670.6 million
Projected Market Size (2035) USD 1,397.9 million
CAGR (2025 to 2035) 7.6%
Base Year for Estimation 2024
Historical Period 2020 to 2024
Projections Period 2025 to 2035
Report Parameter USD million for value/Metric Tons
By Dextrose Equivalent (DE) Value Low DE (1-5), Medium DE (6-10), and High DE (11-20)
By Processing Technique Native Processing, Modified Processing, and Pregelatinized Processing
By Functionality Stabilizing Agents, Thickening Agents, Binding Agents, and Nutritional Enhancers
By End-use Industry Food & Beverage, Pharmaceutical, Nutritional Supplements, and Personal Care & Cosmetics
Regions Covered North America, Latin America, Western Europe, Eastern Europe, Balkans & Baltic, Russia & Belarus, Central Asia, East Asia, South Asia & Pacific, Middle East & Africa
Countries Covered United States, Canada, United Kingdom, Germany, France, China, Japan, South Korea, Brazil, Australia
Key Players Influencing the Market Shafi Gluco Chem (Pvt) Limited, Ingredion Incorporated, Cargill, Incorporated, ADM (Archer Daniels Midland Company), Tate & Lyle PLC, Roquette Frères, Tereos, Global Sweeteners Holdings Limited, AGRANA Beteiligungs-AG, Grain Processing Corporation
Additional Attributes Dollar sales by DE value, share by processing technique, regional demand growth, policy influence, clean-label trends, competitive benchmarking

Key Segments

By Dextrose Equivalent (DE) Value:

As per Dextrose Equivalent (DE) Value, the industry has been categorized into Low DE (1-5), Medium DE (6-10), and High DE (11-20).

By Processing Technique:

This segment is further categorized into Native Processing, Modified Processing, and Pregelatinized Processing.

By Functionality:

This segment is further categorized into Stabilizing Agents, Thickening Agents, Binding Agents, and Nutritional Enhancers.

By End-Use Industry:

This segment is further categorized into Food & Beverage, Pharmaceutical, Nutritional Supplements, and Personal Care & Cosmetics.

By Region:

Industry analysis has been carried out in key countries of North America, Latin America, Western Europe, Eastern Europe, Balkans & Baltic, Russia & Belarus, Central Asia, East Asia, South Asia & Pacific, and the Middle East & Africa.

Table of Content

  1. Executive Summary
    • Global Market Outlook
    • Demand-side Trends
    • Supply-side Trends
    • Technology Roadmap Analysis
    • Analysis and Recommendations
  2. Market Overview
    • Market Coverage/Taxonomy
    • Market Definition/Scope/Limitations
  3. Market Background
    • Market Dynamics
      • Drivers
      • Restraints
      • Opportunity
      • Trends
    • Scenario Forecast
      • Demand in Optimistic Scenario
      • Demand in Likely Scenario
      • Demand in Conservative Scenario
    • Opportunity Map Analysis
    • Product Life Cycle Analysis
    • Supply Chain Analysis
      • Supply Side Participants and their Roles
        • Producers
        • Mid-Level Participants (Traders/ Agents/ Brokers)
        • Wholesalers and Distributors
      • Value Added and Value Created at Node in the Supply Chain
      • List of Raw Material Suppliers
      • List of Existing and Potential Buyer’s
    • Investment Feasibility Matrix
    • Value Chain Analysis
      • Profit Margin Analysis
      • Wholesalers and Distributors
      • Retailers
    • PESTLE and Porter’s Analysis
    • Regulatory Landscape
      • By Key Regions
      • By Key Countries
    • Regional Parent Market Outlook
    • Production and Consumption Statistics
    • Import and Export Statistics
  4. Global Market Analysis 2020 to 2024 and Forecast, 2025 to 2035
    • Historical Market Size Value (USD Million) & Volume (Metric Tons) Analysis, 2020 to 2024
    • Current and Future Market Size Value (USD Million) & Volume (Metric Tons) Projections, 2025 to 2035
      • Y-o-Y Growth Trend Analysis
      • Absolute $ Opportunity Analysis
  5. Global Market Pricing Analysis 2020 to 2024 and Forecast 2025 to 2035
  6. Global Market Analysis 2020 to 2024 and Forecast 2025 to 2035, By Dextrose Equivalent (DE) Value
    • Introduction/Key Findings
    • Historical Market Size Value (USD Million) & Volume (Metric Tons) Analysis By Dextrose Equivalent (DE) Value, 2020 to 2024
    • Current and Future Market Size Value (USD Million) & Volume (Metric Tons) Analysis and Forecast By Dextrose Equivalent (DE) Value, 2025 to 2035
      • Low DE (1-5)
      • Medium DE (6-10)
      • High DE (11-20)
    • Y-o-Y Growth Trend Analysis By Dextrose Equivalent (DE) Value, 2020 to 2024
    • Absolute $ Opportunity Analysis By Dextrose Equivalent (DE) Value, 2025 to 2035
  7. Global Market Analysis 2020 to 2024 and Forecast 2025 to 2035, By Processing Technique
    • Introduction/Key Findings
    • Historical Market Size Value (USD Million) & Volume (Metric Tons) Analysis By Processing Technique, 2020 to 2024
    • Current and Future Market Size Value (USD Million) & Volume (Metric Tons) Analysis and Forecast By Processing Technique, 2025 to 2035
      • Native Processing
      • Modified Processing
      • Pregelatinized Processing
    • Y-o-Y Growth Trend Analysis By Processing Technique, 2020 to 2024
    • Absolute $ Opportunity Analysis By Processing Technique, 2025 to 2035
  8. Global Market Analysis 2020 to 2024 and Forecast 2025 to 2035, By Functionality
    • Introduction/Key Findings
    • Historical Market Size Value (USD Million) & Volume (Metric Tons) Analysis By Functionality, 2020 to 2024
    • Current and Future Market Size Value (USD Million) & Volume (Metric Tons) Analysis and Forecast By Functionality, 2025 to 2035
      • Stabilizing Agents
      • Thickening Agents
      • Binding Agents
      • Nutritional Enhancers
    • Y-o-Y Growth Trend Analysis By Functionality, 2020 to 2024
    • Absolute $ Opportunity Analysis By Functionality, 2025 to 2035
  9. Global Market Analysis 2020 to 2024 and Forecast 2025 to 2035, By End-use Industry
    • Introduction/Key Findings
    • Historical Market Size Value (USD Million) & Volume (Metric Tons) Analysis By End-use Industry, 2020 to 2024
    • Current and Future Market Size Value (USD Million) & Volume (Metric Tons) Analysis and Forecast By End-use Industry, 2025 to 2035
      • Food & Beverage
      • Pharmaceutical
      • Nutritional Supplements
      • Personal Care & Cosmetics
    • Y-o-Y Growth Trend Analysis By End-use Industry, 2020 to 2024
    • Absolute $ Opportunity Analysis By End-use Industry, 2025 to 2035
  10. Global Market Analysis 2020 to 2024 and Forecast 2025 to 2035, By Region
    • Introduction
    • Historical Market Size Value (USD Million) & Volume (Metric Tons) Analysis By Region, 2020 to 2024
    • Current Market Size Value (USD Million) & Volume (Metric Tons) Analysis and Forecast By Region, 2025 to 2035
      • North America
      • Latin America
      • Western Europe
      • Eastern Europe
      • East Asia
      • South Asia & Pacific
      • Middle East and Africa
    • Market Attractiveness Analysis By Region
  11. North America Market Analysis 2020 to 2024 and Forecast 2025 to 2035, By Country
    • Historical Market Size Value (USD Million) & Volume (Metric Tons) Trend Analysis By Market Taxonomy, 2020 to 2024
    • Market Size Value (USD Million) & Volume (Metric Tons) Forecast By Market Taxonomy, 2025 to 2035
      • By Country
        • USA
        • Canada
        • Mexico
      • By Dextrose Equivalent (DE) Value
      • By Processing Technique
      • By Functionality
      • By End-use Industry
    • Market Attractiveness Analysis
      • By Country
      • By Dextrose Equivalent (DE) Value
      • By Processing Technique
      • By Functionality
      • By End-use Industry
    • Key Takeaways
  12. Latin America Market Analysis 2020 to 2024 and Forecast 2025 to 2035, By Country
    • Historical Market Size Value (USD Million) & Volume (Metric Tons) Trend Analysis By Market Taxonomy, 2020 to 2024
    • Market Size Value (USD Million) & Volume (Metric Tons) Forecast By Market Taxonomy, 2025 to 2035
      • By Country
        • Brazil
        • Argentina
        • Rest of LATAM
      • By Dextrose Equivalent (DE) Value
      • By Processing Technique
      • By Functionality
      • By End-use Industry
    • Market Attractiveness Analysis
      • By Country
      • By Dextrose Equivalent (DE) Value
      • By Processing Technique
      • By Functionality
      • By End-use Industry
    • Key Takeaways
  13. Western Europe Market Analysis 2020 to 2024 and Forecast 2025 to 2035, By Country
    • Historical Market Size Value (USD Million) & Volume (Metric Tons) Trend Analysis By Market Taxonomy, 2020 to 2024
    • Market Size Value (USD Million) & Volume (Metric Tons) Forecast By Market Taxonomy, 2025 to 2035
      • By Country
        • Germany
        • Italy
        • France
        • UK
        • Spain
        • BENELUX
        • Nordic
        • Rest of W.Europe
      • By Dextrose Equivalent (DE) Value
      • By Processing Technique
      • By Functionality
      • By End-use Industry
    • Market Attractiveness Analysis
      • By Country
      • By Dextrose Equivalent (DE) Value
      • By Processing Technique
      • By Functionality
      • By End-use Industry
    • Key Takeaways
  14. Eastern Europe Market Analysis 2020 to 2024 and Forecast 2025 to 2035, By Country
    • Historical Market Size Value (USD Million) & Volume (Metric Tons) Trend Analysis By Market Taxonomy, 2020 to 2024
    • Market Size Value (USD Million) & Volume (Metric Tons) Forecast By Market Taxonomy, 2025 to 2035
      • By Country
        • Russia
        • Hungary
        • Poland
        • Balkan & Baltics
        • Rest of E. Europe
      • By Dextrose Equivalent (DE) Value
      • By Processing Technique
      • By Functionality
      • By End-use Industry
    • Market Attractiveness Analysis
      • By Country
      • By Dextrose Equivalent (DE) Value
      • By Processing Technique
      • By Functionality
      • By End-use Industry
    • Key Takeaways
  15. East Asia Market Analysis 2020 to 2024 and Forecast 2025 to 2035, By Country
    • Historical Market Size Value (USD Million) & Volume (Metric Tons) Trend Analysis By Market Taxonomy, 2020 to 2024
    • Market Size Value (USD Million) & Volume (Metric Tons) Forecast By Market Taxonomy, 2025 to 2035
      • By Country
        • China
        • Japan
        • South Korea
      • By Dextrose Equivalent (DE) Value
      • By Processing Technique
      • By Functionality
      • By End-use Industry
    • Market Attractiveness Analysis
      • By Country
      • By Dextrose Equivalent (DE) Value
      • By Processing Technique
      • By Functionality
      • By End-use Industry
    • Key Takeaways
  16. South Asia & Pacific Market Analysis 2020 to 2024 and Forecast 2025 to 2035, By Country
    • Historical Market Size Value (USD Million) & Volume (Metric Tons) Trend Analysis By Market Taxonomy, 2020 to 2024
    • Market Size Value (USD Million) & Volume (Metric Tons) Forecast By Market Taxonomy, 2025 to 2035
      • By Country
        • India
        • Australia & New Zealand
        • ASEAN
        • Rest of SAP
      • By Dextrose Equivalent (DE) Value
      • By Processing Technique
      • By Functionality
      • By End-use Industry
    • Market Attractiveness Analysis
      • By Country
      • By Dextrose Equivalent (DE) Value
      • By Processing Technique
      • By Functionality
      • By End-use Industry
    • Key Takeaways
  17. Middle East and Africa Market Analysis 2020 to 2024 and Forecast 2025 to 2035, By Country
    • Historical Market Size Value (USD Million) & Volume (Metric Tons) Trend Analysis By Market Taxonomy, 2020 to 2024
    • Market Size Value (USD Million) & Volume (Metric Tons) Forecast By Market Taxonomy, 2025 to 2035
      • By Country
        • GCC Countries
        • Northern Africa
        • South Africa
        • Turkiye
        • Rest of MEA
      • By Dextrose Equivalent (DE) Value
      • By Processing Technique
      • By Functionality
      • By End-use Industry
    • Market Attractiveness Analysis
      • By Country
      • By Dextrose Equivalent (DE) Value
      • By Processing Technique
      • By Functionality
      • By End-use Industry
    • Key Takeaways
  18. Key Countries Market Analysis
    • USA
      • Pricing Analysis
      • Market Share Analysis, 2024
        • By Dextrose Equivalent (DE) Value
        • By Processing Technique
        • By Functionality
        • By End-use Industry
    • Canada
      • Pricing Analysis
      • Market Share Analysis, 2024
        • By Dextrose Equivalent (DE) Value
        • By Processing Technique
        • By Functionality
        • By End-use Industry
    • Brazil
      • Pricing Analysis
      • Market Share Analysis, 2024
        • By Dextrose Equivalent (DE) Value
        • By Processing Technique
        • By Functionality
        • By End-use Industry
    • Mexico
      • Pricing Analysis
      • Market Share Analysis, 2024
        • By Dextrose Equivalent (DE) Value
        • By Processing Technique
        • By Functionality
        • By End-use Industry
    • Argentina
      • Pricing Analysis
      • Market Share Analysis, 2024
        • By Dextrose Equivalent (DE) Value
        • By Processing Technique
        • By Functionality
        • By End-use Industry
  19. Market Structure Analysis
    • Competition Dashboard
    • Competition Benchmarking
    • Market Share Analysis of Top Players
      • By Regional
      • By Dextrose Equivalent (DE) Value
      • By Processing Technique
      • By Functionality
      • By End-use Industry
  20. Competition Analysis
    • Competition Deep Dive
      • Shafi Gluco Chem (Pvt) Limited
        • Overview
        • Product Portfolio
        • Profitability by Market Segments (Product/Age /Sales Channel/Region)
        • Sales Footprint
        • Strategy Overview
          • Marketing Strategy
          • Product Strategy
          • Channel Strategy
      • Ingredion Incorporated
        • Overview
        • Product Portfolio
        • Profitability by Market Segments (Product/Age /Sales Channel/Region)
        • Sales Footprint
        • Strategy Overview
          • Marketing Strategy
          • Product Strategy
          • Channel Strategy
      • Cargill, Incorporated
        • Overview
        • Product Portfolio
        • Profitability by Market Segments (Product/Age /Sales Channel/Region)
        • Sales Footprint
        • Strategy Overview
          • Marketing Strategy
          • Product Strategy
          • Channel Strategy
      • ADM (Archer Daniels Midland Company)
        • Overview
        • Product Portfolio
        • Profitability by Market Segments (Product/Age /Sales Channel/Region)
        • Sales Footprint
        • Strategy Overview
          • Marketing Strategy
          • Product Strategy
          • Channel Strategy
      • Tate & Lyle PLC
        • Overview
        • Product Portfolio
        • Profitability by Market Segments (Product/Age /Sales Channel/Region)
        • Sales Footprint
        • Strategy Overview
          • Marketing Strategy
          • Product Strategy
          • Channel Strategy
      • Roquette Frères
        • Overview
        • Product Portfolio
        • Profitability by Market Segments (Product/Age /Sales Channel/Region)
        • Sales Footprint
        • Strategy Overview
          • Marketing Strategy
          • Product Strategy
          • Channel Strategy
      • Tereos
        • Overview
        • Product Portfolio
        • Profitability by Market Segments (Product/Age /Sales Channel/Region)
        • Sales Footprint
        • Strategy Overview
          • Marketing Strategy
          • Product Strategy
          • Channel Strategy
      • Global Sweeteners Holdings Limited
        • Overview
        • Product Portfolio
        • Profitability by Market Segments (Product/Age /Sales Channel/Region)
        • Sales Footprint
        • Strategy Overview
          • Marketing Strategy
          • Product Strategy
          • Channel Strategy
      • AGRANA Beteiligungs-AG
        • Overview
        • Product Portfolio
        • Profitability by Market Segments (Product/Age /Sales Channel/Region)
        • Sales Footprint
        • Strategy Overview
          • Marketing Strategy
          • Product Strategy
          • Channel Strategy
      • Grain Processing Corporation
        • Overview
        • Product Portfolio
        • Profitability by Market Segments (Product/Age /Sales Channel/Region)
        • Sales Footprint
        • Strategy Overview
          • Marketing Strategy
          • Product Strategy
          • Channel Strategy
  21. Assumptions & Acronyms Used
  22. Research Methodology

List of Tables

  • Table 1: Global Market Value (USD Million) Forecast by Region, 2020-2035
  • Table 2: Global Market Volume (Metric Tons) Forecast by Region, 2020-2035
  • Table 3: Global Market Value (USD Million) Forecast by Dextrose Equivalent (DE) Value, 2020-2035
  • Table 4: Global Market Volume (Metric Tons) Forecast by Dextrose Equivalent (DE) Value, 2020-2035
  • Table 5: Global Market Value (USD Million) Forecast by Processing Technique, 2020-2035
  • Table 6: Global Market Volume (Metric Tons) Forecast by Processing Technique, 2020-2035
  • Table 7: Global Market Value (USD Million) Forecast by Functionality, 2020-2035
  • Table 8: Global Market Volume (Metric Tons) Forecast by Functionality, 2020-2035
  • Table 9: Global Market Value (USD Million) Forecast by End-use Industry, 2020-2035
  • Table 10: Global Market Volume (Metric Tons) Forecast by End-use Industry, 2020-2035
  • Table 11: North America Market Value (USD Million) Forecast by Country, 2020-2035
  • Table 12: North America Market Volume (Metric Tons) Forecast by Country, 2020-2035
  • Table 13: North America Market Value (USD Million) Forecast by Dextrose Equivalent (DE) Value, 2020-2035
  • Table 14: North America Market Volume (Metric Tons) Forecast by Dextrose Equivalent (DE) Value, 2020-2035
  • Table 15: North America Market Value (USD Million) Forecast by Processing Technique, 2020-2035
  • Table 16: North America Market Volume (Metric Tons) Forecast by Processing Technique, 2020-2035
  • Table 17: North America Market Value (USD Million) Forecast by Functionality, 2020-2035
  • Table 18: North America Market Volume (Metric Tons) Forecast by Functionality, 2020-2035
  • Table 19: North America Market Value (USD Million) Forecast by End-use Industry, 2020-2035
  • Table 20: North America Market Volume (Metric Tons) Forecast by End-use Industry, 2020-2035
  • Table 21: Latin America Market Value (USD Million) Forecast by Country, 2020-2035
  • Table 22: Latin America Market Volume (Metric Tons) Forecast by Country, 2020-2035
  • Table 23: Latin America Market Value (USD Million) Forecast by Dextrose Equivalent (DE) Value, 2020-2035
  • Table 24: Latin America Market Volume (Metric Tons) Forecast by Dextrose Equivalent (DE) Value, 2020-2035
  • Table 25: Latin America Market Value (USD Million) Forecast by Processing Technique, 2020-2035
  • Table 26: Latin America Market Volume (Metric Tons) Forecast by Processing Technique, 2020-2035
  • Table 27: Latin America Market Value (USD Million) Forecast by Functionality, 2020-2035
  • Table 28: Latin America Market Volume (Metric Tons) Forecast by Functionality, 2020-2035
  • Table 29: Latin America Market Value (USD Million) Forecast by End-use Industry, 2020-2035
  • Table 30: Latin America Market Volume (Metric Tons) Forecast by End-use Industry, 2020-2035
  • Table 31: Western Europe Market Value (USD Million) Forecast by Country, 2020-2035
  • Table 32: Western Europe Market Volume (Metric Tons) Forecast by Country, 2020-2035
  • Table 33: Western Europe Market Value (USD Million) Forecast by Dextrose Equivalent (DE) Value, 2020-2035
  • Table 34: Western Europe Market Volume (Metric Tons) Forecast by Dextrose Equivalent (DE) Value, 2020-2035
  • Table 35: Western Europe Market Value (USD Million) Forecast by Processing Technique, 2020-2035
  • Table 36: Western Europe Market Volume (Metric Tons) Forecast by Processing Technique, 2020-2035
  • Table 37: Western Europe Market Value (USD Million) Forecast by Functionality, 2020-2035
  • Table 38: Western Europe Market Volume (Metric Tons) Forecast by Functionality, 2020-2035
  • Table 39: Western Europe Market Value (USD Million) Forecast by End-use Industry, 2020-2035
  • Table 40: Western Europe Market Volume (Metric Tons) Forecast by End-use Industry, 2020-2035
  • Table 41: Eastern Europe Market Value (USD Million) Forecast by Country, 2020-2035
  • Table 42: Eastern Europe Market Volume (Metric Tons) Forecast by Country, 2020-2035
  • Table 43: Eastern Europe Market Value (USD Million) Forecast by Dextrose Equivalent (DE) Value, 2020-2035
  • Table 44: Eastern Europe Market Volume (Metric Tons) Forecast by Dextrose Equivalent (DE) Value, 2020-2035
  • Table 45: Eastern Europe Market Value (USD Million) Forecast by Processing Technique, 2020-2035
  • Table 46: Eastern Europe Market Volume (Metric Tons) Forecast by Processing Technique, 2020-2035
  • Table 47: Eastern Europe Market Value (USD Million) Forecast by Functionality, 2020-2035
  • Table 48: Eastern Europe Market Volume (Metric Tons) Forecast by Functionality, 2020-2035
  • Table 49: Eastern Europe Market Value (USD Million) Forecast by End-use Industry, 2020-2035
  • Table 50: Eastern Europe Market Volume (Metric Tons) Forecast by End-use Industry, 2020-2035
  • Table 51: East Asia Market Value (USD Million) Forecast by Country, 2020-2035
  • Table 52: East Asia Market Volume (Metric Tons) Forecast by Country, 2020-2035
  • Table 53: East Asia Market Value (USD Million) Forecast by Dextrose Equivalent (DE) Value, 2020-2035
  • Table 54: East Asia Market Volume (Metric Tons) Forecast by Dextrose Equivalent (DE) Value, 2020-2035
  • Table 55: East Asia Market Value (USD Million) Forecast by Processing Technique, 2020-2035
  • Table 56: East Asia Market Volume (Metric Tons) Forecast by Processing Technique, 2020-2035
  • Table 57: East Asia Market Value (USD Million) Forecast by Functionality, 2020-2035
  • Table 58: East Asia Market Volume (Metric Tons) Forecast by Functionality, 2020-2035
  • Table 59: East Asia Market Value (USD Million) Forecast by End-use Industry, 2020-2035
  • Table 60: East Asia Market Volume (Metric Tons) Forecast by End-use Industry, 2020-2035
  • Table 61: South Asia & Pacific Market Value (USD Million) Forecast by Country, 2020-2035
  • Table 62: South Asia & Pacific Market Volume (Metric Tons) Forecast by Country, 2020-2035
  • Table 63: South Asia & Pacific Market Value (USD Million) Forecast by Dextrose Equivalent (DE) Value, 2020-2035
  • Table 64: South Asia & Pacific Market Volume (Metric Tons) Forecast by Dextrose Equivalent (DE) Value, 2020-2035
  • Table 65: South Asia & Pacific Market Value (USD Million) Forecast by Processing Technique, 2020-2035
  • Table 66: South Asia & Pacific Market Volume (Metric Tons) Forecast by Processing Technique, 2020-2035
  • Table 67: South Asia & Pacific Market Value (USD Million) Forecast by Functionality, 2020-2035
  • Table 68: South Asia & Pacific Market Volume (Metric Tons) Forecast by Functionality, 2020-2035
  • Table 69: South Asia & Pacific Market Value (USD Million) Forecast by End-use Industry, 2020-2035
  • Table 70: South Asia & Pacific Market Volume (Metric Tons) Forecast by End-use Industry, 2020-2035
  • Table 71: Middle East and Africa Market Value (USD Million) Forecast by Country, 2020-2035
  • Table 72: Middle East and Africa Market Volume (Metric Tons) Forecast by Country, 2020-2035
  • Table 73: Middle East and Africa Market Value (USD Million) Forecast by Dextrose Equivalent (DE) Value, 2020-2035
  • Table 74: Middle East and Africa Market Volume (Metric Tons) Forecast by Dextrose Equivalent (DE) Value, 2020-2035
  • Table 75: Middle East and Africa Market Value (USD Million) Forecast by Processing Technique, 2020-2035
  • Table 76: Middle East and Africa Market Volume (Metric Tons) Forecast by Processing Technique, 2020-2035
  • Table 77: Middle East and Africa Market Value (USD Million) Forecast by Functionality, 2020-2035
  • Table 78: Middle East and Africa Market Volume (Metric Tons) Forecast by Functionality, 2020-2035
  • Table 79: Middle East and Africa Market Value (USD Million) Forecast by End-use Industry, 2020-2035
  • Table 80: Middle East and Africa Market Volume (Metric Tons) Forecast by End-use Industry, 2020-2035

List of Figures

  • Figure 1: Global Market Volume (Metric Tons) Forecast 2020-2035
  • Figure 2: Global Market Pricing Analysis
  • Figure 3: Global Market Value (USD Million) Forecast 2020-2035
  • Figure 4: Global Market Value Share and BPS Analysis by Dextrose Equivalent (DE) Value, 2025 and 2035
  • Figure 5: Global Market Y-o-Y Growth Comparison by Dextrose Equivalent (DE) Value, 2025-2035
  • Figure 6: Global Market Attractiveness Analysis by Dextrose Equivalent (DE) Value
  • Figure 7: Global Market Value Share and BPS Analysis by Processing Technique, 2025 and 2035
  • Figure 8: Global Market Y-o-Y Growth Comparison by Processing Technique, 2025-2035
  • Figure 9: Global Market Attractiveness Analysis by Processing Technique
  • Figure 10: Global Market Value Share and BPS Analysis by Functionality, 2025 and 2035
  • Figure 11: Global Market Y-o-Y Growth Comparison by Functionality, 2025-2035
  • Figure 12: Global Market Attractiveness Analysis by Functionality
  • Figure 13: Global Market Value Share and BPS Analysis by End-use Industry, 2025 and 2035
  • Figure 14: Global Market Y-o-Y Growth Comparison by End-use Industry, 2025-2035
  • Figure 15: Global Market Attractiveness Analysis by End-use Industry
  • Figure 16: Global Market Value (USD Million) Share and BPS Analysis by Region, 2025 and 2035
  • Figure 17: Global Market Y-o-Y Growth Comparison by Region, 2025-2035
  • Figure 18: Global Market Attractiveness Analysis by Region
  • Figure 19: North America Market Incremental $ Opportunity, 2025-2035
  • Figure 20: Latin America Market Incremental $ Opportunity, 2025-2035
  • Figure 21: Western Europe Market Incremental $ Opportunity, 2025-2035
  • Figure 22: Eastern Europe Market Incremental $ Opportunity, 2025-2035
  • Figure 23: East Asia Market Incremental $ Opportunity, 2025-2035
  • Figure 24: South Asia & Pacific Market Incremental $ Opportunity, 2025-2035
  • Figure 25: Middle East and Africa Market Incremental $ Opportunity, 2025-2035
  • Figure 26: North America Market Value Share and BPS Analysis by Country, 2025 and 2035
  • Figure 27: North America Market Value Share and BPS Analysis by Dextrose Equivalent (DE) Value, 2025 and 2035
  • Figure 28: North America Market Y-o-Y Growth Comparison by Dextrose Equivalent (DE) Value, 2025-2035
  • Figure 29: North America Market Attractiveness Analysis by Dextrose Equivalent (DE) Value
  • Figure 30: North America Market Value Share and BPS Analysis by Processing Technique, 2025 and 2035
  • Figure 31: North America Market Y-o-Y Growth Comparison by Processing Technique, 2025-2035
  • Figure 32: North America Market Attractiveness Analysis by Processing Technique
  • Figure 33: North America Market Value Share and BPS Analysis by Functionality, 2025 and 2035
  • Figure 34: North America Market Y-o-Y Growth Comparison by Functionality, 2025-2035
  • Figure 35: North America Market Attractiveness Analysis by Functionality
  • Figure 36: North America Market Value Share and BPS Analysis by End-use Industry, 2025 and 2035
  • Figure 37: North America Market Y-o-Y Growth Comparison by End-use Industry, 2025-2035
  • Figure 38: North America Market Attractiveness Analysis by End-use Industry
  • Figure 39: Latin America Market Value Share and BPS Analysis by Country, 2025 and 2035
  • Figure 40: Latin America Market Value Share and BPS Analysis by Dextrose Equivalent (DE) Value, 2025 and 2035
  • Figure 41: Latin America Market Y-o-Y Growth Comparison by Dextrose Equivalent (DE) Value, 2025-2035
  • Figure 42: Latin America Market Attractiveness Analysis by Dextrose Equivalent (DE) Value
  • Figure 43: Latin America Market Value Share and BPS Analysis by Processing Technique, 2025 and 2035
  • Figure 44: Latin America Market Y-o-Y Growth Comparison by Processing Technique, 2025-2035
  • Figure 45: Latin America Market Attractiveness Analysis by Processing Technique
  • Figure 46: Latin America Market Value Share and BPS Analysis by Functionality, 2025 and 2035
  • Figure 47: Latin America Market Y-o-Y Growth Comparison by Functionality, 2025-2035
  • Figure 48: Latin America Market Attractiveness Analysis by Functionality
  • Figure 49: Latin America Market Value Share and BPS Analysis by End-use Industry, 2025 and 2035
  • Figure 50: Latin America Market Y-o-Y Growth Comparison by End-use Industry, 2025-2035
  • Figure 51: Latin America Market Attractiveness Analysis by End-use Industry
  • Figure 52: Western Europe Market Value Share and BPS Analysis by Country, 2025 and 2035
  • Figure 53: Western Europe Market Value Share and BPS Analysis by Dextrose Equivalent (DE) Value, 2025 and 2035
  • Figure 54: Western Europe Market Y-o-Y Growth Comparison by Dextrose Equivalent (DE) Value, 2025-2035
  • Figure 55: Western Europe Market Attractiveness Analysis by Dextrose Equivalent (DE) Value
  • Figure 56: Western Europe Market Value Share and BPS Analysis by Processing Technique, 2025 and 2035
  • Figure 57: Western Europe Market Y-o-Y Growth Comparison by Processing Technique, 2025-2035
  • Figure 58: Western Europe Market Attractiveness Analysis by Processing Technique
  • Figure 59: Western Europe Market Value Share and BPS Analysis by Functionality, 2025 and 2035
  • Figure 60: Western Europe Market Y-o-Y Growth Comparison by Functionality, 2025-2035
  • Figure 61: Western Europe Market Attractiveness Analysis by Functionality
  • Figure 62: Western Europe Market Value Share and BPS Analysis by End-use Industry, 2025 and 2035
  • Figure 63: Western Europe Market Y-o-Y Growth Comparison by End-use Industry, 2025-2035
  • Figure 64: Western Europe Market Attractiveness Analysis by End-use Industry
  • Figure 65: Eastern Europe Market Value Share and BPS Analysis by Country, 2025 and 2035
  • Figure 66: Eastern Europe Market Value Share and BPS Analysis by Dextrose Equivalent (DE) Value, 2025 and 2035
  • Figure 67: Eastern Europe Market Y-o-Y Growth Comparison by Dextrose Equivalent (DE) Value, 2025-2035
  • Figure 68: Eastern Europe Market Attractiveness Analysis by Dextrose Equivalent (DE) Value
  • Figure 69: Eastern Europe Market Value Share and BPS Analysis by Processing Technique, 2025 and 2035
  • Figure 70: Eastern Europe Market Y-o-Y Growth Comparison by Processing Technique, 2025-2035
  • Figure 71: Eastern Europe Market Attractiveness Analysis by Processing Technique
  • Figure 72: Eastern Europe Market Value Share and BPS Analysis by Functionality, 2025 and 2035
  • Figure 73: Eastern Europe Market Y-o-Y Growth Comparison by Functionality, 2025-2035
  • Figure 74: Eastern Europe Market Attractiveness Analysis by Functionality
  • Figure 75: Eastern Europe Market Value Share and BPS Analysis by End-use Industry, 2025 and 2035
  • Figure 76: Eastern Europe Market Y-o-Y Growth Comparison by End-use Industry, 2025-2035
  • Figure 77: Eastern Europe Market Attractiveness Analysis by End-use Industry
  • Figure 78: East Asia Market Value Share and BPS Analysis by Country, 2025 and 2035
  • Figure 79: East Asia Market Value Share and BPS Analysis by Dextrose Equivalent (DE) Value, 2025 and 2035
  • Figure 80: East Asia Market Y-o-Y Growth Comparison by Dextrose Equivalent (DE) Value, 2025-2035
  • Figure 81: East Asia Market Attractiveness Analysis by Dextrose Equivalent (DE) Value
  • Figure 82: East Asia Market Value Share and BPS Analysis by Processing Technique, 2025 and 2035
  • Figure 83: East Asia Market Y-o-Y Growth Comparison by Processing Technique, 2025-2035
  • Figure 84: East Asia Market Attractiveness Analysis by Processing Technique
  • Figure 85: East Asia Market Value Share and BPS Analysis by Functionality, 2025 and 2035
  • Figure 86: East Asia Market Y-o-Y Growth Comparison by Functionality, 2025-2035
  • Figure 87: East Asia Market Attractiveness Analysis by Functionality
  • Figure 88: East Asia Market Value Share and BPS Analysis by End-use Industry, 2025 and 2035
  • Figure 89: East Asia Market Y-o-Y Growth Comparison by End-use Industry, 2025-2035
  • Figure 90: East Asia Market Attractiveness Analysis by End-use Industry
  • Figure 91: South Asia & Pacific Market Value Share and BPS Analysis by Country, 2025 and 2035
  • Figure 92: South Asia & Pacific Market Value Share and BPS Analysis by Dextrose Equivalent (DE) Value, 2025 and 2035
  • Figure 93: South Asia & Pacific Market Y-o-Y Growth Comparison by Dextrose Equivalent (DE) Value, 2025-2035
  • Figure 94: South Asia & Pacific Market Attractiveness Analysis by Dextrose Equivalent (DE) Value
  • Figure 95: South Asia & Pacific Market Value Share and BPS Analysis by Processing Technique, 2025 and 2035
  • Figure 96: South Asia & Pacific Market Y-o-Y Growth Comparison by Processing Technique, 2025-2035
  • Figure 97: South Asia & Pacific Market Attractiveness Analysis by Processing Technique
  • Figure 98: South Asia & Pacific Market Value Share and BPS Analysis by Functionality, 2025 and 2035
  • Figure 99: South Asia & Pacific Market Y-o-Y Growth Comparison by Functionality, 2025-2035
  • Figure 100: South Asia & Pacific Market Attractiveness Analysis by Functionality
  • Figure 101: South Asia & Pacific Market Value Share and BPS Analysis by End-use Industry, 2025 and 2035
  • Figure 102: South Asia & Pacific Market Y-o-Y Growth Comparison by End-use Industry, 2025-2035
  • Figure 103: South Asia & Pacific Market Attractiveness Analysis by End-use Industry
  • Figure 104: Middle East and Africa Market Value Share and BPS Analysis by Country, 2025 and 2035
  • Figure 105: Middle East and Africa Market Value Share and BPS Analysis by Dextrose Equivalent (DE) Value, 2025 and 2035
  • Figure 106: Middle East and Africa Market Y-o-Y Growth Comparison by Dextrose Equivalent (DE) Value, 2025-2035
  • Figure 107: Middle East and Africa Market Attractiveness Analysis by Dextrose Equivalent (DE) Value
  • Figure 108: Middle East and Africa Market Value Share and BPS Analysis by Processing Technique, 2025 and 2035
  • Figure 109: Middle East and Africa Market Y-o-Y Growth Comparison by Processing Technique, 2025-2035
  • Figure 110: Middle East and Africa Market Attractiveness Analysis by Processing Technique
  • Figure 111: Middle East and Africa Market Value Share and BPS Analysis by Functionality, 2025 and 2035
  • Figure 112: Middle East and Africa Market Y-o-Y Growth Comparison by Functionality, 2025-2035
  • Figure 113: Middle East and Africa Market Attractiveness Analysis by Functionality
  • Figure 114: Middle East and Africa Market Value Share and BPS Analysis by End-use Industry, 2025 and 2035
  • Figure 115: Middle East and Africa Market Y-o-Y Growth Comparison by End-use Industry, 2025-2035
  • Figure 116: Middle East and Africa Market Attractiveness Analysis by End-use Industry
  • Figure 117: Global Market - Tier Structure Analysis
  • Figure 118: Global Market - Company Share Analysis

Frequently Asked Questions

What is the projected size of the tapioca maltodextrin market in 2025?

The market is valued at USD 670.6 million in 2025.

What is the outlook on tapioca maltodextrin demand by 2035?

The market is forecasted to reach USD 1,397.9 million by 2035, reflecting a CAGR of 7.6%.

Which segment leads the tapioca maltodextrin market by end-use industry in 2025?

The food & beverage segment is expected to hold approximately 50% of the global market share in 2025.

What is the top DE value segment for the tapioca maltodextrin market in 2025?

Medium DE (6-10) will dominate the DE value segment with a 41.2% share in 2025.

Which country is projected to have the fastest-growing tapioca maltodextrin market?

Japan is anticipated to be the fastest-growing country with a CAGR of 8.1% from 2025 to 2035.

Explore Similar Insights

Future Market Insights

Tapioca Maltodextrin Market