The demand for global Tapioca Pearls market is expected to be valued at USD 4.88 Billion in 2025, forecasted at a CAGR of 2.4% to have an estimated value of USD 6.31 Billion from 2025 to 2035. From 2020 to 2025 a CAGR of 1.8% was registered for the market.
Tapioca pearl sales are anticipated to grow rapidly in the food and beverage industry. They are widely used to thicken pudding and other liquid foods. In addition, these serve as stabilizing agents in textiles glue and cosmetics.
Due to their high folate iron, magnesium & calcium content healthcare providers frequently advise pregnant women to consume foods and drinks infused with tapioca pearls. Given consumers growing awareness of healthcare issues it is projected that the demand for tapioca pearls will increase in the years to come.
The ongoing changes brought about by global geopolitical events that impact the supply of tapioca pearls logistics and consumer demand in the face of unstable economic conditions highlight the necessity for businesses to maintain a competitive edge through increased awareness and proactive measures. Due to the economic and social effects differ greatly between nations and markets market participants for tapioca pearls must create strategies that are specific to the needs of their respective nations.
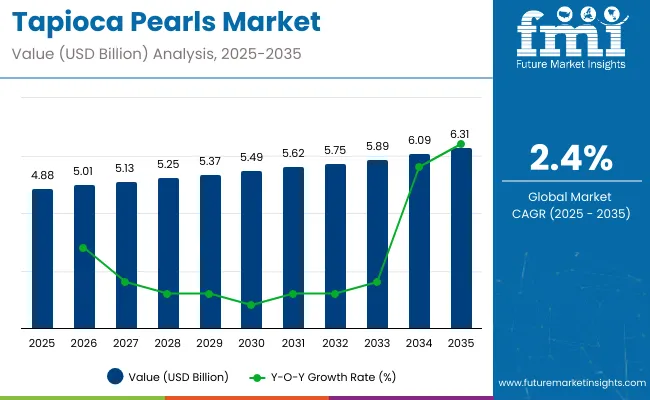
| Attributes | Description |
|---|---|
| Estimated Global Industry Size (2025E) | USD 4.88 Billion |
| Projected Global Industry Value (2035F) | USD 6.31 Billion |
| Value-based CAGR (2025 to 2035) | 2.4% |
Due to the consumption of Taiwanese bubble tea also referred to as boba tea these have recently become extremely popular all over the world. McDonalds and other fast food restaurants have begun offering tapioca pearl dessert drinks throughout Europe as part of an effort to improve their current menu.
Per capita spending on tapioca pearls is increasing globally, largely due to the sustained popularity of bubble tea (boba) and related dessert beverages. Urbanization, the growth of specialty tea chains, and youth-driven demand for customizable, indulgent drinks are key factors. As tapioca pearls gain traction not only in traditional Asian markets but also in North America, Europe, and the Middle East, average consumer spending is rising.
Developed Countries:
In markets such as the United States, Canada, the United Kingdom, Germany, and Australia, per capita spending on tapioca pearls has grown significantly with the expansion of bubble tea cafes and Asian dessert shops. Consumers are willing to pay premium prices for high-quality or flavored pearls, such as brown sugar or crystal variants. Brands like Gong Cha, Chatime, CoCo, and Kung Fu Tea contribute to increased consumption, supported by retail availability of DIY kits and frozen tapioca pearls.
Emerging Markets:
In countries like India, Brazil, Indonesia, South Africa, and the Philippines, per capita spending on tapioca pearls is also on the rise, although from a lower base. The growing presence of tea cafes, rising middle-class income, and exposure to global food trends are driving demand. Local producers and startups are beginning to enter the market with both ready-to-drink beverages and retail packs of tapioca pearls for home use.
The global trade of tapioca pearls is expanding rapidly as bubble tea and tapioca-based desserts continue to grow in popularity across both developed and emerging markets. Exporting countries are capitalizing on strong agricultural output and manufacturing capabilities, while importing nations seek consistent supply and product variety to meet rising demand in foodservice and retail sectors.
Major Exporting Countries:
Thailand, Vietnam, Taiwan, China, and Indonesia are key exporters.
Thailand and Vietnam lead in volume exports due to abundant tapioca starch production and competitive pricing. Taiwan is a top source for high-quality and specialty pearls, including flavored and brown sugar varieties, often used by premium bubble tea chains.
Major Importing Countries:
The United States, Canada, the United Kingdom, Japan, and South Korea are major importers. The United States and Canada import large volumes of tapioca pearls to serve bubble tea shops, Asian grocery stores, and beverage manufacturers. The United Kingdom has seen growing demand driven by younger consumers and expanding tea cafe chains.
Medium-sized pearls (5 mm to 8 mm) dominated the market with a 44.7% share in 2025, preferred for bubble tea due to ideal texture. The beverage industry led with a 27.0% market share, driven by expanding use of tapioca pearls in tea, smoothies, and specialty drinks worldwide.
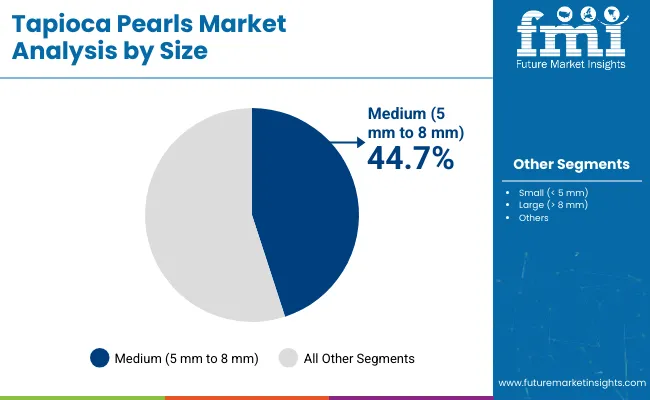
Medium-sized tapioca pearls accounted for a 44.7% share in 2025, becoming the most preferred size in the global tapioca pearls market. These pearls, measuring 5 mm to 8 mm, provide an optimal balance of chewiness and mouthfeel, making them ideal for bubble tea. Their popularity surged as bubble tea chains expanded globally, particularly in Asia Pacific, North America, and Europe.
Small-sized pearls are primarily used in desserts like puddings, while large-sized pearls suit thicker beverages but remain niche. Medium pearls ensure quick cooking, uniform texture, and consistent consumer satisfaction. In 2024, multiple foodservice chains switched to medium-sized variants for operational ease and consumer preference.
Manufacturers such as Bob’s Red Mill and WuFuYuan have reported high demand for medium pearls in retail and foodservice. Rising at-home bubble tea preparation trends also favor this size, supporting continued dominance. Sustainability certifications and clean-label claims have further enhanced their adoption by health-conscious buyers globally.
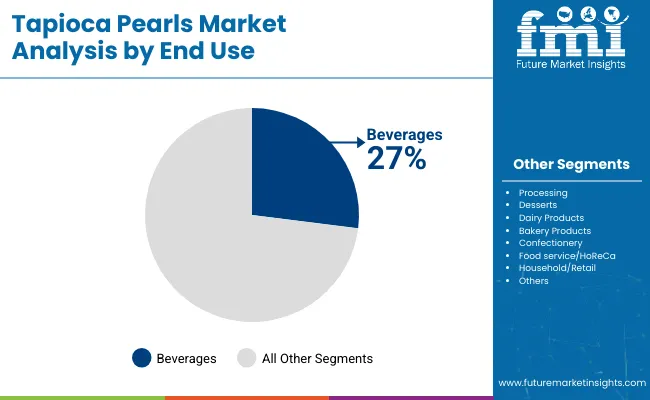
The beverage industry captured a 27.0% market share in 2025, making it the leading end-use segment for tapioca pearls. The dominance stems from the global popularity of bubble tea, smoothies, and specialty beverages that require chewy tapioca pearls for texture enhancement. Tapioca pearls are favored because they are odorless, tasteless, and adaptable to various drink flavors.
Major tea chains and cafés in Asia Pacific, the USA, and Europe have expanded menu offerings to include pearl-infused drinks. In 2024, brands like Gong Cha and CoCo Fresh Tea & Juice reported increased tapioca pearl procurement as new bubble tea stores opened worldwide.
The foodservice sector's demand for high-quality, quick-cooking pearls also boosted this segment. Additionally, the beverage industry benefits from tapioca’s stabilizing and gelling properties, allowing for product innovation in functional and flavored drinks. As health-focused beverages gain momentum, tapioca pearls are included in low-sugar, organic, and vegan-friendly drink formulations, ensuring long-term demand.
Demand for Bubble Tea Pushes the Market Growth
A significant factor that is anticipated to propel the growth of the tapioca pearls market during the evaluation period is the rising consumption of tea and coffee as nootropic beverages among students and the working class. Bubble tea and other low-calorie fat-free hot beverages can improve brain function and concentration when consumed in moderation according to research.
Additionally, it is anticipated that this factor will drive the markets growth. Additionally, the market is expected to benefit from the availability of a variety of flavors including coffee chocolate fruits and simple classics in the bubble tea industry. Growth will also be fueled by consumers growing preference for hot beverages over carbonated drinks because of their many health advantages.
Inherent Properties Increases the Market Demand
Broad agro-ecological adaptability and the cassava plants capacity to yield more at a reasonable cost has made it easier for end-use industries to meet their growing demand for tapioca starch widely distributed. Tapioca starch can be used in a wide range of industries from animal feed to food and drink sustain the expansion of the market for tapioca starch.
Tapioca starch’s natural qualities allow it to be used as a substitute for some of the most popular starches in the world such as potato and corn starches. Therefore, in tropical regions tapioca starch has become extremely popular as one of the essential calorie sources after rice and maize.
Innovations in Products is Driving the Market Growth
Manufacturers are introducing innovations in relation to tapioca starch as its popularity is on the rise in packaging strategies and processing techniques. New recipes that use tapioca starch have also been developed gaining international traction lately. New packaging designs are being considered in response to consumers shifting consumption habits, a crucial sales tactic for contemporary consumers who are growing more product-savvy labeling and choosing clean-label goods.
Additionally, food producers are trying out new methods to deliver various snacks such as tapioca starch to compete with well-established snacks made from corn and potato starch. Clean-label products are preferred by consumers due to their taste quality and combination with cassava extract will be able to function as a successful substitute for modified starches used in processed foods remain important factors influencing the tapioca starch markets growth.
Infant Food Demands Drives the Market
In many commercially available baby products, tapioca starch has been widely used as a bodying agent food items and nutritional supplements for babies. Organic gluten-free tapioca starch has seen significant growth consumption from people who have celiac disease. The demand for infant formulas has been driven by the increase in the number of working women. growth in the market for tapioca starch in the years to come.
This cassava extract is a good source of nutrients as a superfood in nations like India because of the health advantages it offers. Tapioca starch is rich in minerals like calcium and iron which are necessary for healthy living in addition to being enhanced with carbohydrates keeping the blood and bones healthy.
Additionally, tapioca pearls witness high consumption on account of their characteristic such as controlling blood pressure and preventing indigestion and constipation health advantages like these will sustain the growth of tapioca starch in the future and increase the appeal of this cassava extract.
Tier 1 companies includes industry leaders acquiring a 30% share in the global business market. These leaders are distinguished by their extensive product portfolio and high production capacity. These industry leaders stand out due to their broad geographic reach, in-depth knowledge of manufacturing and reconditioning across various formats and strong customer base. They offer a variety of services and manufacturing with the newest technology while adhering to legal requirements for the best quality.
Tier 2 companies comprises mid-size players having a presence in some regions and highly influencing the local commerce and has a market share of 20%. These are distinguished by their robust global presence and solid business acumen. These industry participants may not have cutting-edge technology or a broad global reach but they do have good technology and guarantee regulatory compliance.
Tier 3 companies includes mostly of small-scale businesses serving niche economies and operating at the local presence having a market share of 50%. Due to their notable focus on meeting local needs these businesses are categorized as belonging to the tier 3 share segment, they are minor players with a constrained geographic scope. As an unorganized ecosystem Tier 3 in this context refers to a sector that in contrast to its organized competitors, lacks extensive structure and formalization.
The following table shows the forecasted growth rates of the significant three geographies revenues. US, Italy and India come under the exhibit of high consumption, recording CAGRs of 2.1%, 4.1% and 6.7%, respectively, through 2035.
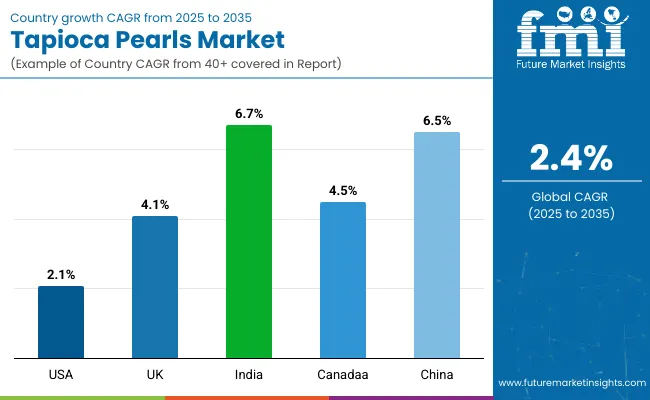
| Countries | CAGR, 2025 to 2035 |
|---|---|
| USA | 2.1% |
| UK | 4.1% |
| India | 6.7% |
In the market for tapioca pearls North America is anticipated to continue holding the second-largest share. the increase in demand for fruity drinks made with tea in the United States is anticipated to boost boba tea sales which will increase the size of the tapioca pearls market.
Another important factor that is expected to fuel growth is the growing number of bubble tea establishments throughout the United States which is a result of the growing demand from children and health-conscious populations. Starbucks for example declared that it is testing its own boba-style iced coffee in the United States. It is expected that these developments by the major tea and coffee shop chains will support the North American market.
India is expected to lead the Asia-Pacific tapioca pearls market share due to its growing production & sales of tapioca pearl-infused boba tea. Important companies in the nation are also concentrating on introducing novel flavors in their beverages in an effort to draw in more customers.
For example, the country saw the introduction of two new alcoholic beverages: VSOP Chocolate and Whiskey Oriental. Chocolate milk and Brandy VSOP are used to make the VSOP Chocolate. Coconut jelly boba and tiny bubbles can be added on top. Oriental Beauty Tea and whiskey are combined to make Whiskey Oriental. It is anticipated that the launch of additional distinctive beverages will boost the Indian market.
The desire for tapioca starch in common foods is being driven by a trend toward a healthier lifestyle meal from nations such as the UK The demand for tapioca starch is being increased. Europe is therefore anticipated to dominate the tapioca starch market in the UK and hold a market share of over 35% during the forecast period.
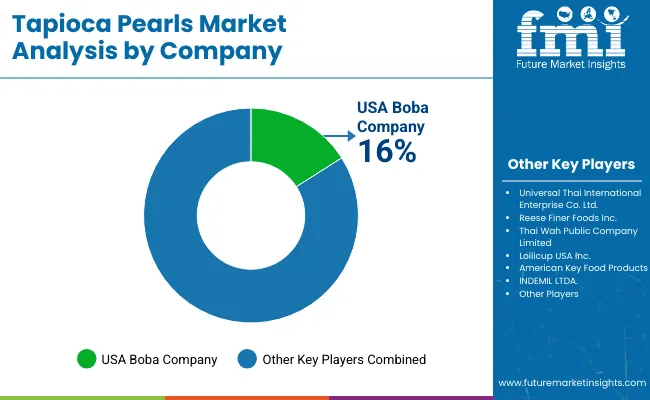
In order to meet the constantly rising demand from customers the majority of the top businesses are concentrating on increasing their manufacturing capabilities. By introducing cutting-edge goods for the food and beverage sector they are also attempting to obtain a competitive advantage. In the meantime, some other significant players are competing with their rivals through joint ventures collaborations and mergers and acquisitions.
Important players use strategic initiatives like partnerships mergers and new product developments. In order to launch innovative products and maintain a competitive edge business give priority to R&D. Agility and innovation define industry leaders in an environment where market presence is amplified by strong distribution networks and adherence to quality standards.
| Report Attributes | Details |
|---|---|
| Current Total Market Size (2025) | USD 4.88 billion |
| Projected Market Size (2035) | USD 6.31 billion |
| CAGR (2025 to 2035) | 2.4% |
| Base Year for Estimation | 2024 |
| Historical Period | 2020 to 2024 |
| Projections Period | 2025 to 2035 |
| Quantitative Units | USD billion for value and kilotons for volume |
| Sizes Analyzed (Segment 1) | Small (< 5 mm), Medium (5 mm to 8 mm), Large (> 8 mm) |
| End Uses Analyzed (Segment 2) | Industrial Processing, Desserts, Dairy Products, Bakery Products, Confectionery, Food service/HoReCa, Beverages, Household/Retail |
| Sales Channels Analyzed (Segment 3) | B2B/Direct, B2C/Indirect, Supermarkets/Hypermarkets, Grocery Stores, Specialty Stores, e-Retailer |
| Regions Covered | North America; Latin America; Western Europe; Eastern Europe; South Asia and Pacific; East Asia; Middle East & Africa |
| Countries Covered | United States, Canada, Mexico, Brazil, Argentina, Germany, France, United Kingdom, Italy, Spain, Netherlands, China, India, Japan, South Korea, ANZ, GCC Countries, South Africa |
| Key Players influencing the Tapioca Pearls Market | Universal Thai International Enterprise Co. Ltd., Reese Finer Foods Inc., US Boba Company, Thai Wah Public Company Limited, Lollicup USA Inc., American Key Food Products, INDEMIL LTDA. |
| Additional Attributes | Dollar sales by pearl size (small, medium, large), Beverage industry dominance in end-use, Functional advantages of tapioca in food processing, Regional preferences for tapioca texture and clarity, Boba and dessert trends in Asia-Pacific and North America, Growth in e-commerce and specialty retail channels |
| Customization and Pricing | Customization and Pricing Available on Request |
By size type industry has been categorized into Small (< 5 mm), Medium (5mm to 8 mm) and Large (> 8 mm)
By end-use industry has been categorized into Industrial Processing, Desserts, Dairy Products, Bakery Products, Confectionery, Food service/HoReCa, Beverages, and Household/Retail
By sales channel industry has been categorized into B2B/ Direct, B2C/ Indirect, Supermarkets /Hypermarkets, Grocery Stores, Specialty Store and e-Retailer
Industry analysis has been carried out in key countries of North America, Latin America, Europe, Middle East and Africa and Asia
The market is expected to grow at a CAGR of 2.4% throughout the forecast period.
By 2035, the sales value is expected to be worth USD 6.31 Billion.
Growing consumer preference for beverages is driving up demand for the market.
North America is expected to dominate the global consumption.
Some of the key players in manufacturing include Universal Thai International Enterprise Co. Ltd., Reese Finer Foods Inc., US Boba Company, Thai Wah Public Company Limited and more.


Full Research Suite comprises of:
Market outlook & trends analysis
Interviews & case studies
Strategic recommendations
Vendor profiles & capabilities analysis
5-year forecasts
8 regions and 60+ country-level data splits
Market segment data splits
12 months of continuous data updates
DELIVERED AS:
PDF EXCEL ONLINE
Tapioca Maltodextrin Market Analysis - Size, Share, and Forecast Outlook 2025 to 2035
Tapioca Market Trends - Starch Solutions & Global Demand 2025 to 2035
Granulated Tapioca Market Size and Share Forecast Outlook 2025 to 2035

Thank you!
You will receive an email from our Business Development Manager. Please be sure to check your SPAM/JUNK folder too.
Chat With
MaRIA