Reports

- Global Locations -

Headquarters

Future Market Insights, Inc.

Christiana Corporate, 200
Continental Drive, Suite 401,
Newark, Delaware - 19713,
United States

T: +1-845-579-5705

Americas

Future Market Insights, Inc.

616 Corporate Way, Suite 2-9018,
Valley Cottage, NY 10989, United States

T: +1-347-918-3531

MEA

Future Market Insights

1602-6 Jumeirah Bay X2 Tower, Plot No: JLT-PH2-X2A,
Jumeirah Lakes Towers, Dubai,
United Arab Emirates

Europe

Future Market Insights

3rd Floor, 207 Regent Street,
W1B 3HH London
United Kingdom

T: + 44 (0) 20 8123 9659
D: +44 (0) 20 3287 4268

Asia Pacific

Future Market Insights

IndiaLand Global Tech Park, Unit UG-1, Behind Grand HighStreet, Phase 1, Hinjawadi, MH, Pune – 411057, India

Granulated Tapioca Market Snapshot (2022-2032)

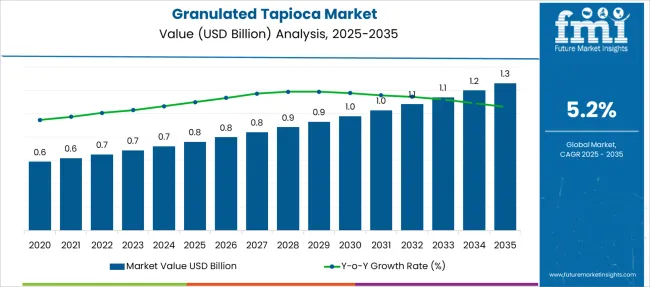
[250 Pages Report] The demand in the global granulated tapioca market is expected to expand at a CAGR of 4% to 5% during the forecast period 2022-2032. Rising emphasis of food manufacturers on improving the texture and enhancing the mouthfeel of the food & beverage products is estimated to accelerate the sales of granulated tapioca in the global market.

Report Attribute Details
Granulated Tapioca Market Projected Growth Rate (2022 to 2032) 4% to 5% CAGR

Tapioca is a starchy compound extracted from the storage roots of the yucca plant, commonly known as cassava roots, a plant species native to Brazil. Granulated tapioca is a white to cream-colored starchy granules that are available in different sizes.

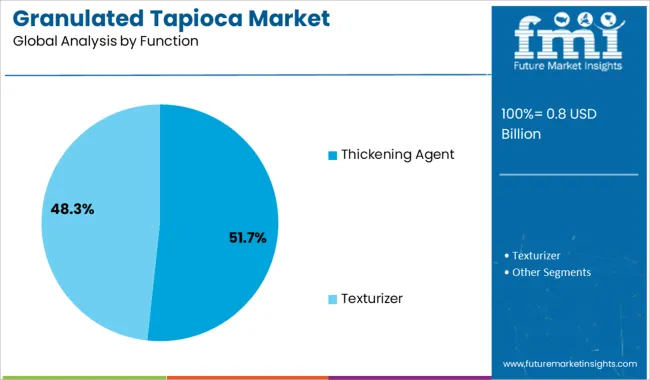
Granulated tapioca is finding a wide range of applications as a thickening agent and texturizer across the food & beverage industry. It is increasingly being used in preparing tapioca pudding and in thickening pie fillings, gravies, soups, stews, and others products. This is projected to augment the demand in the global market.

Don't pay for what you don't need

Customize your report by selecting specific countries or regions and save 30%!

What are Prominent Drivers Spearheading the Sales of Granulated Tapioca in Global Market?

Due to the growing adoption of sundry lifestyles and changing eating habits, there is a swift rise in prevalence of intolerance related to the consumption of gluten and condition such as non-celiac gluten sensitivity (NCGS), and celiac disease.

For instance, according to the American Academy of Allergy Asthma & Immunology, nearly 1% to 4% of the population across the world are reported to be suffering from celiac disease, an autoimmune disorder of the small intestine triggered by gluten. This rise in burden of such conditions is anticipated to augment the adoption of gluten-based product alternatives such as granulated tapioca, thereby bolstering the sales in the global market.

Also, increasing demand for high fiber compounds such as cassava extract’s across the dietary sector, owing to their effectiveness in preventing constipation, reducing the cholesterol level, and maintaining blood sugar levels is expected to further favor the sales of granulated tapioca.

Which are the Restraints Dampening the Growth in the Global Granulated Tapioca Market?

Growing awareness about to the excess intake of carbohydrates and declination in consumption of pie fillings, pudding, desserts, candies, and others, owing to the rising health concerns and increasing obese population is hindering the sales of granulated tapioca.

Also, risk of cyanide poisoning, due to the presence of a toxic compound called linamarin, present in cassava roots and side effects such as diarrhea, bloating, and nausea associated with the consumption of tapioca is hampering the growth in the global market.

Nandini Roy Choudhury

Principal Consultant

Talk to Analyst

Find your sweet spots for generating winning opportunities in this market.

Why is Sales of Granulated Tapioca Rising at a Rapid Pace in the South Asia Market?

South Asia is estimated to emerge as a highly remunerative market for granulated tapioca from 2022 to 2032, reveals Future Market Insights.

In the past couple of years, a swift rise in the number of baby births is being witnessed across South Asia, boosting the demand for baby food and nutritional supplements. For instance, according to the United Nations International Children's Emergency Fund (UNICEF), approximately 67,385 babies are reported to be born each day in India.

Granulated tapioca is extensively used as bodying and thickening agent in a plethora of commercially produced infant nutritional supplements and baby food products. Hence, growing baby births are projected to soar the demand for granulated tapioca in the South Asia market.
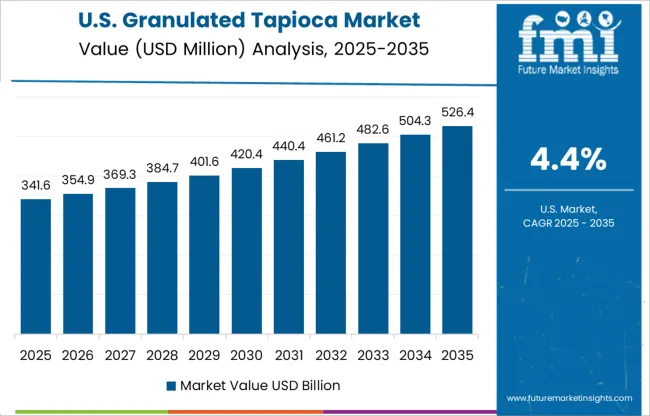
What is the Growth Prospect for the Granulated Tapioca Market in North America?

As per a study by FMI, North America is anticipated to account for a significant share in the global granulated tapioca market from 2022 to 2032. 

Growing customer preference towards adopting plant-based ingredients for preparation of food & beverage products and rising consumption of thick gravies, soups, pie, pudding, and others are fueling the demand for tapioca products. Hence, key players are focusing on launching new products to cater to this demand.

For instance, in 2020, Kauffman's Fruit Farm, a U.S.-based producer of tapioca products announced introducing Granulated Minute Tapioca in 2-pound packaging. A slew of such product launches is expected to bolster the growth in the North America market.
Get the data you need at a Fraction of the cost

Personalize your report by choosing insights you need
and save 40%!

Market Competition

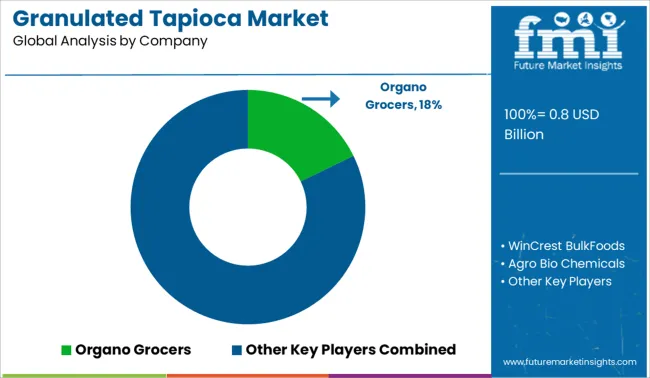
Some of the leading players in the granulated tapioca market are Edward and Sons, WinCrest BulkFoods, COMBRASIL, Amafil, YOKI, Red Hill General Stores, Inc., Larissa Veronica, Kauffman's Fruit Farm, Choice Tropical, LLC, Varies, Pa Dutch Food & Candy Company, and others.

Key manufacturers are aiming at launching new products in different size packaging and expanding their production capacity to strengthen their foothold in the highly competitive granulated tapioca market.

Report Scope

Report Attribute Details
Growth Rate CAGR of 4% to 5% from 2022 to 2032
Base Year for Estimation 2021
Historical Data 2015 to 2020
Forecast Period 2022 to 2032
Quantitative Units Revenue in USD Million and CAGR from 2022 to 2032
Report Coverage Revenue Forecast, Volume Forecast, Company Ranking, Competitive Landscape, Growth Factors, Trends and Pricing Analysis
Segments Covered
  • Nature
  • Packaging
  • Function
  • Application
  • Distribution Channel
  • Region
Countries Covered
  • North America
  • Latin America
  • Europe
  • East Asia
  • South Asia
  • Oceania
  • Middle East and Africa
Key Companies Profiled
  • Edward and Sons
  • WinCrest BulkFoods
  • COMBRASIL
  • Amafil
  • YOKI
  • Red Hill General Stores, Inc.
  • Larissa Veronica
  • Kauffman's Fruit Farm
  • Choice Tropical, LLC
  • Varies
  • Pa Dutch Food & Candy Company
  • Others
Customization Available Upon Request

Key Segments Profiled in the Granulated Tapioca Market Survey

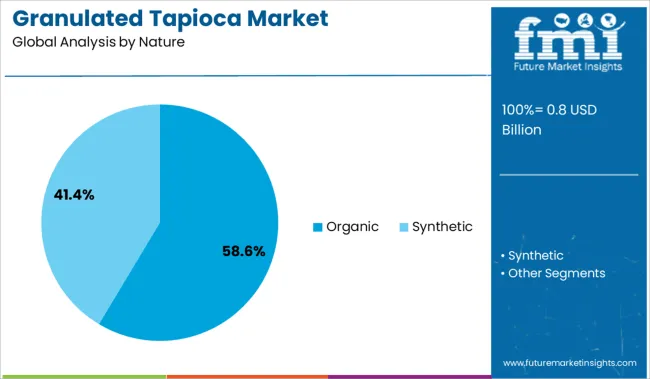
By Nature:

  • Organic
  • Synthetic

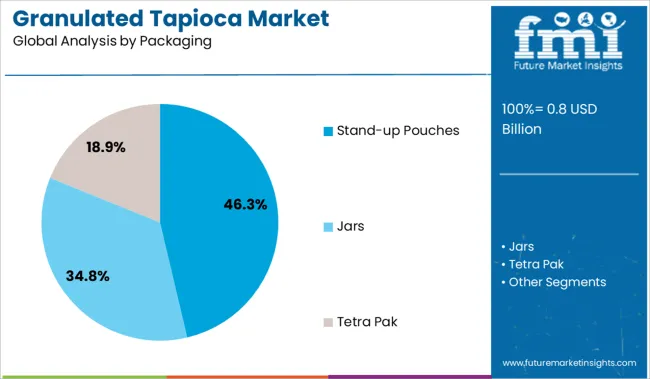
By Packaging:

  • Stand-up Pouches
  • Jars
  • Tetra Pak

By Function:

  • Thickening Agent
  • Texturizer

By Application:

  • Pudding
  • Bubble Gum
  • Tea
  • Candies and Desserts
  • Soups and Gravies
  • Pie Fillings
  • Sweet Soups
  • Others

By Distribution Channel:

  • Direct Sales (B2B)
  • Indirect Sales (B2C)
  • Hypermarkets/ Supermarkets
  • Online Stores
  • Specialty Stores
  • Other Retailers

By Region:

  • North America
  • Latin America
  • Europe
  • East Asia
  • South Asia
  • Oceania
  • Middle East and Africa

Frequently Asked Questions

What is the sales forecast for granulated tapioca in the global market until 2032?

FMI projects the sales of granulated tapioca in the market is expected to rise at 4% to 5% value CAGR by 2032.

Which region is forecast to be the most lucrative for granulated tapioca market growth?

The global granulated tapioca market is expected to be dominated by South Asia over the forecast period 2022-2032.

Which are some leading granulated tapioca manufacturers?

Edward and Sons, WinCrest BulkFoods, COMBRASIL, Amafil, YOKI, Red Hill General Stores, Inc., Larissa Veronica, Kauffman's Fruit Farm, Choice Tropical, LLC, Varies, Pa Dutch Food & Candy Company, and others are some of the leading players in the prominent granulated tapioca market.

Table of Content

1. Executive Summary

    1.1. Global Market Outlook

    1.2. Demand-side Trends

    1.3. Supply-side Trends

    1.4. Technology Roadmap Analysis

    1.5. Analysis and Recommendations

2. Market Overview

    2.1. Market Coverage / Taxonomy

    2.2. Market Definition / Scope / Limitations

3. Market Background

    3.1. Market Dynamics

        3.1.1. Drivers

        3.1.2. Restraints

        3.1.3. Opportunity

        3.1.4. Trends

    3.2. Scenario Forecast

        3.2.1. Demand in Optimistic Scenario

        3.2.2. Demand in Likely Scenario

        3.2.3. Demand in Conservative Scenario

    3.3. Opportunity Map Analysis

    3.4. Product Life Cycle Analysis

    3.5. Supply Chain Analysis

        3.5.1. Supply Side Participants and their Roles

            3.5.1.1. Producers

            3.5.1.2. Mid-Level Participants (Traders/ Agents/ Brokers)

            3.5.1.3. Wholesalers and Distributors

        3.5.2. Value Added and Value Created at Node in the Supply Chain

        3.5.3. List of Raw Material Suppliers

        3.5.4. List of Existing and Potential Buyer’s

    3.6. Investment Feasibility Matrix

    3.7. Value Chain Analysis

        3.7.1. Profit Margin Analysis

        3.7.2. Wholesalers and Distributors

        3.7.3. Retailers

    3.8. PESTLE and Porter’s Analysis

    3.9. Regulatory Landscape

        3.9.1. By Key Regions

        3.9.2. By Key Countries

    3.10. Regional Parent Market Outlook

    3.11. Production and Consumption Statistics

    3.12. Import and Export Statistics

4. Global Granulated Tapioca Market Analysis 2017-2021 and Forecast, 2022-2032

    4.1. Historical Market Size Value (US$ Mn) & Volume (MT) Analysis, 2017-2021

    4.2. Current and Future Market Size Value (US$ Mn) & Volume (MT) Projections, 2022-2032

        4.2.1. Y-o-Y Growth Trend Analysis

        4.2.2. Absolute $ Opportunity Analysis

5. Global Granulated Tapioca Market Analysis 2017-2021 and Forecast 2022-2032, By Nature

    5.1. Introduction / Key Findings

    5.2. Historical Market Size Value (US$ Mn) & Volume (MT) Analysis By Nature, 2017-2021

    5.3. Current and Future Market Size Value (US$ Mn) & Volume (MT) Analysis and Forecast By Nature, 2022-2032

        5.3.1. Organic

        5.3.2. Synthetic

        5.3.3. Vegan

    5.4. Y-o-Y Growth Trend Analysis By Nature, 2017-2021

    5.5. Absolute $ Opportunity Analysis By Nature, 2022-2032

Deep-dive segmentation will be available in the sample on request

6. Global Granulated Tapioca Market Analysis 2017-2021 and Forecast 2022-2032, By Application

    6.1. Introduction / Key Findings

    6.2. Historical Market Size Value (US$ Mn) & Volume (MT) Analysis By Application, 2017-2021

    6.3. Current and Future Market Size Value (US$ Mn) & Volume (MT) Analysis and Forecast By Application, 2022-2032

        6.3.1. Food Manufacturing

        6.3.2. Bakery & Confectionary

        6.3.3. Animal Feed

        6.3.4. Pharmacy

    6.4. Y-o-Y Growth Trend Analysis By Application, 2017-2021

    6.5. Absolute $ Opportunity Analysis By Application, 2022-2032

Deep-dive segmentation will be available in the sample on request

7. Global Granulated Tapioca Market Analysis 2017-2021 and Forecast 2022-2032, By Function

    7.1. Introduction / Key Findings

    7.2. Historical Market Size Value (US$ Mn) & Volume (MT) Analysis By Function, 2017-2021

    7.3. Current and Future Market Size Value (US$ Mn) & Volume (MT) Analysis and Forecast By Function, 2022-2032

        7.3.1. Thickening Agent

        7.3.2. Texturizer

        7.3.3. Stabilizer

    7.4. Y-o-Y Growth Trend Analysis By Function, 2017-2021

    7.5. Absolute $ Opportunity Analysis By Function, 2022-2032

Deep-dive segmentation will be available in the sample on request

8. Global Granulated Tapioca Market Analysis 2017-2021 and Forecast 2022-2032, By Packaging

    8.1. Introduction / Key Findings

    8.2. Historical Market Size Value (US$ Mn) & Volume (MT) Analysis By Packaging, 2017-2021

    8.3. Current and Future Market Size Value (US$ Mn) & Volume (MT) Analysis and Forecast By Packaging, 2022-2032

        8.3.1. Stand-up Pouches

        8.3.2. Jars

        8.3.3. Tetra Pak

    8.4. Y-o-Y Growth Trend Analysis By Packaging, 2017-2021

    8.5. Absolute $ Opportunity Analysis By Packaging, 2022-2032

Deep-dive segmentation will be available in the sample on request

9. Global Granulated Tapioca Market Analysis 2017-2021 and Forecast 2022-2032, By Distribution Channel

    9.1. Introduction / Key Findings

    9.2. Historical Market Size Value (US$ Mn) & Volume (MT) Analysis By Distribution Channel, 2017-2021

    9.3. Current and Future Market Size Value (US$ Mn) & Volume (MT) Analysis and Forecast By Distribution Channel, 2022-2032

        9.3.1. Direct Sales

        9.3.2. Indirect Sales

    9.4. Y-o-Y Growth Trend Analysis By Distribution Channel, 2017-2021

    9.5. Absolute $ Opportunity Analysis By Distribution Channel, 2022-2032

Deep-dive segmentation will be available in the sample on request

10. Global Granulated Tapioca Market Analysis 2017-2021 and Forecast 2022-2032, By Region

    10.1. Introduction

    10.2. Historical Market Size Value (US$ Mn) & Volume (MT) Analysis By Region, 2017-2021

    10.3. Current Market Size Value (US$ Mn) & Volume (MT) Analysis and Forecast By Region, 2022-2032

        10.3.1. North America

        10.3.2. Latin America

        10.3.3. Europe

        10.3.4. East Asia

        10.3.5. South Asia & Pacific

        10.3.6. MEA

    10.4. Market Attractiveness Analysis By Region

11. North America Granulated Tapioca Market Analysis 2017-2021 and Forecast 2022-2032, By Country

    11.1. Historical Market Size Value (US$ Mn) & Volume (MT) Trend Analysis By Market Taxonomy, 2017-2021

    11.2. Market Size Value (US$ Mn) & Volume (MT) Forecast By Market Taxonomy, 2022-2032

        11.2.1. By Country

            11.2.1.1. U.S.

            11.2.1.2. Canada

        11.2.2. By Nature

        11.2.3. By Application

        11.2.4. By Function

        11.2.5. By Packaging

        11.2.6. By Distribution Channel

    11.3. Market Attractiveness Analysis

        11.3.1. By Country

        11.3.2. By Nature

        11.3.3. By Application

        11.3.4. By Function

        11.3.5. By Packaging

        11.3.6. By Distribution Channel

    11.4. Key Takeaways

12. Latin America Granulated Tapioca Market Analysis 2017-2021 and Forecast 2022-2032, By Country

    12.1. Historical Market Size Value (US$ Mn) & Volume (MT) Trend Analysis By Market Taxonomy, 2017-2021

    12.2. Market Size Value (US$ Mn) & Volume (MT) Forecast By Market Taxonomy, 2022-2032

        12.2.1. By Country

            12.2.1.1. Brazil

            12.2.1.2. Mexico

            12.2.1.3. Rest of Latin America

        12.2.2. By Nature

        12.2.3. By Application

        12.2.4. By Function

        12.2.5. By Packaging

        12.2.6. By Distribution Channel

    12.3. Market Attractiveness Analysis

        12.3.1. By Country

        12.3.2. By Nature

        12.3.3. By Application

        12.3.4. By Function

        12.3.5. By Packaging

        12.3.6. By Distribution Channel

    12.4. Key Takeaways

13. Europe Granulated Tapioca Market Analysis 2017-2021 and Forecast 2022-2032, By Country

    13.1. Historical Market Size Value (US$ Mn) & Volume (MT) Trend Analysis By Market Taxonomy, 2017-2021

    13.2. Market Size Value (US$ Mn) & Volume (MT) Forecast By Market Taxonomy, 2022-2032

        13.2.1. By Country

            13.2.1.1. Germany

            13.2.1.2. U.K.

            13.2.1.3. France

            13.2.1.4. Spain

            13.2.1.5. Italy

            13.2.1.6. Rest of Europe

        13.2.2. By Nature

        13.2.3. By Application

        13.2.4. By Function

        13.2.5. By Packaging

        13.2.6. By Distribution Channel

    13.3. Market Attractiveness Analysis

        13.3.1. By Country

        13.3.2. By Nature

        13.3.3. By Application

        13.3.4. By Function

        13.3.5. By Packaging

        13.3.6. By Distribution Channel

    13.4. Key Takeaways

14. East Asia Granulated Tapioca Market Analysis 2017-2021 and Forecast 2022-2032, By Country

    14.1. Historical Market Size Value (US$ Mn) & Volume (MT) Trend Analysis By Market Taxonomy, 2017-2021

    14.2. Market Size Value (US$ Mn) & Volume (MT) Forecast By Market Taxonomy, 2022-2032

        14.2.1. By Country

            14.2.1.1. China

            14.2.1.2. Japan

            14.2.1.3. South Korea

        14.2.2. By Nature

        14.2.3. By Application

        14.2.4. By Function

        14.2.5. By Packaging

        14.2.6. By Distribution Channel

    14.3. Market Attractiveness Analysis

        14.3.1. By Country

        14.3.2. By Nature

        14.3.3. By Application

        14.3.4. By Function

        14.3.5. By Packaging

        14.3.6. By Distribution Channel

    14.4. Key Takeaways

15. South Asia & Pacific Granulated Tapioca Market Analysis 2017-2021 and Forecast 2022-2032, By Country

    15.1. Historical Market Size Value (US$ Mn) & Volume (MT) Trend Analysis By Market Taxonomy, 2017-2021

    15.2. Market Size Value (US$ Mn) & Volume (MT) Forecast By Market Taxonomy, 2022-2032

        15.2.1. By Country

            15.2.1.1. India

            15.2.1.2. Thailand

            15.2.1.3. Indonesia

            15.2.1.4. Malaysia

            15.2.1.5. Singapore

            15.2.1.6. Australia

            15.2.1.7. New Zealand

            15.2.1.8. Rest of South Asia & Pacific

        15.2.2. By Nature

        15.2.3. By Application

        15.2.4. By Function

        15.2.5. By Packaging

        15.2.6. By Distribution Channel

    15.3. Market Attractiveness Analysis

        15.3.1. By Country

        15.3.2. By Nature

        15.3.3. By Application

        15.3.4. By Function

        15.3.5. By Packaging

        15.3.6. By Distribution Channel

    15.4. Key Takeaways

16. MEA Granulated Tapioca Market Analysis 2017-2021 and Forecast 2022-2032, By Country

    16.1. Historical Market Size Value (US$ Mn) & Volume (MT) Trend Analysis By Market Taxonomy, 2017-2021

    16.2. Market Size Value (US$ Mn) & Volume (MT) Forecast By Market Taxonomy, 2022-2032

        16.2.1. By Country

            16.2.1.1. GCC Countries

            16.2.1.2. South Africa

            16.2.1.3. Israel

            16.2.1.4. Rest of MEA

        16.2.2. By Nature

        16.2.3. By Application

        16.2.4. By Function

        16.2.5. By Packaging

        16.2.6. By Distribution Channel

    16.3. Market Attractiveness Analysis

        16.3.1. By Country

        16.3.2. By Nature

        16.3.3. By Application

        16.3.4. By Function

        16.3.5. By Packaging

        16.3.6. By Distribution Channel

    16.4. Key Takeaways

17. Key Countries Granulated Tapioca Market Analysis

    17.1. U.S.

        17.1.1. Pricing Analysis

        17.1.2. Market Share Analysis, 2021

            17.1.2.1. By Nature

            17.1.2.2. By Application

            17.1.2.3. By Function

            17.1.2.4. By Packaging

            17.1.2.5. By Distribution Channel

    17.2. Canada

        17.2.1. Pricing Analysis

        17.2.2. Market Share Analysis, 2021

            17.2.2.1. By Nature

            17.2.2.2. By Application

            17.2.2.3. By Function

            17.2.2.4. By Packaging

            17.2.2.5. By Distribution Channel

    17.3. Brazil

        17.3.1. Pricing Analysis

        17.3.2. Market Share Analysis, 2021

            17.3.2.1. By Nature

            17.3.2.2. By Application

            17.3.2.3. By Function

            17.3.2.4. By Packaging

            17.3.2.5. By Distribution Channel

    17.4. Mexico

        17.4.1. Pricing Analysis

        17.4.2. Market Share Analysis, 2021

            17.4.2.1. By Nature

            17.4.2.2. By Application

            17.4.2.3. By Function

            17.4.2.4. By Packaging

            17.4.2.5. By Distribution Channel

    17.5. Germany

        17.5.1. Pricing Analysis

        17.5.2. Market Share Analysis, 2021

            17.5.2.1. By Nature

            17.5.2.2. By Application

            17.5.2.3. By Function

            17.5.2.4. By Packaging

            17.5.2.5. By Distribution Channel

    17.6. U.K.

        17.6.1. Pricing Analysis

        17.6.2. Market Share Analysis, 2021

            17.6.2.1. By Nature

            17.6.2.2. By Application

            17.6.2.3. By Function

            17.6.2.4. By Packaging

            17.6.2.5. By Distribution Channel

    17.7. France

        17.7.1. Pricing Analysis

        17.7.2. Market Share Analysis, 2021

            17.7.2.1. By Nature

            17.7.2.2. By Application

            17.7.2.3. By Function

            17.7.2.4. By Packaging

            17.7.2.5. By Distribution Channel

    17.8. Spain

        17.8.1. Pricing Analysis

        17.8.2. Market Share Analysis, 2021

            17.8.2.1. By Nature

            17.8.2.2. By Application

            17.8.2.3. By Function

            17.8.2.4. By Packaging

            17.8.2.5. By Distribution Channel

    17.9. Italy

        17.9.1. Pricing Analysis

        17.9.2. Market Share Analysis, 2021

            17.9.2.1. By Nature

            17.9.2.2. By Application

            17.9.2.3. By Function

            17.9.2.4. By Packaging

            17.9.2.5. By Distribution Channel

    17.10. China

        17.10.1. Pricing Analysis

        17.10.2. Market Share Analysis, 2021

            17.10.2.1. By Nature

            17.10.2.2. By Application

            17.10.2.3. By Function

            17.10.2.4. By Packaging

            17.10.2.5. By Distribution Channel

    17.11. Japan

        17.11.1. Pricing Analysis

        17.11.2. Market Share Analysis, 2021

            17.11.2.1. By Nature

            17.11.2.2. By Application

            17.11.2.3. By Function

            17.11.2.4. By Packaging

            17.11.2.5. By Distribution Channel

    17.12. South Korea

        17.12.1. Pricing Analysis

        17.12.2. Market Share Analysis, 2021

            17.12.2.1. By Nature

            17.12.2.2. By Application

            17.12.2.3. By Function

            17.12.2.4. By Packaging

            17.12.2.5. By Distribution Channel

    17.13. India

        17.13.1. Pricing Analysis

        17.13.2. Market Share Analysis, 2021

            17.13.2.1. By Nature

            17.13.2.2. By Application

            17.13.2.3. By Function

            17.13.2.4. By Packaging

            17.13.2.5. By Distribution Channel

    17.14. Thailand

        17.14.1. Pricing Analysis

        17.14.2. Market Share Analysis, 2021

            17.14.2.1. By Nature

            17.14.2.2. By Application

            17.14.2.3. By Function

            17.14.2.4. By Packaging

            17.14.2.5. By Distribution Channel

    17.15. Indonesia

        17.15.1. Pricing Analysis

        17.15.2. Market Share Analysis, 2021

            17.15.2.1. By Nature

            17.15.2.2. By Application

            17.15.2.3. By Function

            17.15.2.4. By Packaging

            17.15.2.5. By Distribution Channel

    17.16. Malaysia

        17.16.1. Pricing Analysis

        17.16.2. Market Share Analysis, 2021

            17.16.2.1. By Nature

            17.16.2.2. By Application

            17.16.2.3. By Function

            17.16.2.4. By Packaging

            17.16.2.5. By Distribution Channel

    17.17. Singapore

        17.17.1. Pricing Analysis

        17.17.2. Market Share Analysis, 2021

            17.17.2.1. By Nature

            17.17.2.2. By Application

            17.17.2.3. By Function

            17.17.2.4. By Packaging

            17.17.2.5. By Distribution Channel

    17.18. Australia

        17.18.1. Pricing Analysis

        17.18.2. Market Share Analysis, 2021

            17.18.2.1. By Nature

            17.18.2.2. By Application

            17.18.2.3. By Function

            17.18.2.4. By Packaging

            17.18.2.5. By Distribution Channel

    17.19. New Zealand

        17.19.1. Pricing Analysis

        17.19.2. Market Share Analysis, 2021

            17.19.2.1. By Nature

            17.19.2.2. By Application

            17.19.2.3. By Function

            17.19.2.4. By Packaging

            17.19.2.5. By Distribution Channel

    17.20. GCC Countries

        17.20.1. Pricing Analysis

        17.20.2. Market Share Analysis, 2021

            17.20.2.1. By Nature

            17.20.2.2. By Application

            17.20.2.3. By Function

            17.20.2.4. By Packaging

            17.20.2.5. By Distribution Channel

    17.21. South Africa

        17.21.1. Pricing Analysis

        17.21.2. Market Share Analysis, 2021

            17.21.2.1. By Nature

            17.21.2.2. By Application

            17.21.2.3. By Function

            17.21.2.4. By Packaging

            17.21.2.5. By Distribution Channel

    17.22. Israel

        17.22.1. Pricing Analysis

        17.22.2. Market Share Analysis, 2021

            17.22.2.1. By Nature

            17.22.2.2. By Application

            17.22.2.3. By Function

            17.22.2.4. By Packaging

            17.22.2.5. By Distribution Channel

18. Market Structure Analysis

    18.1. Competition Dashboard

    18.2. Competition Benchmarking

    18.3. Market Share Analysis of Top Players

        18.3.1. By Regional

        18.3.2. By Nature

        18.3.3. By Application

        18.3.4. By Function

        18.3.5. By Packaging

        18.3.6. By Distribution Channel

19. Competition Analysis

    19.1. Competition Deep Dive

        19.1.1. Organo Grocers

            19.1.1.1. Overview

            19.1.1.2. Product Portfolio

            19.1.1.3. Profitability by Market Segments

            19.1.1.4. Sales Footprint

            19.1.1.5. Strategy Overview

                19.1.1.5.1. Marketing Strategy

                19.1.1.5.2. Product Strategy

                19.1.1.5.3. Channel Strategy

        19.1.2. WinCrest BulkFoods

            19.1.2.1. Overview

            19.1.2.2. Product Portfolio

            19.1.2.3. Profitability by Market Segments

            19.1.2.4. Sales Footprint

            19.1.2.5. Strategy Overview

                19.1.2.5.1. Marketing Strategy

                19.1.2.5.2. Product Strategy

                19.1.2.5.3. Channel Strategy

        19.1.3. Agro Bio Chemicals

            19.1.3.1. Overview

            19.1.3.2. Product Portfolio

            19.1.3.3. Profitability by Market Segments

            19.1.3.4. Sales Footprint

            19.1.3.5. Strategy Overview

                19.1.3.5.1. Marketing Strategy

                19.1.3.5.2. Product Strategy

                19.1.3.5.3. Channel Strategy

        19.1.4. American key food Products

            19.1.4.1. Overview

            19.1.4.2. Product Portfolio

            19.1.4.3. Profitability by Market Segments

            19.1.4.4. Sales Footprint

            19.1.4.5. Strategy Overview

                19.1.4.5.1. Marketing Strategy

                19.1.4.5.2. Product Strategy

                19.1.4.5.3. Channel Strategy

        19.1.5. Kauffman's Fruit Farm

            19.1.5.1. Overview

            19.1.5.2. Product Portfolio

            19.1.5.3. Profitability by Market Segments

            19.1.5.4. Sales Footprint

            19.1.5.5. Strategy Overview

                19.1.5.5.1. Marketing Strategy

                19.1.5.5.2. Product Strategy

                19.1.5.5.3. Channel Strategy

        19.1.6. Lets Do Organic

            19.1.6.1. Overview

            19.1.6.2. Product Portfolio

            19.1.6.3. Profitability by Market Segments

            19.1.6.4. Sales Footprint

            19.1.6.5. Strategy Overview

                19.1.6.5.1. Marketing Strategy

                19.1.6.5.2. Product Strategy

                19.1.6.5.3. Channel Strategy

        19.1.7. Reese

            19.1.7.1. Overview

            19.1.7.2. Product Portfolio

            19.1.7.3. Profitability by Market Segments

            19.1.7.4. Sales Footprint

            19.1.7.5. Strategy Overview

                19.1.7.5.1. Marketing Strategy

                19.1.7.5.2. Product Strategy

                19.1.7.5.3. Channel Strategy

        19.1.8. COMBRASIL

            19.1.8.1. Overview

            19.1.8.2. Product Portfolio

            19.1.8.3. Profitability by Market Segments

            19.1.8.4. Sales Footprint

            19.1.8.5. Strategy Overview

                19.1.8.5.1. Marketing Strategy

                19.1.8.5.2. Product Strategy

                19.1.8.5.3. Channel Strategy

        19.1.9. Choice Tropical, LLC

            19.1.9.1. Overview

            19.1.9.2. Product Portfolio

            19.1.9.3. Profitability by Market Segments

            19.1.9.4. Sales Footprint

            19.1.9.5. Strategy Overview

                19.1.9.5.1. Marketing Strategy

                19.1.9.5.2. Product Strategy

                19.1.9.5.3. Channel Strategy

        19.1.10. Edward and Sons

            19.1.10.1. Overview

            19.1.10.2. Product Portfolio

            19.1.10.3. Profitability by Market Segments

            19.1.10.4. Sales Footprint

            19.1.10.5. Strategy Overview

                19.1.10.5.1. Marketing Strategy

                19.1.10.5.2. Product Strategy

                19.1.10.5.3. Channel Strategy

        19.1.11. Red Hill General Stores, Inc.

            19.1.11.1. Overview

            19.1.11.2. Product Portfolio

            19.1.11.3. Profitability by Market Segments

            19.1.11.4. Sales Footprint

            19.1.11.5. Strategy Overview

                19.1.11.5.1. Marketing Strategy

                19.1.11.5.2. Product Strategy

                19.1.11.5.3. Channel Strategy

        19.1.12. Tasty Nibbles

            19.1.12.1. Overview

            19.1.12.2. Product Portfolio

            19.1.12.3. Profitability by Market Segments

            19.1.12.4. Sales Footprint

            19.1.12.5. Strategy Overview

                19.1.12.5.1. Marketing Strategy

                19.1.12.5.2. Product Strategy

                19.1.12.5.3. Channel Strategy

20. Assumptions & Acronyms Used

21. Research Methodology

Don't pay for what you don't need

Customize your report by selecting specific countries or regions and save 30%!

List of Tables

Table 1: Global Granulated Tapioca Market Value (US$ Mn) Forecast by Region, 2017-2032

Table 2: Global Granulated Tapioca Market Volume (MT) Forecast by Region, 2017-2032

Table 3: Global Granulated Tapioca Market Value (US$ Mn) Forecast by Nature, 2017-2032

Table 4: Global Granulated Tapioca Market Volume (MT) Forecast by Nature, 2017-2032

Table 5: Global Granulated Tapioca Market Value (US$ Mn) Forecast by Application, 2017-2032

Table 6: Global Granulated Tapioca Market Volume (MT) Forecast by Application, 2017-2032

Table 7: Global Granulated Tapioca Market Value (US$ Mn) Forecast by Function, 2017-2032

Table 8: Global Granulated Tapioca Market Volume (MT) Forecast by Function, 2017-2032

Table 9: Global Granulated Tapioca Market Value (US$ Mn) Forecast by Packaging, 2017-2032

Table 10: Global Granulated Tapioca Market Volume (MT) Forecast by Packaging, 2017-2032

Table 11: Global Granulated Tapioca Market Value (US$ Mn) Forecast by Distribution Channel, 2017-2032

Table 12: Global Granulated Tapioca Market Volume (MT) Forecast by Distribution Channel, 2017-2032

Table 13: North America Granulated Tapioca Market Value (US$ Mn) Forecast by Country, 2017-2032

Table 14: North America Granulated Tapioca Market Volume (MT) Forecast by Country, 2017-2032

Table 15: North America Granulated Tapioca Market Value (US$ Mn) Forecast by Nature, 2017-2032

Table 16: North America Granulated Tapioca Market Volume (MT) Forecast by Nature, 2017-2032

Table 17: North America Granulated Tapioca Market Value (US$ Mn) Forecast by Application, 2017-2032

Table 18: North America Granulated Tapioca Market Volume (MT) Forecast by Application, 2017-2032

Table 19: North America Granulated Tapioca Market Value (US$ Mn) Forecast by Function, 2017-2032

Table 20: North America Granulated Tapioca Market Volume (MT) Forecast by Function, 2017-2032

Table 21: North America Granulated Tapioca Market Value (US$ Mn) Forecast by Packaging, 2017-2032

Table 22: North America Granulated Tapioca Market Volume (MT) Forecast by Packaging, 2017-2032

Table 23: North America Granulated Tapioca Market Value (US$ Mn) Forecast by Distribution Channel, 2017-2032

Table 24: North America Granulated Tapioca Market Volume (MT) Forecast by Distribution Channel, 2017-2032

Table 25: Latin America Granulated Tapioca Market Value (US$ Mn) Forecast by Country, 2017-2032

Table 26: Latin America Granulated Tapioca Market Volume (MT) Forecast by Country, 2017-2032

Table 27: Latin America Granulated Tapioca Market Value (US$ Mn) Forecast by Nature, 2017-2032

Table 28: Latin America Granulated Tapioca Market Volume (MT) Forecast by Nature, 2017-2032

Table 29: Latin America Granulated Tapioca Market Value (US$ Mn) Forecast by Application, 2017-2032

Table 30: Latin America Granulated Tapioca Market Volume (MT) Forecast by Application, 2017-2032

Table 31: Latin America Granulated Tapioca Market Value (US$ Mn) Forecast by Function, 2017-2032

Table 32: Latin America Granulated Tapioca Market Volume (MT) Forecast by Function, 2017-2032

Table 33: Latin America Granulated Tapioca Market Value (US$ Mn) Forecast by Packaging, 2017-2032

Table 34: Latin America Granulated Tapioca Market Volume (MT) Forecast by Packaging, 2017-2032

Table 35: Latin America Granulated Tapioca Market Value (US$ Mn) Forecast by Distribution Channel, 2017-2032

Table 36: Latin America Granulated Tapioca Market Volume (MT) Forecast by Distribution Channel, 2017-2032

Table 37: Europe Granulated Tapioca Market Value (US$ Mn) Forecast by Country, 2017-2032

Table 38: Europe Granulated Tapioca Market Volume (MT) Forecast by Country, 2017-2032

Table 39: Europe Granulated Tapioca Market Value (US$ Mn) Forecast by Nature, 2017-2032

Table 40: Europe Granulated Tapioca Market Volume (MT) Forecast by Nature, 2017-2032

Table 41: Europe Granulated Tapioca Market Value (US$ Mn) Forecast by Application, 2017-2032

Table 42: Europe Granulated Tapioca Market Volume (MT) Forecast by Application, 2017-2032

Table 43: Europe Granulated Tapioca Market Value (US$ Mn) Forecast by Function, 2017-2032

Table 44: Europe Granulated Tapioca Market Volume (MT) Forecast by Function, 2017-2032

Table 45: Europe Granulated Tapioca Market Value (US$ Mn) Forecast by Packaging, 2017-2032

Table 46: Europe Granulated Tapioca Market Volume (MT) Forecast by Packaging, 2017-2032

Table 47: Europe Granulated Tapioca Market Value (US$ Mn) Forecast by Distribution Channel, 2017-2032

Table 48: Europe Granulated Tapioca Market Volume (MT) Forecast by Distribution Channel, 2017-2032

Table 49: East Asia Granulated Tapioca Market Value (US$ Mn) Forecast by Country, 2017-2032

Table 50: East Asia Granulated Tapioca Market Volume (MT) Forecast by Country, 2017-2032

Table 51: East Asia Granulated Tapioca Market Value (US$ Mn) Forecast by Nature, 2017-2032

Table 52: East Asia Granulated Tapioca Market Volume (MT) Forecast by Nature, 2017-2032

Table 53: East Asia Granulated Tapioca Market Value (US$ Mn) Forecast by Application, 2017-2032

Table 54: East Asia Granulated Tapioca Market Volume (MT) Forecast by Application, 2017-2032

Table 55: East Asia Granulated Tapioca Market Value (US$ Mn) Forecast by Function, 2017-2032

Table 56: East Asia Granulated Tapioca Market Volume (MT) Forecast by Function, 2017-2032

Table 57: East Asia Granulated Tapioca Market Value (US$ Mn) Forecast by Packaging, 2017-2032

Table 58: East Asia Granulated Tapioca Market Volume (MT) Forecast by Packaging, 2017-2032

Table 59: East Asia Granulated Tapioca Market Value (US$ Mn) Forecast by Distribution Channel, 2017-2032

Table 60: East Asia Granulated Tapioca Market Volume (MT) Forecast by Distribution Channel, 2017-2032

Table 61: South Asia & Pacific Granulated Tapioca Market Value (US$ Mn) Forecast by Country, 2017-2032

Table 62: South Asia & Pacific Granulated Tapioca Market Volume (MT) Forecast by Country, 2017-2032

Table 63: South Asia & Pacific Granulated Tapioca Market Value (US$ Mn) Forecast by Nature, 2017-2032

Table 64: South Asia & Pacific Granulated Tapioca Market Volume (MT) Forecast by Nature, 2017-2032

Table 65: South Asia & Pacific Granulated Tapioca Market Value (US$ Mn) Forecast by Application, 2017-2032

Table 66: South Asia & Pacific Granulated Tapioca Market Volume (MT) Forecast by Application, 2017-2032

Table 67: South Asia & Pacific Granulated Tapioca Market Value (US$ Mn) Forecast by Function, 2017-2032

Table 68: South Asia & Pacific Granulated Tapioca Market Volume (MT) Forecast by Function, 2017-2032

Table 69: South Asia & Pacific Granulated Tapioca Market Value (US$ Mn) Forecast by Packaging, 2017-2032

Table 70: South Asia & Pacific Granulated Tapioca Market Volume (MT) Forecast by Packaging, 2017-2032

Table 71: South Asia & Pacific Granulated Tapioca Market Value (US$ Mn) Forecast by Distribution Channel, 2017-2032

Table 72: South Asia & Pacific Granulated Tapioca Market Volume (MT) Forecast by Distribution Channel, 2017-2032

Table 73: MEA Granulated Tapioca Market Value (US$ Mn) Forecast by Country, 2017-2032

Table 74: MEA Granulated Tapioca Market Volume (MT) Forecast by Country, 2017-2032

Table 75: MEA Granulated Tapioca Market Value (US$ Mn) Forecast by Nature, 2017-2032

Table 76: MEA Granulated Tapioca Market Volume (MT) Forecast by Nature, 2017-2032

Table 77: MEA Granulated Tapioca Market Value (US$ Mn) Forecast by Application, 2017-2032

Table 78: MEA Granulated Tapioca Market Volume (MT) Forecast by Application, 2017-2032

Table 79: MEA Granulated Tapioca Market Value (US$ Mn) Forecast by Function, 2017-2032

Table 80: MEA Granulated Tapioca Market Volume (MT) Forecast by Function, 2017-2032

Table 81: MEA Granulated Tapioca Market Value (US$ Mn) Forecast by Packaging, 2017-2032

Table 82: MEA Granulated Tapioca Market Volume (MT) Forecast by Packaging, 2017-2032

Table 83: MEA Granulated Tapioca Market Value (US$ Mn) Forecast by Distribution Channel, 2017-2032

Table 84: MEA Granulated Tapioca Market Volume (MT) Forecast by Distribution Channel, 2017-2032
Nandini Roy Choudhury

Principal Consultant

Talk to Analyst

Find your sweet spots for generating winning opportunities in this market.

List of Charts

Figure 1: Global Granulated Tapioca Market Value (US$ Mn) by Nature, 2022-2032

Figure 2: Global Granulated Tapioca Market Value (US$ Mn) by Application, 2022-2032

Figure 3: Global Granulated Tapioca Market Value (US$ Mn) by Function, 2022-2032

Figure 4: Global Granulated Tapioca Market Value (US$ Mn) by Packaging, 2022-2032

Figure 5: Global Granulated Tapioca Market Value (US$ Mn) by Distribution Channel, 2022-2032

Figure 6: Global Granulated Tapioca Market Value (US$ Mn) by Region, 2022-2032

Figure 7: Global Granulated Tapioca Market Value (US$ Mn) Analysis by Region, 2017-2032

Figure 8: Global Granulated Tapioca Market Volume (MT) Analysis by Region, 2017-2032

Figure 9: Global Granulated Tapioca Market Value Share (%) and BPS Analysis by Region, 2022-2032

Figure 10: Global Granulated Tapioca Market Y-o-Y Growth (%) Projections by Region, 2022-2032

Figure 11: Global Granulated Tapioca Market Value (US$ Mn) Analysis by Nature, 2017-2032

Figure 12: Global Granulated Tapioca Market Volume (MT) Analysis by Nature, 2017-2032

Figure 13: Global Granulated Tapioca Market Value Share (%) and BPS Analysis by Nature, 2022-2032

Figure 14: Global Granulated Tapioca Market Y-o-Y Growth (%) Projections by Nature, 2022-2032

Figure 15: Global Granulated Tapioca Market Value (US$ Mn) Analysis by Application, 2017-2032

Figure 16: Global Granulated Tapioca Market Volume (MT) Analysis by Application, 2017-2032

Figure 17: Global Granulated Tapioca Market Value Share (%) and BPS Analysis by Application, 2022-2032

Figure 18: Global Granulated Tapioca Market Y-o-Y Growth (%) Projections by Application, 2022-2032

Figure 19: Global Granulated Tapioca Market Value (US$ Mn) Analysis by Function, 2017-2032

Figure 20: Global Granulated Tapioca Market Volume (MT) Analysis by Function, 2017-2032

Figure 21: Global Granulated Tapioca Market Value Share (%) and BPS Analysis by Function, 2022-2032

Figure 22: Global Granulated Tapioca Market Y-o-Y Growth (%) Projections by Function, 2022-2032

Figure 23: Global Granulated Tapioca Market Value (US$ Mn) Analysis by Packaging, 2017-2032

Figure 24: Global Granulated Tapioca Market Volume (MT) Analysis by Packaging, 2017-2032

Figure 25: Global Granulated Tapioca Market Value Share (%) and BPS Analysis by Packaging, 2022-2032

Figure 26: Global Granulated Tapioca Market Y-o-Y Growth (%) Projections by Packaging, 2022-2032

Figure 27: Global Granulated Tapioca Market Value (US$ Mn) Analysis by Distribution Channel, 2017-2032

Figure 28: Global Granulated Tapioca Market Volume (MT) Analysis by Distribution Channel, 2017-2032

Figure 29: Global Granulated Tapioca Market Value Share (%) and BPS Analysis by Distribution Channel, 2022-2032

Figure 30: Global Granulated Tapioca Market Y-o-Y Growth (%) Projections by Distribution Channel, 2022-2032

Figure 31: Global Granulated Tapioca Market Attractiveness by Nature, 2022-2032

Figure 32: Global Granulated Tapioca Market Attractiveness by Application, 2022-2032

Figure 33: Global Granulated Tapioca Market Attractiveness by Function, 2022-2032

Figure 34: Global Granulated Tapioca Market Attractiveness by Packaging, 2022-2032

Figure 35: Global Granulated Tapioca Market Attractiveness by Distribution Channel, 2022-2032

Figure 36: Global Granulated Tapioca Market Attractiveness by Region, 2022-2032

Figure 37: North America Granulated Tapioca Market Value (US$ Mn) by Nature, 2022-2032

Figure 38: North America Granulated Tapioca Market Value (US$ Mn) by Application, 2022-2032

Figure 39: North America Granulated Tapioca Market Value (US$ Mn) by Function, 2022-2032

Figure 40: North America Granulated Tapioca Market Value (US$ Mn) by Packaging, 2022-2032

Figure 41: North America Granulated Tapioca Market Value (US$ Mn) by Distribution Channel, 2022-2032

Figure 42: North America Granulated Tapioca Market Value (US$ Mn) by Country, 2022-2032

Figure 43: North America Granulated Tapioca Market Value (US$ Mn) Analysis by Country, 2017-2032

Figure 44: North America Granulated Tapioca Market Volume (MT) Analysis by Country, 2017-2032

Figure 45: North America Granulated Tapioca Market Value Share (%) and BPS Analysis by Country, 2022-2032

Figure 46: North America Granulated Tapioca Market Y-o-Y Growth (%) Projections by Country, 2022-2032

Figure 47: North America Granulated Tapioca Market Value (US$ Mn) Analysis by Nature, 2017-2032

Figure 48: North America Granulated Tapioca Market Volume (MT) Analysis by Nature, 2017-2032

Figure 49: North America Granulated Tapioca Market Value Share (%) and BPS Analysis by Nature, 2022-2032

Figure 50: North America Granulated Tapioca Market Y-o-Y Growth (%) Projections by Nature, 2022-2032

Figure 51: North America Granulated Tapioca Market Value (US$ Mn) Analysis by Application, 2017-2032

Figure 52: North America Granulated Tapioca Market Volume (MT) Analysis by Application, 2017-2032

Figure 53: North America Granulated Tapioca Market Value Share (%) and BPS Analysis by Application, 2022-2032

Figure 54: North America Granulated Tapioca Market Y-o-Y Growth (%) Projections by Application, 2022-2032

Figure 55: North America Granulated Tapioca Market Value (US$ Mn) Analysis by Function, 2017-2032

Figure 56: North America Granulated Tapioca Market Volume (MT) Analysis by Function, 2017-2032

Figure 57: North America Granulated Tapioca Market Value Share (%) and BPS Analysis by Function, 2022-2032

Figure 58: North America Granulated Tapioca Market Y-o-Y Growth (%) Projections by Function, 2022-2032

Figure 59: North America Granulated Tapioca Market Value (US$ Mn) Analysis by Packaging, 2017-2032

Figure 60: North America Granulated Tapioca Market Volume (MT) Analysis by Packaging, 2017-2032

Figure 61: North America Granulated Tapioca Market Value Share (%) and BPS Analysis by Packaging, 2022-2032

Figure 62: North America Granulated Tapioca Market Y-o-Y Growth (%) Projections by Packaging, 2022-2032

Figure 63: North America Granulated Tapioca Market Value (US$ Mn) Analysis by Distribution Channel, 2017-2032

Figure 64: North America Granulated Tapioca Market Volume (MT) Analysis by Distribution Channel, 2017-2032

Figure 65: North America Granulated Tapioca Market Value Share (%) and BPS Analysis by Distribution Channel, 2022-2032

Figure 66: North America Granulated Tapioca Market Y-o-Y Growth (%) Projections by Distribution Channel, 2022-2032

Figure 67: North America Granulated Tapioca Market Attractiveness by Nature, 2022-2032

Figure 68: North America Granulated Tapioca Market Attractiveness by Application, 2022-2032

Figure 69: North America Granulated Tapioca Market Attractiveness by Function, 2022-2032

Figure 70: North America Granulated Tapioca Market Attractiveness by Packaging, 2022-2032

Figure 71: North America Granulated Tapioca Market Attractiveness by Distribution Channel, 2022-2032

Figure 72: North America Granulated Tapioca Market Attractiveness by Country, 2022-2032

Figure 73: Latin America Granulated Tapioca Market Value (US$ Mn) by Nature, 2022-2032

Figure 74: Latin America Granulated Tapioca Market Value (US$ Mn) by Application, 2022-2032

Figure 75: Latin America Granulated Tapioca Market Value (US$ Mn) by Function, 2022-2032

Figure 76: Latin America Granulated Tapioca Market Value (US$ Mn) by Packaging, 2022-2032

Figure 77: Latin America Granulated Tapioca Market Value (US$ Mn) by Distribution Channel, 2022-2032

Figure 78: Latin America Granulated Tapioca Market Value (US$ Mn) by Country, 2022-2032

Figure 79: Latin America Granulated Tapioca Market Value (US$ Mn) Analysis by Country, 2017-2032

Figure 80: Latin America Granulated Tapioca Market Volume (MT) Analysis by Country, 2017-2032

Figure 81: Latin America Granulated Tapioca Market Value Share (%) and BPS Analysis by Country, 2022-2032

Figure 82: Latin America Granulated Tapioca Market Y-o-Y Growth (%) Projections by Country, 2022-2032

Figure 83: Latin America Granulated Tapioca Market Value (US$ Mn) Analysis by Nature, 2017-2032

Figure 84: Latin America Granulated Tapioca Market Volume (MT) Analysis by Nature, 2017-2032

Figure 85: Latin America Granulated Tapioca Market Value Share (%) and BPS Analysis by Nature, 2022-2032

Figure 86: Latin America Granulated Tapioca Market Y-o-Y Growth (%) Projections by Nature, 2022-2032

Figure 87: Latin America Granulated Tapioca Market Value (US$ Mn) Analysis by Application, 2017-2032

Figure 88: Latin America Granulated Tapioca Market Volume (MT) Analysis by Application, 2017-2032

Figure 89: Latin America Granulated Tapioca Market Value Share (%) and BPS Analysis by Application, 2022-2032

Figure 90: Latin America Granulated Tapioca Market Y-o-Y Growth (%) Projections by Application, 2022-2032

Figure 91: Latin America Granulated Tapioca Market Value (US$ Mn) Analysis by Function, 2017-2032

Figure 92: Latin America Granulated Tapioca Market Volume (MT) Analysis by Function, 2017-2032

Figure 93: Latin America Granulated Tapioca Market Value Share (%) and BPS Analysis by Function, 2022-2032

Figure 94: Latin America Granulated Tapioca Market Y-o-Y Growth (%) Projections by Function, 2022-2032

Figure 95: Latin America Granulated Tapioca Market Value (US$ Mn) Analysis by Packaging, 2017-2032

Figure 96: Latin America Granulated Tapioca Market Volume (MT) Analysis by Packaging, 2017-2032

Figure 97: Latin America Granulated Tapioca Market Value Share (%) and BPS Analysis by Packaging, 2022-2032

Figure 98: Latin America Granulated Tapioca Market Y-o-Y Growth (%) Projections by Packaging, 2022-2032

Figure 99: Latin America Granulated Tapioca Market Value (US$ Mn) Analysis by Distribution Channel, 2017-2032

Figure 100: Latin America Granulated Tapioca Market Volume (MT) Analysis by Distribution Channel, 2017-2032

Figure 101: Latin America Granulated Tapioca Market Value Share (%) and BPS Analysis by Distribution Channel, 2022-2032

Figure 102: Latin America Granulated Tapioca Market Y-o-Y Growth (%) Projections by Distribution Channel, 2022-2032

Figure 103: Latin America Granulated Tapioca Market Attractiveness by Nature, 2022-2032

Figure 104: Latin America Granulated Tapioca Market Attractiveness by Application, 2022-2032

Figure 105: Latin America Granulated Tapioca Market Attractiveness by Function, 2022-2032

Figure 106: Latin America Granulated Tapioca Market Attractiveness by Packaging, 2022-2032

Figure 107: Latin America Granulated Tapioca Market Attractiveness by Distribution Channel, 2022-2032

Figure 108: Latin America Granulated Tapioca Market Attractiveness by Country, 2022-2032

Figure 109: Europe Granulated Tapioca Market Value (US$ Mn) by Nature, 2022-2032

Figure 110: Europe Granulated Tapioca Market Value (US$ Mn) by Application, 2022-2032

Figure 111: Europe Granulated Tapioca Market Value (US$ Mn) by Function, 2022-2032

Figure 112: Europe Granulated Tapioca Market Value (US$ Mn) by Packaging, 2022-2032

Figure 113: Europe Granulated Tapioca Market Value (US$ Mn) by Distribution Channel, 2022-2032

Figure 114: Europe Granulated Tapioca Market Value (US$ Mn) by Country, 2022-2032

Figure 115: Europe Granulated Tapioca Market Value (US$ Mn) Analysis by Country, 2017-2032

Figure 116: Europe Granulated Tapioca Market Volume (MT) Analysis by Country, 2017-2032

Figure 117: Europe Granulated Tapioca Market Value Share (%) and BPS Analysis by Country, 2022-2032

Figure 118: Europe Granulated Tapioca Market Y-o-Y Growth (%) Projections by Country, 2022-2032

Figure 119: Europe Granulated Tapioca Market Value (US$ Mn) Analysis by Nature, 2017-2032

Figure 120: Europe Granulated Tapioca Market Volume (MT) Analysis by Nature, 2017-2032

Figure 121: Europe Granulated Tapioca Market Value Share (%) and BPS Analysis by Nature, 2022-2032

Figure 122: Europe Granulated Tapioca Market Y-o-Y Growth (%) Projections by Nature, 2022-2032

Figure 123: Europe Granulated Tapioca Market Value (US$ Mn) Analysis by Application, 2017-2032

Figure 124: Europe Granulated Tapioca Market Volume (MT) Analysis by Application, 2017-2032

Figure 125: Europe Granulated Tapioca Market Value Share (%) and BPS Analysis by Application, 2022-2032

Figure 126: Europe Granulated Tapioca Market Y-o-Y Growth (%) Projections by Application, 2022-2032

Figure 127: Europe Granulated Tapioca Market Value (US$ Mn) Analysis by Function, 2017-2032

Figure 128: Europe Granulated Tapioca Market Volume (MT) Analysis by Function, 2017-2032

Figure 129: Europe Granulated Tapioca Market Value Share (%) and BPS Analysis by Function, 2022-2032

Figure 130: Europe Granulated Tapioca Market Y-o-Y Growth (%) Projections by Function, 2022-2032

Figure 131: Europe Granulated Tapioca Market Value (US$ Mn) Analysis by Packaging, 2017-2032

Figure 132: Europe Granulated Tapioca Market Volume (MT) Analysis by Packaging, 2017-2032

Figure 133: Europe Granulated Tapioca Market Value Share (%) and BPS Analysis by Packaging, 2022-2032

Figure 134: Europe Granulated Tapioca Market Y-o-Y Growth (%) Projections by Packaging, 2022-2032

Figure 135: Europe Granulated Tapioca Market Value (US$ Mn) Analysis by Distribution Channel, 2017-2032

Figure 136: Europe Granulated Tapioca Market Volume (MT) Analysis by Distribution Channel, 2017-2032

Figure 137: Europe Granulated Tapioca Market Value Share (%) and BPS Analysis by Distribution Channel, 2022-2032

Figure 138: Europe Granulated Tapioca Market Y-o-Y Growth (%) Projections by Distribution Channel, 2022-2032

Figure 139: Europe Granulated Tapioca Market Attractiveness by Nature, 2022-2032

Figure 140: Europe Granulated Tapioca Market Attractiveness by Application, 2022-2032

Figure 141: Europe Granulated Tapioca Market Attractiveness by Function, 2022-2032

Figure 142: Europe Granulated Tapioca Market Attractiveness by Packaging, 2022-2032

Figure 143: Europe Granulated Tapioca Market Attractiveness by Distribution Channel, 2022-2032

Figure 144: Europe Granulated Tapioca Market Attractiveness by Country, 2022-2032

Figure 145: East Asia Granulated Tapioca Market Value (US$ Mn) by Nature, 2022-2032

Figure 146: East Asia Granulated Tapioca Market Value (US$ Mn) by Application, 2022-2032

Figure 147: East Asia Granulated Tapioca Market Value (US$ Mn) by Function, 2022-2032

Figure 148: East Asia Granulated Tapioca Market Value (US$ Mn) by Packaging, 2022-2032

Figure 149: East Asia Granulated Tapioca Market Value (US$ Mn) by Distribution Channel, 2022-2032

Figure 150: East Asia Granulated Tapioca Market Value (US$ Mn) by Country, 2022-2032

Figure 151: East Asia Granulated Tapioca Market Value (US$ Mn) Analysis by Country, 2017-2032

Figure 152: East Asia Granulated Tapioca Market Volume (MT) Analysis by Country, 2017-2032

Figure 153: East Asia Granulated Tapioca Market Value Share (%) and BPS Analysis by Country, 2022-2032

Figure 154: East Asia Granulated Tapioca Market Y-o-Y Growth (%) Projections by Country, 2022-2032

Figure 155: East Asia Granulated Tapioca Market Value (US$ Mn) Analysis by Nature, 2017-2032

Figure 156: East Asia Granulated Tapioca Market Volume (MT) Analysis by Nature, 2017-2032

Figure 157: East Asia Granulated Tapioca Market Value Share (%) and BPS Analysis by Nature, 2022-2032

Figure 158: East Asia Granulated Tapioca Market Y-o-Y Growth (%) Projections by Nature, 2022-2032

Figure 159: East Asia Granulated Tapioca Market Value (US$ Mn) Analysis by Application, 2017-2032

Figure 160: East Asia Granulated Tapioca Market Volume (MT) Analysis by Application, 2017-2032

Figure 161: East Asia Granulated Tapioca Market Value Share (%) and BPS Analysis by Application, 2022-2032

Figure 162: East Asia Granulated Tapioca Market Y-o-Y Growth (%) Projections by Application, 2022-2032

Figure 163: East Asia Granulated Tapioca Market Value (US$ Mn) Analysis by Function, 2017-2032

Figure 164: East Asia Granulated Tapioca Market Volume (MT) Analysis by Function, 2017-2032

Figure 165: East Asia Granulated Tapioca Market Value Share (%) and BPS Analysis by Function, 2022-2032

Figure 166: East Asia Granulated Tapioca Market Y-o-Y Growth (%) Projections by Function, 2022-2032

Figure 167: East Asia Granulated Tapioca Market Value (US$ Mn) Analysis by Packaging, 2017-2032

Figure 168: East Asia Granulated Tapioca Market Volume (MT) Analysis by Packaging, 2017-2032

Figure 169: East Asia Granulated Tapioca Market Value Share (%) and BPS Analysis by Packaging, 2022-2032

Figure 170: East Asia Granulated Tapioca Market Y-o-Y Growth (%) Projections by Packaging, 2022-2032

Figure 171: East Asia Granulated Tapioca Market Value (US$ Mn) Analysis by Distribution Channel, 2017-2032

Figure 172: East Asia Granulated Tapioca Market Volume (MT) Analysis by Distribution Channel, 2017-2032

Figure 173: East Asia Granulated Tapioca Market Value Share (%) and BPS Analysis by Distribution Channel, 2022-2032

Figure 174: East Asia Granulated Tapioca Market Y-o-Y Growth (%) Projections by Distribution Channel, 2022-2032

Figure 175: East Asia Granulated Tapioca Market Attractiveness by Nature, 2022-2032

Figure 176: East Asia Granulated Tapioca Market Attractiveness by Application, 2022-2032

Figure 177: East Asia Granulated Tapioca Market Attractiveness by Function, 2022-2032

Figure 178: East Asia Granulated Tapioca Market Attractiveness by Packaging, 2022-2032

Figure 179: East Asia Granulated Tapioca Market Attractiveness by Distribution Channel, 2022-2032

Figure 180: East Asia Granulated Tapioca Market Attractiveness by Country, 2022-2032

Figure 181: South Asia & Pacific Granulated Tapioca Market Value (US$ Mn) by Nature, 2022-2032

Figure 182: South Asia & Pacific Granulated Tapioca Market Value (US$ Mn) by Application, 2022-2032

Figure 183: South Asia & Pacific Granulated Tapioca Market Value (US$ Mn) by Function, 2022-2032

Figure 184: South Asia & Pacific Granulated Tapioca Market Value (US$ Mn) by Packaging, 2022-2032

Figure 185: South Asia & Pacific Granulated Tapioca Market Value (US$ Mn) by Distribution Channel, 2022-2032

Figure 186: South Asia & Pacific Granulated Tapioca Market Value (US$ Mn) by Country, 2022-2032

Figure 187: South Asia & Pacific Granulated Tapioca Market Value (US$ Mn) Analysis by Country, 2017-2032

Figure 188: South Asia & Pacific Granulated Tapioca Market Volume (MT) Analysis by Country, 2017-2032

Figure 189: South Asia & Pacific Granulated Tapioca Market Value Share (%) and BPS Analysis by Country, 2022-2032

Figure 190: South Asia & Pacific Granulated Tapioca Market Y-o-Y Growth (%) Projections by Country, 2022-2032

Figure 191: South Asia & Pacific Granulated Tapioca Market Value (US$ Mn) Analysis by Nature, 2017-2032

Figure 192: South Asia & Pacific Granulated Tapioca Market Volume (MT) Analysis by Nature, 2017-2032

Figure 193: South Asia & Pacific Granulated Tapioca Market Value Share (%) and BPS Analysis by Nature, 2022-2032

Figure 194: South Asia & Pacific Granulated Tapioca Market Y-o-Y Growth (%) Projections by Nature, 2022-2032

Figure 195: South Asia & Pacific Granulated Tapioca Market Value (US$ Mn) Analysis by Application, 2017-2032

Figure 196: South Asia & Pacific Granulated Tapioca Market Volume (MT) Analysis by Application, 2017-2032

Figure 197: South Asia & Pacific Granulated Tapioca Market Value Share (%) and BPS Analysis by Application, 2022-2032

Figure 198: South Asia & Pacific Granulated Tapioca Market Y-o-Y Growth (%) Projections by Application, 2022-2032

Figure 199: South Asia & Pacific Granulated Tapioca Market Value (US$ Mn) Analysis by Function, 2017-2032

Figure 200: South Asia & Pacific Granulated Tapioca Market Volume (MT) Analysis by Function, 2017-2032

Figure 201: South Asia & Pacific Granulated Tapioca Market Value Share (%) and BPS Analysis by Function, 2022-2032

Figure 202: South Asia & Pacific Granulated Tapioca Market Y-o-Y Growth (%) Projections by Function, 2022-2032

Figure 203: South Asia & Pacific Granulated Tapioca Market Value (US$ Mn) Analysis by Packaging, 2017-2032

Figure 204: South Asia & Pacific Granulated Tapioca Market Volume (MT) Analysis by Packaging, 2017-2032

Figure 205: South Asia & Pacific Granulated Tapioca Market Value Share (%) and BPS Analysis by Packaging, 2022-2032

Figure 206: South Asia & Pacific Granulated Tapioca Market Y-o-Y Growth (%) Projections by Packaging, 2022-2032

Figure 207: South Asia & Pacific Granulated Tapioca Market Value (US$ Mn) Analysis by Distribution Channel, 2017-2032

Figure 208: South Asia & Pacific Granulated Tapioca Market Volume (MT) Analysis by Distribution Channel, 2017-2032

Figure 209: South Asia & Pacific Granulated Tapioca Market Value Share (%) and BPS Analysis by Distribution Channel, 2022-2032

Figure 210: South Asia & Pacific Granulated Tapioca Market Y-o-Y Growth (%) Projections by Distribution Channel, 2022-2032

Figure 211: South Asia & Pacific Granulated Tapioca Market Attractiveness by Nature, 2022-2032

Figure 212: South Asia & Pacific Granulated Tapioca Market Attractiveness by Application, 2022-2032

Figure 213: South Asia & Pacific Granulated Tapioca Market Attractiveness by Function, 2022-2032

Figure 214: South Asia & Pacific Granulated Tapioca Market Attractiveness by Packaging, 2022-2032

Figure 215: South Asia & Pacific Granulated Tapioca Market Attractiveness by Distribution Channel, 2022-2032

Figure 216: South Asia & Pacific Granulated Tapioca Market Attractiveness by Country, 2022-2032

Figure 217: MEA Granulated Tapioca Market Value (US$ Mn) by Nature, 2022-2032

Figure 218: MEA Granulated Tapioca Market Value (US$ Mn) by Application, 2022-2032

Figure 219: MEA Granulated Tapioca Market Value (US$ Mn) by Function, 2022-2032

Figure 220: MEA Granulated Tapioca Market Value (US$ Mn) by Packaging, 2022-2032

Figure 221: MEA Granulated Tapioca Market Value (US$ Mn) by Distribution Channel, 2022-2032

Figure 222: MEA Granulated Tapioca Market Value (US$ Mn) by Country, 2022-2032

Figure 223: MEA Granulated Tapioca Market Value (US$ Mn) Analysis by Country, 2017-2032

Figure 224: MEA Granulated Tapioca Market Volume (MT) Analysis by Country, 2017-2032

Figure 225: MEA Granulated Tapioca Market Value Share (%) and BPS Analysis by Country, 2022-2032

Figure 226: MEA Granulated Tapioca Market Y-o-Y Growth (%) Projections by Country, 2022-2032

Figure 227: MEA Granulated Tapioca Market Value (US$ Mn) Analysis by Nature, 2017-2032

Figure 228: MEA Granulated Tapioca Market Volume (MT) Analysis by Nature, 2017-2032

Figure 229: MEA Granulated Tapioca Market Value Share (%) and BPS Analysis by Nature, 2022-2032

Figure 230: MEA Granulated Tapioca Market Y-o-Y Growth (%) Projections by Nature, 2022-2032

Figure 231: MEA Granulated Tapioca Market Value (US$ Mn) Analysis by Application, 2017-2032

Figure 232: MEA Granulated Tapioca Market Volume (MT) Analysis by Application, 2017-2032

Figure 233: MEA Granulated Tapioca Market Value Share (%) and BPS Analysis by Application, 2022-2032

Figure 234: MEA Granulated Tapioca Market Y-o-Y Growth (%) Projections by Application, 2022-2032

Figure 235: MEA Granulated Tapioca Market Value (US$ Mn) Analysis by Function, 2017-2032

Figure 236: MEA Granulated Tapioca Market Volume (MT) Analysis by Function, 2017-2032

Figure 237: MEA Granulated Tapioca Market Value Share (%) and BPS Analysis by Function, 2022-2032

Figure 238: MEA Granulated Tapioca Market Y-o-Y Growth (%) Projections by Function, 2022-2032

Figure 239: MEA Granulated Tapioca Market Value (US$ Mn) Analysis by Packaging, 2017-2032

Figure 240: MEA Granulated Tapioca Market Volume (MT) Analysis by Packaging, 2017-2032

Figure 241: MEA Granulated Tapioca Market Value Share (%) and BPS Analysis by Packaging, 2022-2032

Figure 242: MEA Granulated Tapioca Market Y-o-Y Growth (%) Projections by Packaging, 2022-2032

Figure 243: MEA Granulated Tapioca Market Value (US$ Mn) Analysis by Distribution Channel, 2017-2032

Figure 244: MEA Granulated Tapioca Market Volume (MT) Analysis by Distribution Channel, 2017-2032

Figure 245: MEA Granulated Tapioca Market Value Share (%) and BPS Analysis by Distribution Channel, 2022-2032

Figure 246: MEA Granulated Tapioca Market Y-o-Y Growth (%) Projections by Distribution Channel, 2022-2032

Figure 247: MEA Granulated Tapioca Market Attractiveness by Nature, 2022-2032

Figure 248: MEA Granulated Tapioca Market Attractiveness by Application, 2022-2032

Figure 249: MEA Granulated Tapioca Market Attractiveness by Function, 2022-2032

Figure 250: MEA Granulated Tapioca Market Attractiveness by Packaging, 2022-2032

Figure 251: MEA Granulated Tapioca Market Attractiveness by Distribution Channel, 2022-2032

Figure 252: MEA Granulated Tapioca Market Attractiveness by Country, 2022-2032

Recommendations

Food and Beverage

Tapioca Pearls Market

Published : July 2022

Food and Beverage

Tapioca Maltodextrin Market

Published : May 2022

Explore Food and Beverage Insights

View Reports

Granulated Tapioca Market