Digestion Resistant Maltodextrin Market Forecast and Outlook 2025 to 2035

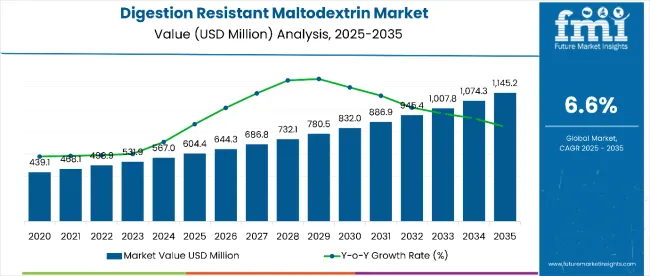
The digestion resistant maltodextrin market is projected to grow from USD 604.4 million in 2025 to USD 1145.2 million by 2035, reflecting a CAGR of 6.6%.

Quick Stats for Digestion Resistant Maltodextrin Market

  • Digestion Resistant Maltodextrin Market Value (2025): USD 604.4 million
  • Digestion Resistant Maltodextrin Market Forecast Value (2035): USD 1145.2 million
  • Digestion Resistant Maltodextrin Market Forecast CAGR: 6.6%
  • Leading Segment in Digestion Resistant Maltodextrin Market 2025: Food (67%)
  • Key Growth Regions in Digestion Resistant Maltodextrin Market: Asia Pacific and Western Europe
  • Top Companies in Digestion Resistant Maltodextrin Market: Roquette Freres S.A., Ingredion Incorporated, Tate & Lyle, Grain Processing Corporation

Digestion Resistant Maltodextrin Market

Metric Value
Estimated Market Value (2025E) USD 604.4 million
Forecast Market Value (2035F) USD 1,145.2 million
Forecast CAGR (2025 to 2035) 6.6%

This rise is propelled by increasing consumer interest in functional dietary fibers known to support digestive health and gut microbiome balance. Expanding usage in food, beverages, and dietary supplements is fueling demand globally. Rising health consciousness and growth in functional foods and nutraceuticals further promote DRM adoption as a key ingredient for fiber enrichment.

By 2030, the market is expected to reach around USD 832.0million, highlighting steady value addition in the first half of the period. Growing awareness about dietary fiber’s benefits and alignment with clean-label trends are significant growth drivers. Food manufacturers increasingly incorporate DRM to meet consumer demand for healthier and fiber-rich products while maintaining taste and texture. This trend is expected to continue as demand for gut health products rises, especially in emerging regions.

Leading companies such as Roquette Freres S.A., Ingredion Incorporated, and Tate & Lyle are investing in innovation and production capacity expansion. Cost-effective extraction methods and sourcing from natural ingredients strengthen their market positions. These companies focus on regulatory compliance and quality control to address demand in food and nutraceutical sectors. Their R&D efforts focus on improving functional properties, clean-label options, and expanding applications of DRM within functional foods and supplements, ensuring sustained market growth over the forecast period.

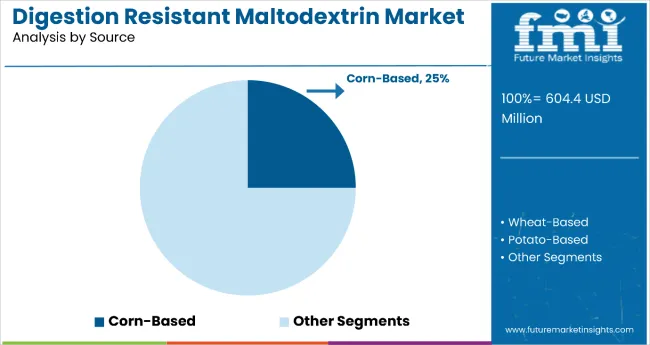
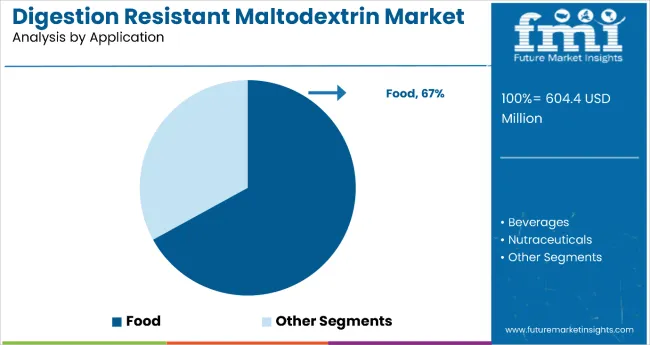
The market accounts for 25% of the source segment, led by corn-based DRM, driven by its abundant availability, cost-effectiveness, and functional benefits in dietary fiber enrichment. It accounts for around 67% of the application segment in food, supported by its widespread use in fiber-enriched functional foods and beverages. The market sees growing adoption in nutraceuticals and dietary supplements, reflecting increasing consumer demand for digestive health and gut microbiome support. Rising health consciousness and clean-label trends are key drivers.

The market is evolving with rising consumer preference for natural, functional ingredients and expanded use across food, beverage, and supplement sectors. Advances in production technologies and cost-effective extraction methods improve product quality, supporting wider applications. Companies are introducing clean-label and specialized formulations tailored to regulatory standards. Strategic innovations and expansion by key players are driving growth in both mature and emerging markets.

Why is the Digestion Resistant Maltodextrin Market Growing?

The market is growing primarily due to rising consumer awareness about digestive health and the benefits of dietary fibers. As more people focus on wellness and gut health, functional dietary fibers like DRM are increasingly incorporated into foods, beverages, and dietary supplements. This trend is propelled by the global rise in lifestyle diseases such as diabetes and obesity, pushing consumers towards healthier, low-calorie, fiber-rich alternatives.

Another key driver is the growing market demand for clean-label and natural ingredients, with consumers preferring products that enhance digestive function without compromising taste or texture. Manufacturers are responding with improved extraction technologies and formulation innovations that maintain product quality while meeting regulatory standards.

Additionally, expanding applications in sports nutrition, functional foods, and nutraceuticals are fueling market growth. The ingredient’s ability to support sustained energy release and improve glycemic control appeals to both health-conscious consumers and athletes. Overall, greater health consciousness, evolving dietary trends, and ongoing innovations in production and product development underpin the steady growth of the DRM market.

Digestion Resistant Maltodextrin Market by Top Investment Segments

The market is segmented by source, application, form, and region. By source, the market is divided into corn-based, wheat-based, potato-based, cassava-based, and others (tapioca and mixed starch sources). Based on application, the market is divided into beverages (alcoholic beverages and non-alcoholic beverages), food (breakfast cereals, dairy products, instant puddings, margarines and butters, salad dressings, sauces, snack foods, and others such as bakery products and confectionery)and nutraceuticals. In terms of form, the market is bifurcated into spray-dried powder and instantized/agglomerated. Regionally, the market is classified into North America, Latin America, Western Europe, South Asia, East Asia, Eastern Europe, and the Middle East & Africa.
By Source, Corn-Based Segment Accounts for 25% Market Share

Digestion Resistant Maltodextrin Market By Source

The corn-based segment stands out as the most lucrative source segment in the digestion resistant maltodextrin (DRM) market, holding a sizeable market share of 25% in 2025. This segment’s dominance is attributed to the global abundance and cost-effectiveness of corn as a raw material. Corn’s high starch yield facilitates efficient production of resistant maltodextrin with desirable functional properties such as improved solubility, stability, and dietary fiber content, which are highly valued in food and beverage manufacturing.

Moreover, corn-based DRM benefits from well-established agricultural supply chains, technological innovations in starch processing, and versatile application possibilities across baked goods, snacks, dairy, and beverages. These factors collectively reduce production costs, making corn-based products more accessible to manufacturers, especially in price-sensitive markets. Additionally, consumer awareness around digestive health and dietary fiber intake is accelerating demand for corn-derived DRM in functional foods and nutraceuticals. This combination of economic, technological, and consumer-driven factors fuels the corn-based segment’s leading market share and positions it as the most economically attractive source within the DRM industry.
By Application, Food Segment Accounts for 67% Market Share

Digestion Resistant Maltodextrin Market By Application

The food segment is the most lucrative application within the digestion resistant maltodextrin (DRM) market, commanding an estimated 67% market share in 2025. This dominance is driven by the broad incorporation of DRM in a wide variety of food products, ranging from breakfast cereals and dairy products to snack foods, sauces, and margarine. DRM’s unique ability to act as a soluble dietary fiber enhances the nutritional profile of food without compromising taste, texture, or caloric content, making it highly appealing to health-conscious consumers.

Rising awareness about gut health and increasing prevalence of digestive disorders are fueling consumer demand for fiber-enriched foods, which is further supported by the clean-label trend emphasizing natural, functional ingredients. Additionally, technological advancements in DRM’s functional properties have enabled food manufacturers to innovate and improve product stability and nutrition simultaneously. Given these factors, plus the expanding global market for functional and healthy foods, the food segment's leading share and continuous innovation pipeline underline its status as the key growth driver and most attractive application in the DRM market.

What are the Drivers, Restraints, and Key Trends of the Digestion Resistant Maltodextrin Market?

From 2025 to 2035, growing consumer awareness of digestive health and increasing demand for functional dietary fibers are the primary drivers of growth in the digestion resistant maltodextrin (DRM) market. Rising health consciousness, coupled with the surge in lifestyle diseases like diabetes and obesity, is pushing consumers toward fiber-enriched foods and beverages, fueling market expansion. Manufacturers are innovating with improved extraction techniques and clean-label formulations to meet regulatory standards and consumer preferences.

Growing Demand for Functional Foods Drives Market Expansion

Increasing interest in gut health and digestive wellness is driving manufacturers to incorporate resistant maltodextrin in functional foods, beverages, and dietary supplements. DRM’s ability to enhance fiber content without affecting taste or texture makes it a preferred ingredient. Consumer trends favor natural, low-calorie, fiber-rich ingredients, further boosting adoption across global markets, especially in emerging regions.

Innovations and Sustainability Enhance Market Opportunities

Advancements in production technologies, such as enzymatic extraction and spray-drying, improve DRM’s functional properties and purity, enabling wider use across food and nutraceutical sectors. Companies focusing on sustainable sourcing and clean-label credentials are gaining competitive advantage. Ongoing research into new applications and formulations continues to expand DRM’s market potential, supporting sustained growth throughout the forecast period.
Digestion Resistant Maltodextrin Market Analysis by Key Countries

Digestion Resistant Maltodextrin Market By Country

Countries CAGR (%)
Japan 6.1
China 6.0
France 5.8
Germany 4.9
India 4.8
United States 4.7
United Kingdom 4.5

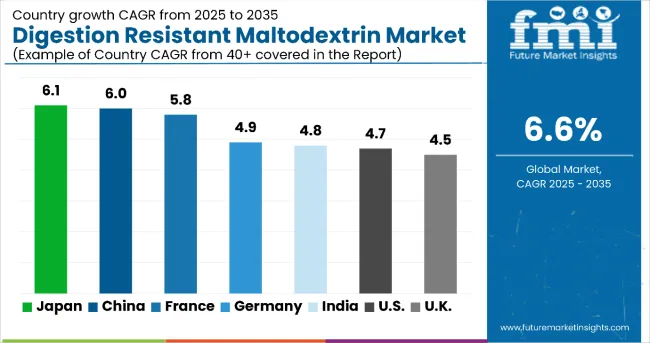
The market growth varies across countries. Japan leads with a CAGR of 6.1%, driven by its aging population and strong regulatory standards. China follows closely at 6.0%, fueled by rising health awareness and government support. France and Germany see steady growth at 5.8% and 4.9%, supported by R&D and advanced food technology. India grows at 4.8%, benefiting from urbanization and e-commerce expansion. The USA market expands at 4.7%, backed by a mature nutraceutical sector and regulatory oversight. The UK records a CAGR of 4.5%, influenced by clean-label trends and growing fiber food demand. Asia-Pacific markets lead growth, while Western regions grow steadily.

The report covers an in-depth analysis of 40+ countries; seven top-performing OECD countries are highlighted below.

Growth Dynamics in Digestion Resistant Maltodextrin Market in China

Demand for digestion resistant maltodextrin (DRM) in China is expanding robustly at a CAGR of 6.0%, fueled by increasing health awareness and growing incidence of digestive health issues. The rising middle-class population with improved purchasing power is driving demand for functional foods and nutraceuticals fortified with dietary fibers like DRM. Domestic manufacturers invest heavily in scaling production capacity and enhancing technology to reduce reliance on imports. Government initiatives encouraging nutritional wellness and digestive health further accelerate market traction. The food and beverage sector is embracing fiber-enriched formulations, contributing to widespread DRM adoption. Manufacturers are also expanding distribution networks to penetrate rural and urban markets alike. Strong R&D focus on product quality and regulatory compliance supports growth momentum. Overall, China is set to remain a key growth hub for the DRM market globally.

  • Significant increase in dietary fiber intake awareness among consumers.
  • Expansion of local DRM manufacturing capacities reducing import dependence.
  • Major domestic players investing in R&D and distribution networks.

Innovative Expansion in Digestion Resistant Maltodextrin Market in Japan

Revenue from digestion resistant maltodextrin in Japan grows at a CAGR of 6.1%, driven by its aging population and increasing focus on preventive health. Consumers prioritize high-quality, natural ingredients that support digestive wellness and gut health, enhancing DRM demand. The pharmaceutical and nutraceutical sectors strongly influence product innovation, with companies developing advanced formulations. Regulatory standards ensure stringent safety and quality controls, bolstering consumer confidence. Local manufacturers are adopting cutting-edge extraction and formulation technologies to improve DRM efficacy and purity. Strategic collaborations between ingredient suppliers and food producers broaden product lines. Market penetration into functional foods continues to rise, with sustained emphasis on clean-label products. Japan’s well-established supply chains facilitate nationwide distribution, ensuring market accessibility. These factors combine to drive steady and sustainable DRM market growth in the country.

  • Aging demographic prioritizing digestive wellness and supplementation.
  • Stringent food safety and quality regulations shaping market standards.
  • Preference for natural, low-calorie fiber additives in food products.

Structural Adoption of Digestion Resistant Maltodextrin Market in France

Revenue from digestion resistant maltodextrin in France advances at a 5.8% CAGR, propelled by strong research capabilities and consumer focus on digestive and cognitive health. The integration of DRM into specialty dietary supplements and premium functional foods is increasing, supported by R&D investments. Collaboration between nutraceutical companies and ingredient manufacturers drives innovation in tailored formulations. Regulatory environment fosters safe and effective ingredient use, encouraging manufacturer confidence. Growing consumer demand for preventive health and wellness products sustains market expansion. The food industry is actively reformulating products with fiber enhancements, boosting DRM incorporation. Export opportunities through European Union markets further strengthen growth. Increasing awareness campaigns and educational initiatives promote DRM benefits among consumers. These developments underpin France’s evolving and promising digestion resistant maltodextrin market landscape.

  • Strong R&D support for functional food ingredient innovation.
  • Rising consumer inclination toward preventive health and wellness.
  • Increasing collaboration between ingredient suppliers and food manufacturers.

Expansion Trends in Digestion Resistant Maltodextrin Market in Germany

Demand for digestion resistant maltodextrin in Germany exhibits a steady 4.9% CAGR, supported by an environmentally conscious and health-driven population. The country’s robust food technology sector advances innovations in fiber-enriched food products. Manufacturers emphasize organic and clean-label DRM sources to meet consumer preferences. Germany’s export-oriented food production benefits from stringent quality controls and safety regulations, enhancing product credibility globally. Awareness of glycemic control through dietary fibers like DRM is growing, further driving market demand. Biotechnology research focuses on optimizing DRM extraction and functional properties. Expansion of dietary supplement formulations separates Germany’s market as a key player in Europe. Gradual increase in fiber intake awareness complements market penetration, ensuring sustained growth.

  • High consumer focus on digestive health and natural ingredients.
  • Leading position in food technology innovations and processing methods.
  • Increasing awareness of DRM’s glycemic control benefits.

Output Expansion in Digestion Resistant Maltodextrin Market in India

Revenue from digestion resistant maltodextrin in India is growing at a CAGR of 4.8%, supported by rapid urbanization and rising health consciousness. Increasing disposable incomes and a large, young population drive demand for healthier, fiber-rich foods and supplements. The development of e-commerce platforms facilitates wider product accessibility beyond metropolitan areas. Government programs promoting nutritional well-being foster functional food adoption. Local production capacities are gradually increasing to reduce dependency on imports. Entry of multinational and domestic players expands product offerings and distribution channels. Traditional and modern food sectors are blending DRM to meet evolving consumer tastes. The market outlook remains optimistic as awareness and product innovation continue to advance.

  • Growing middle-class population adopting healthier lifestyles.
  • Government initiatives promoting nutritional health and wellness.
  • Entry of global and domestic players enhancing product availability.

Capacity Growth in Digestion Resistant Maltodextrin Market in the United States

Sales of digestion resistant maltodextrin in the USA are projected to grow steadily at a 4.7% CAGR, fueled by a mature nutraceutical sector and high consumer awareness of digestive health. Manufacturers invest in advanced DRM production technologies to improve ingredient purity and functional benefits. Clean-label and natural ingredient trends resonate strongly with American consumers, boosting product demand. Collaborative partnerships between ingredient suppliers and major food and beverage brands expand application possibilities. Strict FDA regulations ensure product safety and quality, enhancing market trust. Retail channels, both online and offline, broaden distribution reach. Rising prevalence of metabolic diseases underscores the importance of dietary fibers like DRM. This positions the USA as a stable and innovative DRM market with sustained growth potential.

  • High consumer awareness of gut health and dietary fiber benefits.
  • Strong regulatory framework supporting ingredient safety and efficacy.
  • Partnerships between ingredient suppliers and major food brands.

Market Penetration in Digestion Resistant Maltodextrin Market in the United Kingdom

Demand for digestion resistant maltodextrin in the UK grows at a CAGR of 4.5%, driven by increasing consumer preference for fiber-enriched foods and nutritional supplements. Functional food innovation and clean-label trends encourage manufacturers to integrate DRM into diverse product ranges. The expanding health and wellness retail environment supports product visibility and consumer education. Nutraceutical demand, especially for digestive and metabolic health, strengthens DRM adoption. Regulatory frameworks continue to promote safe, functional ingredients in the food supply. Strategic marketing initiatives highlight the digestive benefits of DRM, broadening consumer acceptance. Product launches featuring DRM in snacks, drinks, and supplements increase market variety. The UK market evolves steadily with consumer-centric growth strategies enhancing penetration.
  • Rising adoption of fiber-rich diets and clean-label products.
  • Growing nutraceutical market emphasizing digestive health supplements.
  • Regulatory encouragement for functional ingredient usage in foods.

Competitive Landscape of the Digestion Resistant Maltodextrin Market

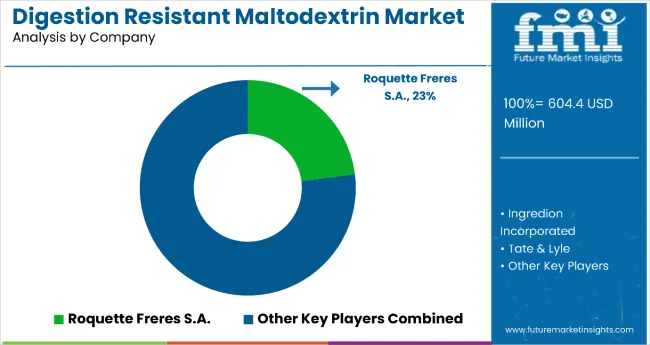
Digestion Resistant Maltodextrin Market By Company

The market features a moderately consolidated competitive landscape with several key players dominating the industry through innovation, strategic partnerships, and expanded production capacities. Leading companies such as Roquette Freres S.A., Ingredion Incorporated, Tate & Lyle, and Grain Processing Corporation play pivotal roles, leveraging their expertise in natural ingredient extraction and functional food ingredient formulation to meet diverse consumer demands.

These companies focus extensively on research and development to enhance the functional properties of DRM, including solubility, texture enhancement, and prebiotic benefits, thereby broadening applications in food, beverages, and nutraceutical products. To maintain competitive advantage, manufacturers are investing in advanced manufacturing technologies that enhance product purity and consistency while reducing production costs.

Strategic collaborations and long-term supply agreements with food and beverage manufacturers enable these key players to secure market presence and reach varied consumer segments efficiently. Additionally, an emphasis on regulatory compliance and clean-label formulations aligns with increased consumer demand for natural and health-promoting ingredients.

Report Scope - Digestion Resistant Maltodextrin Market

Items Values
Quantitative Units (2025) USD 604.4 million
Source Type Corn-Based, Wheat-Based, Potato-Based, Cassava-Based, Others (including tapioca and mixed starch sources)
Application Food (Breakfast Cereals, Dairy Products, Instant Puddings, Margarines and Butters, Salad Dressings, Sauces, Snack Foods, Others such as bakery products and confectionery), Beverages (Alcoholic and Non-Alcoholic), Nutraceuticals
Form Spray-Dried Powder, Instantized/Agglomerated
Regions Covered Asia Pacific, Western Europe, North America, Latin America, Eastern Europe, Middle East & Africa
Countries Covered China, Japan, India, United States, United Kingdom, Germany, France, and 40+ other countries
Key Companies Profiled Roquette Freres S.A., Ingredion Incorporated, Tate & Lyle, Grain Processing Corporation, Kraft Heinz Company, Cargill Incorporated, Archer Daniels Midland Company, Baolingbao Biology Co.Ltd, Tereos Syral S.A.S.
Additional Attributes Dollar sales by source type and application, growing demand for clean-label and fiber-enriched products, increasing digestive health awareness, expansion in functional foods and nutraceuticals, innovations in extraction and formulation technologies, and focus on regulatory compliance

Key Segments

By Source:

  • Corn-Based
  • Wheat-Based
  • Potato-Based
  • Cassava-Based
  • Others (including tapioca and mixed starch sources)

By Application:

  • Beverages
    • Alcoholic Beverages
    • Non-Alcoholic Beverages
  • Food
    • Breakfast Cereals
    • Dairy Products
    • Instant Puddings
    • Margarines and Butters
    • Salad Dressings
    • Sauces
    • Snack Foods
    • Others

By Form:

  • Spray-Dried Powder
  • Instantized/Agglomerated

By Region:

  • North America
  • Latin America
  • Western Europe
  • Eastern Europe
  • East Asia
  • South Asia & Pacific
  • Middle East and Africa

Table of Content

  1. Executive Summary
    • Global Market Outlook
    • Demand-side Trends
    • Supply-side Trends
    • Technology Roadmap Analysis
    • Analysis and Recommendations
  2. Market Overview
    • Market Coverage / Taxonomy
    • Market Definition / Scope / Limitations
  3. Market Background
    • Market Dynamics
      • Drivers
      • Restraints
      • Opportunity
      • Trends
    • Scenario Forecast
      • Demand in Optimistic Scenario
      • Demand in Likely Scenario
      • Demand in Conservative Scenario
    • Opportunity Map Analysis
    • Product Life Cycle Analysis
    • Supply Chain Analysis
      • Supply Side Participants and their Roles
        • Producers
        • Mid-Level Participants (Traders/ Agents/ Brokers)
        • Wholesalers and Distributors
      • Value Added and Value Created at Node in the Supply Chain
      • List of Raw Material Suppliers
      • List of Existing and Potential Buyer’s
    • Investment Feasibility Matrix
    • Value Chain Analysis
      • Profit Margin Analysis
      • Wholesalers and Distributors
      • Retailers
    • PESTLE and Porter’s Analysis
    • Regulatory Landscape
      • By Key Regions
      • By Key Countries
    • Regional Parent Market Outlook
    • Production and Consumption Statistics
    • Import and Export Statistics
  4. Global Market Analysis 2020 to 2024 and Forecast, 2025 to 2035
    • Historical Market Size Value (USD Million) & Volume (Metric Tons) Analysis, 2020 to 2024
    • Current and Future Market Size Value (USD Million) & Volume (Metric Tons) Projections, 2025 to 2035
      • Y-o-Y Growth Trend Analysis
      • Absolute $ Opportunity Analysis
  5. Global Market Pricing Analysis 2020 to 2024 and Forecast 2025 to 2035
  6. Global Market Analysis 2020 to 2024 and Forecast 2025 to 2035, By Source
    • Introduction / Key Findings
    • Historical Market Size Value (USD Million) & Volume (Metric Tons) Analysis By Source, 2020 to 2024
    • Current and Future Market Size Value (USD Million) & Volume (Metric Tons) Analysis and Forecast By Source, 2025 to 2035
      • Corn-Based
      • Wheat-Based
      • Potato-Based
      • Cassava-Based
      • Others (including tapioca and mixed starch sources)
    • Y-o-Y Growth Trend Analysis By Source, 2020 to 2024
    • Absolute $ Opportunity Analysis By Source, 2025 to 2035
  7. Global Market Analysis 2020 to 2024 and Forecast 2025 to 2035, By Application
    • Introduction / Key Findings
    • Historical Market Size Value (USD Million) & Volume (Metric Tons) Analysis By Application, 2020 to 2024
    • Current and Future Market Size Value (USD Million) & Volume (Metric Tons) Analysis and Forecast By Application, 2025 to 2035
      • Beverages
        • Alcoholic Beverages
        • Non-Alcoholic Beverages
      • Food
        • Breakfast Cereals
        • Dairy Products
        • Instant Puddings
        • Margarines and Butters
        • Salad Dressings
        • Sauces
        • Snack Foods
        • Others
      • Nutraceuticals
    • Y-o-Y Growth Trend Analysis By Application, 2020 to 2024
    • Absolute $ Opportunity Analysis By Application, 2025 to 2035
  8. Global Market Analysis 2020 to 2024 and Forecast 2025 to 2035, By Form
    • Introduction / Key Findings
    • Historical Market Size Value (USD Million) & Volume (Metric Tons) Analysis By Form, 2020 to 2024
    • Current and Future Market Size Value (USD Million) & Volume (Metric Tons) Analysis and Forecast By Form, 2025 to 2035
      • Spray-Dried Powder
      • Instantized/Agglomerated
    • Y-o-Y Growth Trend Analysis By Form, 2020 to 2024
    • Absolute $ Opportunity Analysis By Form, 2025 to 2035
  9. Global Market Analysis 2020 to 2024 and Forecast 2025 to 2035, By Region
    • Introduction
    • Historical Market Size Value (USD Million) & Volume (Metric Tons) Analysis By Region, 2020 to 2024
    • Current Market Size Value (USD Million) & Volume (Metric Tons) Analysis and Forecast By Region, 2025 to 2035
      • North America
      • Latin America
      • Western Europe
      • Eastern Europe
      • East Asia
      • South Asia & Pacific
      • Middle East and Africa
    • Market Attractiveness Analysis By Region
  10. North America Market Analysis 2020 to 2024 and Forecast 2025 to 2035, By Country
    • Historical Market Size Value (USD Million) & Volume (Metric Tons) Trend Analysis By Market Taxonomy, 2020 to 2024
    • Market Size Value (USD Million) & Volume (Metric Tons) Forecast By Market Taxonomy, 2025 to 2035
      • By Country
        • USA
        • Canada
        • Mexico
      • By Source
      • By Application
      • By Form
    • Market Attractiveness Analysis
      • By Country
      • By Source
      • By Application
      • By Form
    • Key Takeaways
  11. Latin America Market Analysis 2020 to 2024 and Forecast 2025 to 2035, By Country
    • Historical Market Size Value (USD Million) & Volume (Metric Tons) Trend Analysis By Market Taxonomy, 2020 to 2024
    • Market Size Value (USD Million) & Volume (Metric Tons) Forecast By Market Taxonomy, 2025 to 2035
      • By Country
        • Brazil
        • Argentina
        • Rest of LATAM
      • By Source
      • By Application
      • By Form
    • Market Attractiveness Analysis
      • By Country
      • By Source
      • By Application
      • By Form
    • Key Takeaways
  12. Western Europe Market Analysis 2020 to 2024 and Forecast 2025 to 2035, By Country
    • Historical Market Size Value (USD Million) & Volume (Metric Tons) Trend Analysis By Market Taxonomy, 2020 to 2024
    • Market Size Value (USD Million) & Volume (Metric Tons) Forecast By Market Taxonomy, 2025 to 2035
      • By Country
        • Germany
        • Italy
        • France
        • UK
        • Spain
        • BENELUX
        • Nordic
        • Rest of W.Europe
      • By Source
      • By Application
      • By Form
    • Market Attractiveness Analysis
      • By Country
      • By Source
      • By Application
      • By Form
    • Key Takeaways
  13. Eastern Europe Market Analysis 2020 to 2024 and Forecast 2025 to 2035, By Country
    • Historical Market Size Value (USD Million) & Volume (Metric Tons) Trend Analysis By Market Taxonomy, 2020 to 2024
    • Market Size Value (USD Million) & Volume (Metric Tons) Forecast By Market Taxonomy, 2025 to 2035
      • By Country
        • Russia
        • Hungary
        • Poland
        • Balkan & Baltics
        • Rest of E. Europe
      • By Source
      • By Application
      • By Form
    • Market Attractiveness Analysis
      • By Country
      • By Source
      • By Application
      • By Form
    • Key Takeaways
  14. East Asia Market Analysis 2020 to 2024 and Forecast 2025 to 2035, By Country
    • Historical Market Size Value (USD Million) & Volume (Metric Tons) Trend Analysis By Market Taxonomy, 2020 to 2024
    • Market Size Value (USD Million) & Volume (Metric Tons) Forecast By Market Taxonomy, 2025 to 2035
      • By Country
        • China
        • Japan
        • South Korea
      • By Source
      • By Application
      • By Form
    • Market Attractiveness Analysis
      • By Country
      • By Source
      • By Application
      • By Form
    • Key Takeaways
  15. South Asia & Pacific Market Analysis 2020 to 2024 and Forecast 2025 to 2035, By Country
    • Historical Market Size Value (USD Million) & Volume (Metric Tons) Trend Analysis By Market Taxonomy, 2020 to 2024
    • Market Size Value (USD Million) & Volume (Metric Tons) Forecast By Market Taxonomy, 2025 to 2035
      • By Country
        • India
        • Australia & New Zealand
        • ASEAN
        • Rest of SAP
      • By Source
      • By Application
      • By Form
    • Market Attractiveness Analysis
      • By Country
      • By Source
      • By Application
      • By Form
    • Key Takeaways
  16. Middle East and Africa Market Analysis 2020 to 2024 and Forecast 2025 to 2035, By Country
    • Historical Market Size Value (USD Million) & Volume (Metric Tons) Trend Analysis By Market Taxonomy, 2020 to 2024
    • Market Size Value (USD Million) & Volume (Metric Tons) Forecast By Market Taxonomy, 2025 to 2035
      • By Country
        • GCC Countries
        • Northern Africa
        • South Africa
        • Turkiye
        • Rest of MEA
      • By Source
      • By Application
      • By Form
    • Market Attractiveness Analysis
      • By Country
      • By Source
      • By Application
      • By Form
    • Key Takeaways
  17. Key Countries Market Analysis
    • USA
      • Pricing Analysis
      • Market Share Analysis, 2024
        • By Source
        • By Application
        • By Form
    • Canada
      • Pricing Analysis
      • Market Share Analysis, 2024
        • By Source
        • By Application
        • By Form
    • Brazil
      • Pricing Analysis
      • Market Share Analysis, 2024
        • By Source
        • By Application
        • By Form
    • Mexico
      • Pricing Analysis
      • Market Share Analysis, 2024
        • By Source
        • By Application
        • By Form
    • Argentina
      • Pricing Analysis
      • Market Share Analysis, 2024
        • By Source
        • By Application
        • By Form
  18. Market Structure Analysis
    • Competition Dashboard
    • Competition Benchmarking
    • Market Share Analysis of Top Players
      • By Regional
      • By Source
      • By Application
      • By Form
  19. Competition Analysis
    • Competition Deep Dive
      • Roquette Freres S.A.
        • Overview
        • Product Portfolio
        • Profitability by Market Segments (Product/Age /Sales Channel/Region)
        • Sales Footprint
        • Strategy Overview
          • Marketing Strategy
          • Product Strategy
          • Channel Strategy
      • Ingredion Incorporated
        • Overview
        • Product Portfolio
        • Profitability by Market Segments (Product/Age /Sales Channel/Region)
        • Sales Footprint
        • Strategy Overview
          • Marketing Strategy
          • Product Strategy
          • Channel Strategy
      • Tate & Lyle
        • Overview
        • Product Portfolio
        • Profitability by Market Segments (Product/Age /Sales Channel/Region)
        • Sales Footprint
        • Strategy Overview
          • Marketing Strategy
          • Product Strategy
          • Channel Strategy
      • Grain Processing Corporation
        • Overview
        • Product Portfolio
        • Profitability by Market Segments (Product/Age /Sales Channel/Region)
        • Sales Footprint
        • Strategy Overview
          • Marketing Strategy
          • Product Strategy
          • Channel Strategy
      • Kraft Heinz Company
        • Overview
        • Product Portfolio
        • Profitability by Market Segments (Product/Age /Sales Channel/Region)
        • Sales Footprint
        • Strategy Overview
          • Marketing Strategy
          • Product Strategy
          • Channel Strategy
      • Cargill Incorporated
        • Overview
        • Product Portfolio
        • Profitability by Market Segments (Product/Age /Sales Channel/Region)
        • Sales Footprint
        • Strategy Overview
          • Marketing Strategy
          • Product Strategy
          • Channel Strategy
      • Archer Daniels Midland Company
        • Overview
        • Product Portfolio
        • Profitability by Market Segments (Product/Age /Sales Channel/Region)
        • Sales Footprint
        • Strategy Overview
          • Marketing Strategy
          • Product Strategy
          • Channel Strategy
      • Baolingbao Biology Co.Ltd
        • Overview
        • Product Portfolio
        • Profitability by Market Segments (Product/Age /Sales Channel/Region)
        • Sales Footprint
        • Strategy Overview
          • Marketing Strategy
          • Product Strategy
          • Channel Strategy
      • Tereos Syral S.A.S.
        • Overview
        • Product Portfolio
        • Profitability by Market Segments (Product/Age /Sales Channel/Region)
        • Sales Footprint
        • Strategy Overview
          • Marketing Strategy
          • Product Strategy
          • Channel Strategy
  20. Assumptions & Acronyms Used
  21. Research Methodology

List of Tables

  • Table 1: Global Market Value (USD Million) Forecast by Region, 2020-2035
  • Table 2: Global Market Volume (Metric Tons) Forecast by Region, 2020-2035
  • Table 3: Global Market Value (USD Million) Forecast by Source, 2020-2035
  • Table 4: Global Market Volume (Metric Tons) Forecast by Source, 2020-2035
  • Table 5: Global Market Value (USD Million) Forecast by Application, 2020-2035
  • Table 6: Global Market Volume (Metric Tons) Forecast by Application, 2020-2035
  • Table 7: Global Market Value (USD Million) Forecast by Form, 2020-2035
  • Table 8: Global Market Volume (Metric Tons) Forecast by Form, 2020-2035
  • Table 9: North America Market Value (USD Million) Forecast by Country, 2020-2035
  • Table 10: North America Market Volume (Metric Tons) Forecast by Country, 2020-2035
  • Table 11: North America Market Value (USD Million) Forecast by Source, 2020-2035
  • Table 12: North America Market Volume (Metric Tons) Forecast by Source, 2020-2035
  • Table 13: North America Market Value (USD Million) Forecast by Application, 2020-2035
  • Table 14: North America Market Volume (Metric Tons) Forecast by Application, 2020-2035
  • Table 15: North America Market Value (USD Million) Forecast by Form, 2020-2035
  • Table 16: North America Market Volume (Metric Tons) Forecast by Form, 2020-2035
  • Table 17: Latin America Market Value (USD Million) Forecast by Country, 2020-2035
  • Table 18: Latin America Market Volume (Metric Tons) Forecast by Country, 2020-2035
  • Table 19: Latin America Market Value (USD Million) Forecast by Source, 2020-2035
  • Table 20: Latin America Market Volume (Metric Tons) Forecast by Source, 2020-2035
  • Table 21: Latin America Market Value (USD Million) Forecast by Application, 2020-2035
  • Table 22: Latin America Market Volume (Metric Tons) Forecast by Application, 2020-2035
  • Table 23: Latin America Market Value (USD Million) Forecast by Form, 2020-2035
  • Table 24: Latin America Market Volume (Metric Tons) Forecast by Form, 2020-2035
  • Table 25: Western Europe Market Value (USD Million) Forecast by Country, 2020-2035
  • Table 26: Western Europe Market Volume (Metric Tons) Forecast by Country, 2020-2035
  • Table 27: Western Europe Market Value (USD Million) Forecast by Source, 2020-2035
  • Table 28: Western Europe Market Volume (Metric Tons) Forecast by Source, 2020-2035
  • Table 29: Western Europe Market Value (USD Million) Forecast by Application, 2020-2035
  • Table 30: Western Europe Market Volume (Metric Tons) Forecast by Application, 2020-2035
  • Table 31: Western Europe Market Value (USD Million) Forecast by Form, 2020-2035
  • Table 32: Western Europe Market Volume (Metric Tons) Forecast by Form, 2020-2035
  • Table 33: Eastern Europe Market Value (USD Million) Forecast by Country, 2020-2035
  • Table 34: Eastern Europe Market Volume (Metric Tons) Forecast by Country, 2020-2035
  • Table 35: Eastern Europe Market Value (USD Million) Forecast by Source, 2020-2035
  • Table 36: Eastern Europe Market Volume (Metric Tons) Forecast by Source, 2020-2035
  • Table 37: Eastern Europe Market Value (USD Million) Forecast by Application, 2020-2035
  • Table 38: Eastern Europe Market Volume (Metric Tons) Forecast by Application, 2020-2035
  • Table 39: Eastern Europe Market Value (USD Million) Forecast by Form, 2020-2035
  • Table 40: Eastern Europe Market Volume (Metric Tons) Forecast by Form, 2020-2035
  • Table 41: East Asia Market Value (USD Million) Forecast by Country, 2020-2035
  • Table 42: East Asia Market Volume (Metric Tons) Forecast by Country, 2020-2035
  • Table 43: East Asia Market Value (USD Million) Forecast by Source, 2020-2035
  • Table 44: East Asia Market Volume (Metric Tons) Forecast by Source, 2020-2035
  • Table 45: East Asia Market Value (USD Million) Forecast by Application, 2020-2035
  • Table 46: East Asia Market Volume (Metric Tons) Forecast by Application, 2020-2035
  • Table 47: East Asia Market Value (USD Million) Forecast by Form, 2020-2035
  • Table 48: East Asia Market Volume (Metric Tons) Forecast by Form, 2020-2035
  • Table 49: South Asia & Pacific Market Value (USD Million) Forecast by Country, 2020-2035
  • Table 50: South Asia & Pacific Market Volume (Metric Tons) Forecast by Country, 2020-2035
  • Table 51: South Asia & Pacific Market Value (USD Million) Forecast by Source, 2020-2035
  • Table 52: South Asia & Pacific Market Volume (Metric Tons) Forecast by Source, 2020-2035
  • Table 53: South Asia & Pacific Market Value (USD Million) Forecast by Application, 2020-2035
  • Table 54: South Asia & Pacific Market Volume (Metric Tons) Forecast by Application, 2020-2035
  • Table 55: South Asia & Pacific Market Value (USD Million) Forecast by Form, 2020-2035
  • Table 56: South Asia & Pacific Market Volume (Metric Tons) Forecast by Form, 2020-2035
  • Table 57: Middle East and Africa Market Value (USD Million) Forecast by Country, 2020-2035
  • Table 58: Middle East and Africa Market Volume (Metric Tons) Forecast by Country, 2020-2035
  • Table 59: Middle East and Africa Market Value (USD Million) Forecast by Source, 2020-2035
  • Table 60: Middle East and Africa Market Volume (Metric Tons) Forecast by Source, 2020-2035
  • Table 61: Middle East and Africa Market Value (USD Million) Forecast by Application, 2020-2035
  • Table 62: Middle East and Africa Market Volume (Metric Tons) Forecast by Application, 2020-2035
  • Table 63: Middle East and Africa Market Value (USD Million) Forecast by Form, 2020-2035
  • Table 64: Middle East and Africa Market Volume (Metric Tons) Forecast by Form, 2020-2035

List of Figures

  • Figure 1: Global Market Volume (Metric Tons) Forecast 2020-2035
  • Figure 2: Global Market Pricing Analysis
  • Figure 3: Global Market Value (USD Million) Forecast 2020-2035
  • Figure 4: Global Market Value Share and BPS Analysis by Source, 2025 and 2035
  • Figure 5: Global Market Y-o-Y Growth Comparison by Source, 2025-2035
  • Figure 6: Global Market Attractiveness Analysis by Source
  • Figure 7: Global Market Value Share and BPS Analysis by Application, 2025 and 2035
  • Figure 8: Global Market Y-o-Y Growth Comparison by Application, 2025-2035
  • Figure 9: Global Market Attractiveness Analysis by Application
  • Figure 10: Global Market Value Share and BPS Analysis by Form, 2025 and 2035
  • Figure 11: Global Market Y-o-Y Growth Comparison by Form, 2025-2035
  • Figure 12: Global Market Attractiveness Analysis by Form
  • Figure 13: Global Market Value (USD Million) Share and BPS Analysis by Region, 2025 and 2035
  • Figure 14: Global Market Y-o-Y Growth Comparison by Region, 2025-2035
  • Figure 15: Global Market Attractiveness Analysis by Region
  • Figure 16: North America Market Incremental $ Opportunity, 2025-2035
  • Figure 17: Latin America Market Incremental $ Opportunity, 2025-2035
  • Figure 18: Western Europe Market Incremental $ Opportunity, 2025-2035
  • Figure 19: Eastern Europe Market Incremental $ Opportunity, 2025-2035
  • Figure 20: East Asia Market Incremental $ Opportunity, 2025-2035
  • Figure 21: South Asia & Pacific Market Incremental $ Opportunity, 2025-2035
  • Figure 22: Middle East and Africa Market Incremental $ Opportunity, 2025-2035
  • Figure 23: North America Market Value Share and BPS Analysis by Country, 2025 and 2035
  • Figure 24: North America Market Value Share and BPS Analysis by Source, 2025 and 2035
  • Figure 25: North America Market Y-o-Y Growth Comparison by Source, 2025-2035
  • Figure 26: North America Market Attractiveness Analysis by Source
  • Figure 27: North America Market Value Share and BPS Analysis by Application, 2025 and 2035
  • Figure 28: North America Market Y-o-Y Growth Comparison by Application, 2025-2035
  • Figure 29: North America Market Attractiveness Analysis by Application
  • Figure 30: North America Market Value Share and BPS Analysis by Form, 2025 and 2035
  • Figure 31: North America Market Y-o-Y Growth Comparison by Form, 2025-2035
  • Figure 32: North America Market Attractiveness Analysis by Form
  • Figure 33: Latin America Market Value Share and BPS Analysis by Country, 2025 and 2035
  • Figure 34: Latin America Market Value Share and BPS Analysis by Source, 2025 and 2035
  • Figure 35: Latin America Market Y-o-Y Growth Comparison by Source, 2025-2035
  • Figure 36: Latin America Market Attractiveness Analysis by Source
  • Figure 37: Latin America Market Value Share and BPS Analysis by Application, 2025 and 2035
  • Figure 38: Latin America Market Y-o-Y Growth Comparison by Application, 2025-2035
  • Figure 39: Latin America Market Attractiveness Analysis by Application
  • Figure 40: Latin America Market Value Share and BPS Analysis by Form, 2025 and 2035
  • Figure 41: Latin America Market Y-o-Y Growth Comparison by Form, 2025-2035
  • Figure 42: Latin America Market Attractiveness Analysis by Form
  • Figure 43: Western Europe Market Value Share and BPS Analysis by Country, 2025 and 2035
  • Figure 44: Western Europe Market Value Share and BPS Analysis by Source, 2025 and 2035
  • Figure 45: Western Europe Market Y-o-Y Growth Comparison by Source, 2025-2035
  • Figure 46: Western Europe Market Attractiveness Analysis by Source
  • Figure 47: Western Europe Market Value Share and BPS Analysis by Application, 2025 and 2035
  • Figure 48: Western Europe Market Y-o-Y Growth Comparison by Application, 2025-2035
  • Figure 49: Western Europe Market Attractiveness Analysis by Application
  • Figure 50: Western Europe Market Value Share and BPS Analysis by Form, 2025 and 2035
  • Figure 51: Western Europe Market Y-o-Y Growth Comparison by Form, 2025-2035
  • Figure 52: Western Europe Market Attractiveness Analysis by Form
  • Figure 53: Eastern Europe Market Value Share and BPS Analysis by Country, 2025 and 2035
  • Figure 54: Eastern Europe Market Value Share and BPS Analysis by Source, 2025 and 2035
  • Figure 55: Eastern Europe Market Y-o-Y Growth Comparison by Source, 2025-2035
  • Figure 56: Eastern Europe Market Attractiveness Analysis by Source
  • Figure 57: Eastern Europe Market Value Share and BPS Analysis by Application, 2025 and 2035
  • Figure 58: Eastern Europe Market Y-o-Y Growth Comparison by Application, 2025-2035
  • Figure 59: Eastern Europe Market Attractiveness Analysis by Application
  • Figure 60: Eastern Europe Market Value Share and BPS Analysis by Form, 2025 and 2035
  • Figure 61: Eastern Europe Market Y-o-Y Growth Comparison by Form, 2025-2035
  • Figure 62: Eastern Europe Market Attractiveness Analysis by Form
  • Figure 63: East Asia Market Value Share and BPS Analysis by Country, 2025 and 2035
  • Figure 64: East Asia Market Value Share and BPS Analysis by Source, 2025 and 2035
  • Figure 65: East Asia Market Y-o-Y Growth Comparison by Source, 2025-2035
  • Figure 66: East Asia Market Attractiveness Analysis by Source
  • Figure 67: East Asia Market Value Share and BPS Analysis by Application, 2025 and 2035
  • Figure 68: East Asia Market Y-o-Y Growth Comparison by Application, 2025-2035
  • Figure 69: East Asia Market Attractiveness Analysis by Application
  • Figure 70: East Asia Market Value Share and BPS Analysis by Form, 2025 and 2035
  • Figure 71: East Asia Market Y-o-Y Growth Comparison by Form, 2025-2035
  • Figure 72: East Asia Market Attractiveness Analysis by Form
  • Figure 73: South Asia & Pacific Market Value Share and BPS Analysis by Country, 2025 and 2035
  • Figure 74: South Asia & Pacific Market Value Share and BPS Analysis by Source, 2025 and 2035
  • Figure 75: South Asia & Pacific Market Y-o-Y Growth Comparison by Source, 2025-2035
  • Figure 76: South Asia & Pacific Market Attractiveness Analysis by Source
  • Figure 77: South Asia & Pacific Market Value Share and BPS Analysis by Application, 2025 and 2035
  • Figure 78: South Asia & Pacific Market Y-o-Y Growth Comparison by Application, 2025-2035
  • Figure 79: South Asia & Pacific Market Attractiveness Analysis by Application
  • Figure 80: South Asia & Pacific Market Value Share and BPS Analysis by Form, 2025 and 2035
  • Figure 81: South Asia & Pacific Market Y-o-Y Growth Comparison by Form, 2025-2035
  • Figure 82: South Asia & Pacific Market Attractiveness Analysis by Form
  • Figure 83: Middle East and Africa Market Value Share and BPS Analysis by Country, 2025 and 2035
  • Figure 84: Middle East and Africa Market Value Share and BPS Analysis by Source, 2025 and 2035
  • Figure 85: Middle East and Africa Market Y-o-Y Growth Comparison by Source, 2025-2035
  • Figure 86: Middle East and Africa Market Attractiveness Analysis by Source
  • Figure 87: Middle East and Africa Market Value Share and BPS Analysis by Application, 2025 and 2035
  • Figure 88: Middle East and Africa Market Y-o-Y Growth Comparison by Application, 2025-2035
  • Figure 89: Middle East and Africa Market Attractiveness Analysis by Application
  • Figure 90: Middle East and Africa Market Value Share and BPS Analysis by Form, 2025 and 2035
  • Figure 91: Middle East and Africa Market Y-o-Y Growth Comparison by Form, 2025-2035
  • Figure 92: Middle East and Africa Market Attractiveness Analysis by Form
  • Figure 93: Global Market - Tier Structure Analysis
  • Figure 94: Global Market - Company Share Analysis

Frequently Asked Questions

How big is the digestion resistant maltodextrin market in 2025?

The global digestion resistant maltodextrin market is estimated to be valued at USD 604.4 million in 2025.

What will be the size of digestion resistant maltodextrin market in 2035?

The market size for digestion resistant maltodextrin is projected to reach USD 1,145.2 million by 2035.

How much will be the digestion resistant maltodextrin market growth between 2025 and 2035?

The digestion resistant maltodextrin market is expected to grow at a 6.6% CAGR between 2025 and 2035.

Which source type is projected to lead in the digestion resistant maltodextrin market in 2025?

The corn-based segment is projected to lead in the digestion resistant maltodextrin market with 25% market share in 2025.

Which application segment is expected to contribute significant share in the digestion resistant maltodextrin market in 2025?

In terms of application, the food segment is projected to command 67% share in the digestion resistant maltodextrin market in 2025.

Explore Similar Insights

Future Market Insights

Digestion Resistant Maltodextrin Market

Chat With

MaRIA

Hi There, I am MaRIA, Your Market Research Intelligence Assistant. How may I help you?