PD1 Resistant Head and Neck Cancer Market
Market Insights on PD1 Resistant Head and Neck Cancer covering sales outlook, demand forecast & up-to-date key trends
PD1 Resistant Head and Neck Cancer Market by Product & Region – Forecast 2023–2033
PD1 Resistant Head and Neck Cancer Market Snapshot (2023-2033)
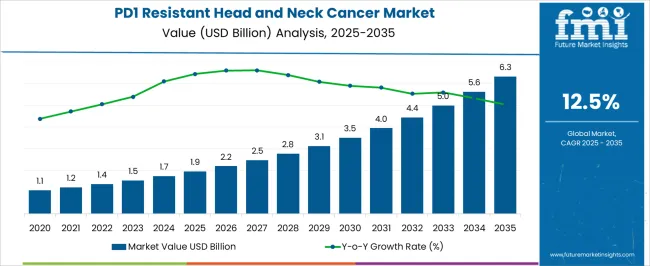
The global PD1 resistant head and neck cancer market is expected to reach a valuation of US$ 1.54 Billion in 2023 and is projected to reach US$ 5 Billion by 2033, with a CAGR of 12.5%. Growing geriatric population and rising number of initiatives by government and non-governmental organizations such as Support for People with Oral and PD1 Resistant Head and Neck Cancer(SPOHNC) is creating a highly conducive environment for growth of the global PD1 resistant head and neck cancer market.
The robust presence of product pipeline and their expected launch will fuell the market growth. Some of the products in the pipeline are Tipifarnib (Farnesyltransferase Inhibitor), tiragolumab (anti-TIGIT), Tecentriq (atezolizumab), Rozlytrek (entrectinib), and Afatinib. Successful completion of trials and consequent approval is expected to drive market growth over the forecast period. In February 2021, the U.S. FDA granted breakthrough therapy designation to Tipifarnib developed by Kura Oncology, Inc., for the treatment of patients with head and neck squamous cell carcinoma (HNSCC). This is a potent, selective, and orally administered drug which will aid in market expansion.
The increasing prevalence of PD1 Resistant Head and Neck Cancerdue to several factors such as alcohol consumption, tobacco consumption, Epstein-Barr virus (EBV) infection, and human papillomavirus (HPV) infection is significantly propelling the demand for the PD1 Resistant Head and Neck Cancerdrugs that bolsters HNC therapeutics market.
Report Attribute |
Details |
Expected Market Value (2023) |
US$ 1.54 Billion |
Anticipated Forecast Value (2033) |
US$ 5 Billion |
Projected Growth Rate (2023-2033) |
CAGR 12.5% |
Let us know your requirement to get
100% FREE customization
2018-2022 PD1 Resistant Head and Neck Cancer Treatment Demand Analysis vs. Forecast 2023-2033
The PD1 Resistant Head and Neck Cancer Market was growing at a CAGR of 10.1% while valuing at US$ 1 Billion during the historical period. The rapidly growing pharmaceutical industry and the rising expenditure by the top market players in the research and development and the availability of the various pipeline drugs such as Atezolizumab, Afatinib, and Ipilimumab are fuelling the market growth. Considering these factors HNC market is projected to reach US$ 5 Billion with a CAGR of 12.5% during the forecast period.
Which are Some Prominent Drivers of the PD1 Resistant Head and Neck Cancer Market?
Advances in biochemistry and Genomics to propel market growth
The advancements in the non-surgical procedures and therapies such as immunotherapy and targeted therapy are supporting the adoption rate of PD1 resistant head and neck cancer drugs among the patients across the globe. The availability of advanced diagnostic tools to diagnose various types of cancer and tumors is driving the market growth.
The increasing awareness among the population regarding the availability of effective and innovative drugs to treat cancer coupled with rising healthcare expenditure is fuelling the PD1 resistant head and neck cancer market growth. Swiftly growing biopharmaceutical industry and the rising penetration of the online pharmacies are the major factors that are anticipated to augment the growth of the market during the forecast period.
Moreover, several developmental strategies such as partnerships, new product launches, and adoption of latest technologies impact the market positively and drive the industry’s growth. The growing expenditure by the top market players in the research and development and the availability of the various pipeline drugs such as Atezolizumab, Afatinib, and Ipilimumab are also aiding in market expansion.
Find your sweet spots for generating winning opportunities in this market.
Talk to AnalystWhat are the Challenges Projected to be Faced by the Market?
High rate of complications to restrain market expansion
Rising treatment costs, an increase in the adverse effects associated with the use of PD1 Resistant Head and Neck Cancerdrugs, high rate of complications, dearth of early cancer detection and lack of awareness among patients and physicians about head and neck treatment are the major factors acting as restraints, and will further hinder the PD1 Resistant Head and Neck Cancerdrug market during the forecast period. Moreover, dearth of proper healthcare facilities and oncology professionals across some developing and underdeveloped regions is also restricting market expansion.
Region-Wise Insights
North America dominates the PD1 Resistant Head and Neck Cancer Market
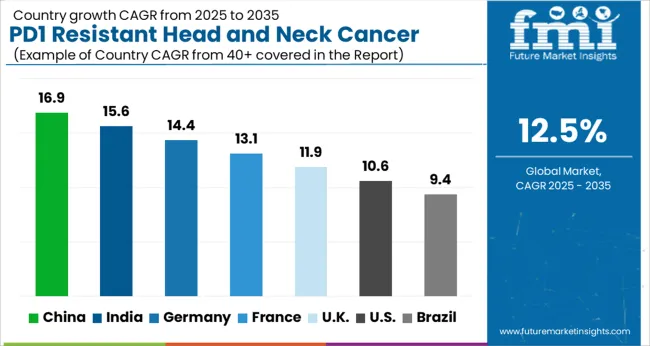
North American PD1 resistant head and neck cancer market accounted for 46% market share in 2022. It is estimated to retain its dominance while exhibiting a CAGR of 11.1% during the forecast period. In this region, US market is expected to gross a market value of US$ 850 Million by end of the forecast period.
The presence of advanced healthcare infrastructure, robust product pipeline increased healthcare expenditure, favourable reimbursement policies, improved access to the advanced diagnostic devices are the major factors that drive the growth of the PD1 Resistant Head and Neck Cancerdrugs market in North American region.
Launch of Premium Immunotherapies to drive the Market in APAC
In Asia Pacific, the market is projected to grow with fastest CAGR of 11.5% with market valuation to reach US$ 425 Million by 2033. The growing geriatric population and increasing prescription of immunotherapy drugs such as Pembrolizumab (Keytruda) and Nivolumab (Opdivo) for the treatment of various types of HNC are anticipated to drive market growth in coming years. China is expected to dominate the market in this region with a market valuation of around US$ 250 Million. Moreover, market in Japan will be fuelled with a CAGR of 11%. Additionally, Indian market will witness a CAGR of 11.2% during the forecast period.
Currently, four targeted therapies are existing in the APAC HNC market, which are Erbitux, BIOMAb EGFR, Opdivo and Keytruda. The remainder of this market is composed of generics. Recent additions to the market have highlighted that the treatment landscape is diversifying and becoming less dependent on chemotherapy options.
With the approval of Keytruda in Australia, and Opdivo in Australia, South Korea and Japan, there has been a rise in targeted therapy options. Additionally, avelumab (a PD-L1 inhibitor) is likely to be approved in APAC countries at the end of 2033, as it is currently undergoing Phase III trials in Japan, Australia, and South Korea.
Increasing demand for efficient drugs for treatment of HNCs in emerging economies such as China and India, growing pharmaceutical industry, and rapidly increasing patient population are expected to fuel the growth of the market in Asia Pacific during the forecast period.

A unified Market Research Subscription Platform, built for today's disparate research needs.
Category wise Insights
High efficacy of EGFR to augment the Segment Growth
The increasing special drug designations and the high efficacy of EGFR inhibitors in the treatment of cancer indications e.g., lung cancer, colorectal cancer, and breast cancer will result in quicker approval during the clinical stages.
Thus, the robust prevalence of major cancer indications will be a significant factor driving epidermal growth factor receptor inhibitors market during the forecast period.
PDL 1 Inhibitors to dominate the segment by Product Type
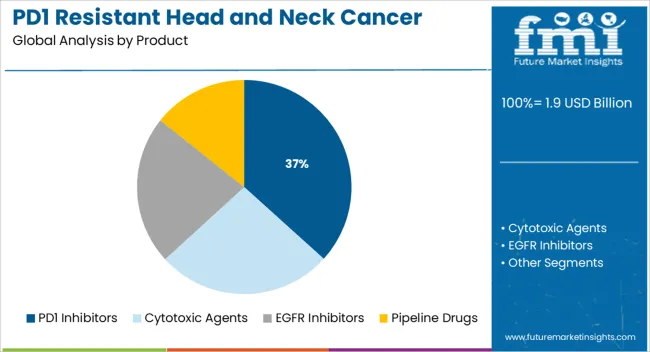
The PD-1 inhibitors segment is projected to dominate the market owing to the increased volume of research activities, approvals, and increase in prescriptions of these drugs such as nivolumab and pembrolizumab. Furthermore, rising adoption of pembrolizumab (KEYTRUDA), due to its proven efficiency to treat multiple FDA-Approved indications like melanoma, non–small cell lung cancer (NSCLC), head and neck squamous cell cancer (HNSCC), has also positively influenced the segment growth.
Additionally, the PD-L1 inhibitor segment is anticipated to witness the fastest CAGR during the forecast period owing to a sharp rise in the adoption of durvalumab (IMFINZI), avelumab (BAVENCIO), and others in the segment. Huge investments by the key players in the development of these products are further anticipated to fuel the segment growth over the forecast period.
Start-ups in PD1 Resistant Head and Neck Cancer Market
- Founded in 2006, Dr Harvard is a Los Angeles-based company that provides immunotherapy for cancer and infectious disease. Its technology is based upon natural killer cells; they have developed NK cell from the cell line. Currently, it has five immunotherapeutic vaccines in various stages of development. VBAC-C for the treatment of cervical cancer, PD1 Resistant Head and Neck Cancerdisease and BVAC-B for treatment of gastric cancer, breast cancer, lung cancer diseases are in ongoing clinical trial studies.
- Founded in 2012, Canget BioTekpharma is a US-based biopharma company formed from a collaboration of multiple academic and clinical research groups and was spun-off from Roswell Park Cancer Center. The company focuses on developing targeted anti-cancer agents. The company either partners with other pharmaceutical companies, or work on a contract to provide disease models for their clients' discovery programs. The company currently has multiple drugs in early or preclinical development for colon cancer, head and neck cancer, pancreatic cancer, ovarian cancer, mesothelioma, retinoblastoma, prostate cancer, among others. It received a funding of USD 25K
Market Competition
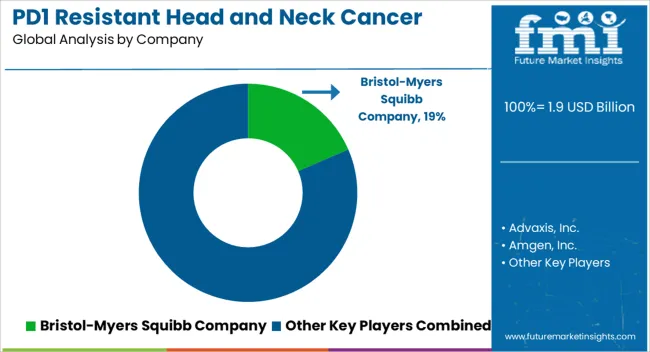
Key players in the PD1 Resistant Head and Neck Cancer Market are: Advaxis, Inc, Amgen, Inc., AstraZeneca plc, Boehringer Ingelheim GmbH, Bristol-Myers Squibb Company, Cel-Sci Corporation, GlaxoSmithKline plc, Incyte Corporation, Merck KGaA, Novartis AG.
Some Recent Developments in this industry are:
- In February 2020, Galera Therapeutics, Inc., announced that Avasopasem manganese (GC4419), a novel drug molecule is in their pipeline. Avasopasem manganese (GC4419), the candidate drug molecule is being developed for reducing the severe oral mucositis (SOD) which is normally induced due to radiotherapy. Avasopasem manganese (GC4419) selectively and rapidly convert superoxide into hydrogen peroxide and oxygen, which in turn protect the normal tissues from the ill-effects of superoxide. If the condition is left untreated, the superoxide can attack and damage the non-cancerous tissue, leading to many side-effects, which can limit the efficiency of radiotherapy in the patients.
- In July 2022, Bristol Myers Squibb received positive Committee for Medicinal Products for Human Use (CHMP) opinion recommending approval for LAG-3-blocking antibody combination Opdualag (nivolumab and relatlimab) for the treatment of patients with unresectable or metastatic melanoma.
- In October 2021, Merck received the United States Food and Drug Administration (FDA) approval for KEYTRUDA, Merck’s anti-PD-1 therapy, in combination with chemotherapy, with or without bevacizumab, for the treatment of patients with persistent, recurrent, or metastatic cervical cancer whose tumors express PD-L1, as determined by an FDA-approved test.
- In February 2020, Nanobiotix, a nanomedicine company announced that the U.S. Food and Drug Administration (U.S. FDA) granted fast track designation for the radioenhancer NBTXR3, in the presence or absence of Cetuximab for the treatment of patients suffering from locally advanced head and neck squamous cell cancer and are not eligible for platinum-based chemotherapy. During the phase I/II of the clinical trials, the patients suffering from head and neck cancer, showed complete or partial response to the treatment. Therefore, the company plans to initiate phase III of the clinical trials in order to further assess the treatment of NBTXR3 for the head and neck cancer.
- In January, 2020, The John Hopkins University announced that they planned to launch treatment de-escalation trial i.e., for patients suffering from HPV related PD1 Resistant Head and Neck Cancerand responding to the low intensity of treatments, such patients would be subjected for immunotherapy treatment followed by surgery. While the patients suffering from traditional head and neck cancers would be treated with half doses of chemotherapy and radiotherapy. After this treatment, if the remainings of HPV observed in the saliva and blood of these treated patients, then they will be treated with immunotherapy, in order to eliminate the chance of relapse.
- In June, 2019, Merck & Co., Inc., announced the U.S. Food and Drug Administration (U.S. FDA) approval for pembrolizumab for the first-line treatment of patients with metastatic or recurrent head and neck squamous cell carcinoma (HNSCC).
Report Scope
Report Attribute |
Details |
Market Value in 2023 |
US$ 1.54 Billion |
Market Value in 2033 |
US$ 5 Billion |
Growth Rate |
CAGR of 12.5% from 2023 to 2033 |
Base Year for Estimation |
2022 |
Historical Data |
2018-2022 |
Forecast Period |
2023-2033 |
Quantitative Units |
Revenue in US$ Billion and million and CAGR from 2023-2033 |
Report Coverage |
Revenue Forecast, Volume Forecast, Company Ranking, Competitive Landscape, Growth Factors, Trends and Pricing Analysis |
Segments Covered |
|
Regions Covered |
|
Key Countries Profiled |
|
Key Companies Profiled |
|
Customization |
Available Upon Request |
Key Segments Profiled in the PD1 Resistant Head and Neck Cancer Market Industry Survey
PD1 Resistant Head and Neck Cancer Market by Product:
- Cytotoxic Agents
- Antimetabolites
- Antitubulins
- Others - Platinum Agents, Fluoropyrimidines
- EGFR Inhibitors
- Erbitux
- Vectibix
- Theracim/Theraloc
- EGFR Inhibitors
- Tarceva
- Tykerb/Tyverb
- PD1 Inhibitors
- Keytruda
- Opdivo
- Pipeline Drugs
- EGFR Inhibitors
- PDL1 Inhibitors
- CTLA4 Inhibitors
PD1 Resistant Head and Neck Cancer Market by Region:
- North America
- Latin America
- Europe
- Asia Pacific
- Middle East & Africa
Frequently Asked Questions
FMI projects the global PD1 Resistant Head and Neck Cancer Market to expand at a 12.5% value CAGR by 2033.
The global PD1 Resistant Head and Neck Cancer Market is expected to garner a market value of US$ 5 billion by 2033.
FMI has projected North America to be one of the most profitable regions for the PD1 Resistant Head and Neck Cancer Market.
APAC region is expected to grow fastest during the forecast period.
Table of Content
1. Executive Summary
1.1. Global Market Outlook
1.2. Demand-side Trends
1.3. Supply-side Trends
1.4. Technology Roadmap Analysis
1.5. Analysis and Recommendations
2. Market Overview
2.1. Market Coverage / Taxonomy
2.2. Market Definition / Scope / Limitations
3. Market Background
3.1. Market Dynamics
3.1.1. Drivers
3.1.2. Restraints
3.1.3. Opportunity
3.1.4. Trends
3.2. Scenario Forecast
3.2.1. Demand in Optimistic Scenario
3.2.2. Demand in Likely Scenario
3.2.3. Demand in Conservative Scenario
3.3. Opportunity Map Analysis
3.4. Product Life Cycle Analysis
3.5. Investment Feasibility Matrix
3.6. PESTLE and Porter’s Analysis
3.7. Regulatory Landscape
3.7.1. By Key Regions
3.7.2. By Key Countries
3.8. Regional Parent Market Outlook
4. Global Market Analysis 2018-2022 and Forecast, 2023-2033
4.1. Historical Market Size Value (US$ Mn) Analysis, 2018-2022
4.2. Current and Future Market Size Value (US$ Mn) Projections, 2023-2033
4.2.1. Y-o-Y Growth Trend Analysis
4.2.2. Absolute $ Opportunity Analysis
5. Global Market Analysis 2018-2022 and Forecast 2023-2033, By Product
5.1. Introduction / Key Findings
5.2. Historical Market Size Value (US$ Mn) Analysis By Product, 2018-2022
5.3. Current and Future Market Size Value (US$ Mn) Analysis and Forecast By Product, 2023-2033
5.3.1. Cytotoxic Agents
5.3.1.1. Antimetabolites
5.3.1.2. Antitubulins
5.3.1.3. Others - Platinum Agents, Fluoropyrimidines
5.3.2. EGFR Inhibitors
5.3.2.1. Erbitux
5.3.2.2. Vectibix
5.3.2.3. Theracim/Theraloc
5.3.3. EGFR Inhibitors
5.3.3.1. Tarceva
5.3.3.2. Tykerb/Tyverb
5.3.4. PD1 Inhibitors
5.3.4.1. Keytruda
5.3.4.2. Opdivo
5.3.5. Pipeline Drugs
5.3.5.1. EGFR Inhibitors
5.3.5.2. PDL1 Inhibitors
5.3.5.3. CTLA4 Inhibitors
5.4. Y-o-Y Growth Trend Analysis By Product, 2018-2022
5.5. Absolute $ Opportunity Analysis By Product, 2023-2033
6. Global Market Analysis 2018-2022 and Forecast 2023-2033, By Region
6.1. Introduction
6.2. Historical Market Size Value (US$ Mn) Analysis By Region, 2018-2022
6.3. Current Market Size Value (US$ Mn) Analysis and Forecast By Region, 2023-2033
6.3.1. North America
6.3.2. Latin America
6.3.3. Europe
6.3.4. Asia Pacific
6.3.5. Middle East and Africa
6.4. Market Attractiveness Analysis By Region
7. North America Market Analysis 2018-2022 and Forecast 2023-2033, By Country
7.1. Historical Market Size Value (US$ Mn) Trend Analysis By Market Taxonomy, 2018-2022
7.2. Market Size Value (US$ Mn) Forecast By Market Taxonomy, 2023-2033
7.2.1. By Country
7.2.1.1. U.S.
7.2.1.2. Canada
7.2.2. By Product
7.3. Market Attractiveness Analysis
7.3.1. By Country
7.3.2. By Product
7.4. Key Takeaways
8. Latin America Market Analysis 2018-2022 and Forecast 2023-2033, By Country
8.1. Historical Market Size Value (US$ Mn) Trend Analysis By Market Taxonomy, 2018-2022
8.2. Market Size Value (US$ Mn) Forecast By Market Taxonomy, 2023-2033
8.2.1. By Country
8.2.1.1. Brazil
8.2.1.2. Mexico
8.2.1.3. Rest of Latin America
8.2.2. By Product
8.3. Market Attractiveness Analysis
8.3.1. By Country
8.3.2. By Product
8.4. Key Takeaways
9. Europe Market Analysis 2018-2022 and Forecast 2023-2033, By Country
9.1. Historical Market Size Value (US$ Mn) Trend Analysis By Market Taxonomy, 2018-2022
9.2. Market Size Value (US$ Mn) Forecast By Market Taxonomy, 2023-2033
9.2.1. By Country
9.2.1.1. Germany
9.2.1.2. U.K.
9.2.1.3. France
9.2.1.4. Spain
9.2.1.5. Italy
9.2.1.6. Russia
9.2.1.7. Rest of Europe
9.2.2. By Product
9.3. Market Attractiveness Analysis
9.3.1. By Country
9.3.2. By Product
9.4. Key Takeaways
10. Asia Pacific Market Analysis 2018-2022 and Forecast 2023-2033, By Country
10.1. Historical Market Size Value (US$ Mn) Trend Analysis By Market Taxonomy, 2018-2022
10.2. Market Size Value (US$ Mn) Forecast By Market Taxonomy, 2023-2033
10.2.1. By Country
10.2.1.1. China
10.2.1.2. Japan
10.2.1.3. India
10.2.1.4. South Korea
10.2.1.5. Australia
10.2.1.6. Rest of APAC
10.2.2. By Product
10.3. Market Attractiveness Analysis
10.3.1. By Country
10.3.2. By Product
10.4. Key Takeaways
11. Middle East and Africa Market Analysis 2018-2022 and Forecast 2023-2033, By Country
11.1. Historical Market Size Value (US$ Mn) Trend Analysis By Market Taxonomy, 2018-2022
11.2. Market Size Value (US$ Mn) Forecast By Market Taxonomy, 2023-2033
11.2.1. By Country
11.2.1.1. South Africa
11.2.1.2. Saudi Arabia
11.2.1.3. UAE
11.2.1.4. Israel
11.2.1.5. Rest of MEA
11.2.2. By Product
11.3. Market Attractiveness Analysis
11.3.1. By Country
11.3.2. By Product
11.4. Key Takeaways
12. Key Countries Market Analysis
12.1. U.S.
12.1.1. Pricing Analysis
12.1.2. Market Share Analysis, 2022
12.1.2.1. By Product
12.2. Canada
12.2.1. Pricing Analysis
12.2.2. Market Share Analysis, 2022
12.2.2.1. By Product
12.3. Brazil
12.3.1. Pricing Analysis
12.3.2. Market Share Analysis, 2022
12.3.2.1. By Product
12.4. Mexico
12.4.1. Pricing Analysis
12.4.2. Market Share Analysis, 2022
12.4.2.1. By Product
12.5. Germany
12.5.1. Pricing Analysis
12.5.2. Market Share Analysis, 2022
12.5.2.1. By Product
12.6. U.K.
12.6.1. Pricing Analysis
12.6.2. Market Share Analysis, 2022
12.6.2.1. By Product
12.7. France
12.7.1. Pricing Analysis
12.7.2. Market Share Analysis, 2022
12.7.2.1. By Product
12.8. Spain
12.8.1. Pricing Analysis
12.8.2. Market Share Analysis, 2022
12.8.2.1. By Product
12.9. Italy
12.9.1. Pricing Analysis
12.9.2. Market Share Analysis, 2022
12.9.2.1. By Product
12.10. Russia
12.10.1. Pricing Analysis
12.10.2. Market Share Analysis, 2022
12.10.2.1. By Product
12.11. China
12.11.1. Pricing Analysis
12.11.2. Market Share Analysis, 2022
12.11.2.1. By Product
12.12. Japan
12.12.1. Pricing Analysis
12.12.2. Market Share Analysis, 2022
12.12.2.1. By Product
12.13. India
12.13.1. Pricing Analysis
12.13.2. Market Share Analysis, 2022
12.13.2.1. By Product
12.14. South Korea
12.14.1. Pricing Analysis
12.14.2. Market Share Analysis, 2022
12.14.2.1. By Product
12.15. Australia
12.15.1. Pricing Analysis
12.15.2. Market Share Analysis, 2022
12.15.2.1. By Product
12.16. South Africa
12.16.1. Pricing Analysis
12.16.2. Market Share Analysis, 2022
12.16.2.1. By Product
12.17. Saudi Arabia
12.17.1. Pricing Analysis
12.17.2. Market Share Analysis, 2022
12.17.2.1. By Product
12.18. UAE
12.18.1. Pricing Analysis
12.18.2. Market Share Analysis, 2022
12.18.2.1. By Product
12.19. Israel
12.19.1. Pricing Analysis
12.19.2. Market Share Analysis, 2022
12.19.2.1. By Product
13. Market Structure Analysis
13.1. Competition Dashboard
13.2. Competition Benchmarking
13.3. Market Share Analysis of Top Players
13.3.1. By Regional
13.3.2. By Product
14. Competition Analysis
14.1. Competition Deep Dive
14.1.1. Advaxis, Inc.
14.1.1.1. Overview
14.1.1.2. Product Portfolio
14.1.1.3. Profitability by Market Segments
14.1.1.4. Sales Footprint
14.1.1.5. Strategy Overview
14.1.1.5.1. Marketing Strategy
14.1.2. Amgen, Inc.
14.1.2.1. Overview
14.1.2.2. Product Portfolio
14.1.2.3. Profitability by Market Segments
14.1.2.4. Sales Footprint
14.1.2.5. Strategy Overview
14.1.2.5.1. Marketing Strategy
14.1.3. AstraZeneca plc
14.1.3.1. Overview
14.1.3.2. Product Portfolio
14.1.3.3. Profitability by Market Segments
14.1.3.4. Sales Footprint
14.1.3.5. Strategy Overview
14.1.3.5.1. Marketing Strategy
14.1.4. Boehringer Ingelheim GmbH
14.1.4.1. Overview
14.1.4.2. Product Portfolio
14.1.4.3. Profitability by Market Segments
14.1.4.4. Sales Footprint
14.1.4.5. Strategy Overview
14.1.4.5.1. Marketing Strategy
14.1.5. Bristol-Myers Squibb Company
14.1.5.1. Overview
14.1.5.2. Product Portfolio
14.1.5.3. Profitability by Market Segments
14.1.5.4. Sales Footprint
14.1.5.5. Strategy Overview
14.1.5.5.1. Marketing Strategy
14.1.6. Cel-Sci Corporation
14.1.6.1. Overview
14.1.6.2. Product Portfolio
14.1.6.3. Profitability by Market Segments
14.1.6.4. Sales Footprint
14.1.6.5. Strategy Overview
14.1.6.5.1. Marketing Strategy
14.1.7. GlaxoSmithKline plc
14.1.7.1. Overview
14.1.7.2. Product Portfolio
14.1.7.3. Profitability by Market Segments
14.1.7.4. Sales Footprint
14.1.7.5. Strategy Overview
14.1.7.5.1. Marketing Strategy
14.1.8. Incyte Corporation
14.1.8.1. Overview
14.1.8.2. Product Portfolio
14.1.8.3. Profitability by Market Segments
14.1.8.4. Sales Footprint
14.1.8.5. Strategy Overview
14.1.8.5.1. Marketing Strategy
14.1.9. Merck KGaA
14.1.9.1. Overview
14.1.9.2. Product Portfolio
14.1.9.3. Profitability by Market Segments
14.1.9.4. Sales Footprint
14.1.9.5. Strategy Overview
14.1.9.5.1. Marketing Strategy
14.1.10. Novartis AG
14.1.10.1. Overview
14.1.10.2. Product Portfolio
14.1.10.3. Profitability by Market Segments
14.1.10.4. Sales Footprint
14.1.10.5. Strategy Overview
14.1.10.5.1. Marketing Strategy
15. Assumptions & Acronyms Used
16. Research Methodology
Let us know your requirement to get
100% FREE customization
List of Tables
Table 1: Global Market Value (US$ Mn) Forecast by Region, 2018-2033
Table 2: Global Market Value (US$ Mn) Forecast by Product, 2018-2033
Table 3: North America Market Value (US$ Mn) Forecast by Country, 2018-2033
Table 4: North America Market Value (US$ Mn) Forecast by Product, 2018-2033
Table 5: Latin America Market Value (US$ Mn) Forecast by Country, 2018-2033
Table 6: Latin America Market Value (US$ Mn) Forecast by Product, 2018-2033
Table 7: Europe Market Value (US$ Mn) Forecast by Country, 2018-2033
Table 8: Europe Market Value (US$ Mn) Forecast by Product, 2018-2033
Table 9: Asia Pacific Market Value (US$ Mn) Forecast by Country, 2018-2033
Table 10: Asia Pacific Market Value (US$ Mn) Forecast by Product, 2018-2033
Table 11: Middle East and Africa Market Value (US$ Mn) Forecast by Country, 2018-2033
Table 12: Middle East and Africa Market Value (US$ Mn) Forecast by Product, 2018-2033
Find your sweet spots for generating winning opportunities in this market.
Talk to AnalystList of Charts
Figure 1: Global Market Value (US$ Mn) by Product, 2023-2033
Figure 2: Global Market Value (US$ Mn) by Region, 2023-2033
Figure 3: Global Market Value (US$ Mn) Analysis by Region, 2018-2033
Figure 4: Global Market Value Share (%) and BPS Analysis by Region, 2023-2033
Figure 5: Global Market Y-o-Y Growth (%) Projections by Region, 2023-2033
Figure 6: Global Market Value (US$ Mn) Analysis by Product, 2018-2033
Figure 7: Global Market Value Share (%) and BPS Analysis by Product, 2023-2033
Figure 8: Global Market Y-o-Y Growth (%) Projections by Product, 2023-2033
Figure 9: Global Market Attractiveness by Product, 2023-2033
Figure 10: Global Market Attractiveness by Region, 2023-2033
Figure 11: North America Market Value (US$ Mn) by Product, 2023-2033
Figure 12: North America Market Value (US$ Mn) by Country, 2023-2033
Figure 13: North America Market Value (US$ Mn) Analysis by Country, 2018-2033
Figure 14: North America Market Value Share (%) and BPS Analysis by Country, 2023-2033
Figure 15: North America Market Y-o-Y Growth (%) Projections by Country, 2023-2033
Figure 16: North America Market Value (US$ Mn) Analysis by Product, 2018-2033
Figure 17: North America Market Value Share (%) and BPS Analysis by Product, 2023-2033
Figure 18: North America Market Y-o-Y Growth (%) Projections by Product, 2023-2033
Figure 19: North America Market Attractiveness by Product, 2023-2033
Figure 20: North America Market Attractiveness by Country, 2023-2033
Figure 21: Latin America Market Value (US$ Mn) by Product, 2023-2033
Figure 22: Latin America Market Value (US$ Mn) by Country, 2023-2033
Figure 23: Latin America Market Value (US$ Mn) Analysis by Country, 2018-2033
Figure 24: Latin America Market Value Share (%) and BPS Analysis by Country, 2023-2033
Figure 25: Latin America Market Y-o-Y Growth (%) Projections by Country, 2023-2033
Figure 26: Latin America Market Value (US$ Mn) Analysis by Product, 2018-2033
Figure 27: Latin America Market Value Share (%) and BPS Analysis by Product, 2023-2033
Figure 28: Latin America Market Y-o-Y Growth (%) Projections by Product, 2023-2033
Figure 29: Latin America Market Attractiveness by Product, 2023-2033
Figure 30: Latin America Market Attractiveness by Country, 2023-2033
Figure 31: Europe Market Value (US$ Mn) by Product, 2023-2033
Figure 32: Europe Market Value (US$ Mn) by Country, 2023-2033
Figure 33: Europe Market Value (US$ Mn) Analysis by Country, 2018-2033
Figure 34: Europe Market Value Share (%) and BPS Analysis by Country, 2023-2033
Figure 35: Europe Market Y-o-Y Growth (%) Projections by Country, 2023-2033
Figure 36: Europe Market Value (US$ Mn) Analysis by Product, 2018-2033
Figure 37: Europe Market Value Share (%) and BPS Analysis by Product, 2023-2033
Figure 38: Europe Market Y-o-Y Growth (%) Projections by Product, 2023-2033
Figure 39: Europe Market Attractiveness by Product, 2023-2033
Figure 40: Europe Market Attractiveness by Country, 2023-2033
Figure 41: Asia Pacific Market Value (US$ Mn) by Product, 2023-2033
Figure 42: Asia Pacific Market Value (US$ Mn) by Country, 2023-2033
Figure 43: Asia Pacific Market Value (US$ Mn) Analysis by Country, 2018-2033
Figure 44: Asia Pacific Market Value Share (%) and BPS Analysis by Country, 2023-2033
Figure 45: Asia Pacific Market Y-o-Y Growth (%) Projections by Country, 2023-2033
Figure 46: Asia Pacific Market Value (US$ Mn) Analysis by Product, 2018-2033
Figure 47: Asia Pacific Market Value Share (%) and BPS Analysis by Product, 2023-2033
Figure 48: Asia Pacific Market Y-o-Y Growth (%) Projections by Product, 2023-2033
Figure 49: Asia Pacific Market Attractiveness by Product, 2023-2033
Figure 50: Asia Pacific Market Attractiveness by Country, 2023-2033
Figure 51: Middle East and Africa Market Value (US$ Mn) by Product, 2023-2033
Figure 52: Middle East and Africa Market Value (US$ Mn) by Country, 2023-2033
Figure 53: Middle East and Africa Market Value (US$ Mn) Analysis by Country, 2018-2033
Figure 54: Middle East and Africa Market Value Share (%) and BPS Analysis by Country, 2023-2033
Figure 55: Middle East and Africa Market Y-o-Y Growth (%) Projections by Country, 2023-2033
Figure 56: Middle East and Africa Market Value (US$ Mn) Analysis by Product, 2018-2033
Figure 57: Middle East and Africa Market Value Share (%) and BPS Analysis by Product, 2023-2033
Figure 58: Middle East and Africa Market Y-o-Y Growth (%) Projections by Product, 2023-2033
Figure 59: Middle East and Africa Market Attractiveness by Product, 2023-2033
Figure 60: Middle East and Africa Market Attractiveness by Country, 2023-2033
Need specific information?
Request CustomizationExplore Healthcare Insights
View Reports