Reports

- Global Locations -

Headquarters

Future Market Insights, Inc.

Christiana Corporate, 200
Continental Drive, Suite 401,
Newark, Delaware - 19713,
United States

T: +1-845-579-5705

Americas

Future Market Insights, Inc.

616 Corporate Way, Suite 2-9018,
Valley Cottage, NY 10989, United States

T: +1-347-918-3531

MEA

Future Market Insights

1602-6 Jumeirah Bay X2 Tower, Plot No: JLT-PH2-X2A,
Jumeirah Lakes Towers, Dubai,
United Arab Emirates

Europe

Future Market Insights

3rd Floor, 207 Regent Street,
W1B 3HH London
United Kingdom

T: + 44 (0) 20 8123 9659
D: +44 (0) 20 3287 4268

Asia Pacific

Future Market Insights

IndiaLand Global Tech Park, Unit UG-1, Behind Grand HighStreet, Phase 1, Hinjawadi, MH, Pune – 411057, India

An In-depth Look at Sale of Digestion Resistant Maltodextrin in Korea from 2023 to 2033

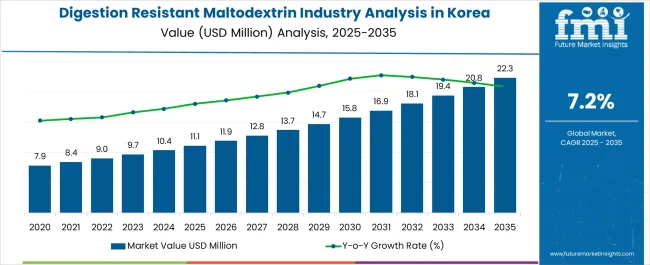
Demand for digestion resistant maltodextrin in Korea is expected to reach US$ 10.34 million in 2023, up from its 2022 valuation of US$ 9.65 million. The demand for digestion resistant maltodextrin is expected to progress at a healthy pace from 2023 to 2033, registering a CAGR of 7.6%. By 2033, the sales of digestion resistant maltodextrin are expected to surpass US$ 21.59 million in Korea.

Key Insights for Digestion Resistant Maltodextrin in Korea

  • Digestion resistant maltodextrin's key quality is recognized to be its richness in dietary fiber. Combined with the product's low-calorie count, digestion resistant maltodextrin is emerging as a popular healthy food ingredient.
  • As the demand for confectioneries and sweet products grows in Korea, manufacturers are on the lookout for bulking agents. Digestion resistant maltodextrin is one such product being used by manufacturers, employed for ice cream, jellies, and more treats.
  • In addition to traditional food products, digestion resistant maltodextrin is also being used in supplementary and replacement food. Thus, the product is finding use in nutritional bars, dietary supplements, and more in Korea.
Attributes Details
Industry Size for Korea in 2023 US$ 10.34 million
Expected Industry Size for Korea by 2033 US$ 21.59 million
Forecasted CAGR between 2023 to 2033 7.6%

Don't pay for what you don't need

Customize your report by selecting specific countries or regions and save 30%!

Key Trends Shaping the Demand for Digestion Resistant Maltodextrin in Korea

  • Consumption of maltodextrin in Korea is rising. As a result, there is a complementary increase in demand for digestion resistant maltodextrin, which is reputed to be even more nutritious.
  • In Korea, trends of plant-based and organic foods are thriving. As a result, digestion resistant maltodextrin, which is plant-based, is expected to grow in popularity in the country.
  • Digestion resistant maltodextrin is still viewed as a niche food ingredient in Korea. Thus, there is a lack of consumer awareness of the product. However, with scientific studies involving the product expounding on the benefits of the ingredient, there is expected to be growth in consumer knowledge.
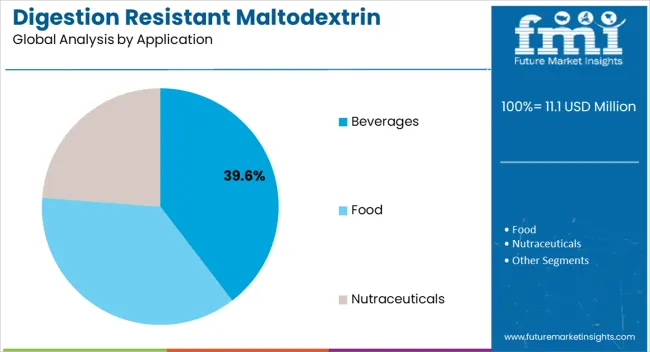
  • Nutraceutical consumption in Korea is growing. As digestion resistant maltodextrin becomes a common ingredient in nutraceuticals, the bulking agent is expected to thrive in Korea.
  • Demand for plant-based food is driving the sale of corn-based ingredients in Korea. Thus, corn-based digestion resistant maltodextrin is coming to the fore as a major food ingredient in the country.

Comparative View of Digestion Resistant Maltodextrin in Key Markets

Two regions, other than Korea, are studied for digestion resistant maltodextrin: Japan and Western Europe. Trends and challenges related to the sale of digestion resistant maltodextrin are provided for all three regions. It can be seen that the progress of digestion resistant maltodextrin is expected to be faster in Korea than in the other two regions.

Demand for Digestion Resistant Maltodextrin in Korea:

Attributes Demand for Digestion Resistant Maltodextrin in Korea
CAGR (2023 to 2033) 7.6%
Valuation (2023) US$ 10.34 million
Key Trend Health benefits of digestion resistant maltodextrin being recognized
Key Challenge Lack of awareness about digestion resistant maltodextrin among Korean people

Demand for Digestion Resistant Maltodextrin in Japan:

Attributes Demand for Digestion Resistant Maltodextrin in Japan
CAGR (2023 to 2033) 6.2%
Valuation (2023) US$ 22 million
Key Trend Advancement of sweet products and confectionaries in Japan
Key Challenge Alternative plant-based bulking agents in Japan have gained attention in recent years

Demand for Digestion Resistant Maltodextrin in Western Europe:

Attributes Demand for Digestion Resistant Maltodextrin in Western Europe
CAGR (2023 to 2033) 5.6%
Valuation (2023) US$ 31.6 million
Key Trend Increase in consumption of nutritional shakes and bars
Key Challenge Approvals for new products has potential to be slow
Nandini Roy Choudhury

Principal Consultant

Talk to Analyst

Find your sweet spots for generating winning opportunities in this market.

Category-wise Insights

Corn-based Digestion Resistant Maltodextrin Soaring in Korea Due to Widespread Acceptance of Corn as an Ingredient

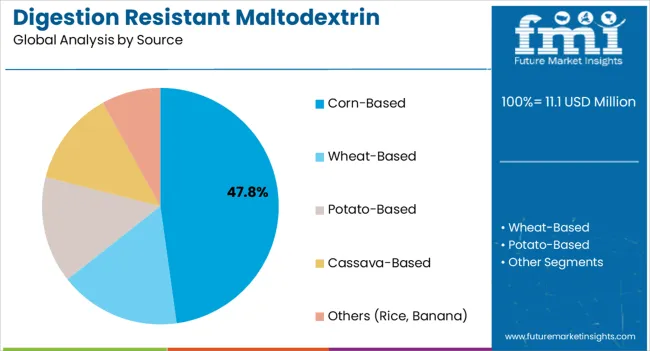
Corn is the most popular base for digestion resistant maltodextrin in Korea. For 2023, corn-based digestion resistant maltodextrin is expected to account for 57.3% of the industry share.

Corn already has a prominent place in Korean cuisine. As the popularity of corn-based food increases worldwide, Korea is also witnessing significant trends in corn-based products. Thus, corn-based digestion resistant maltodextrin is dominant in Korea. Additionally, the simple and cost-effective extraction and storage process of corn are also contributing to the growth of the product in the country.

Demand for Digestion Resistant Maltodextrin in Korea Based on Source Corn
Industry Share in 2023 57.3%

Spray-dried Powder is the Most Common Form of Digestion Resistant Maltodextrin

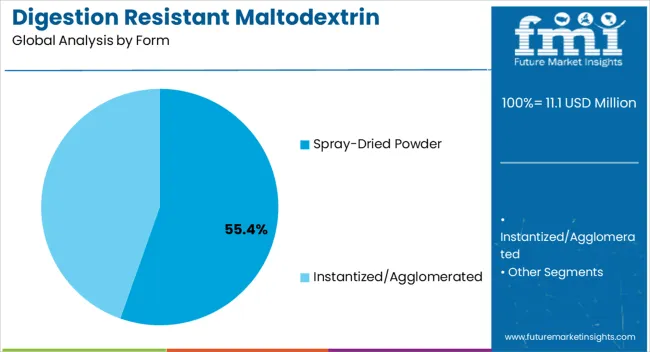
Digestion resistant maltodextrin is most commonly found in the form of spray-dried powder in Korea. For 2023, spray-dried powder is predicted to contribute to 63.5% of the industry share by form.

With the increasing use of digestion resistant maltodextrin in food items, manufacturers are looking to simplify the process of incorporating the ingredient into food. Spray-dried powder is a convenient method for producers to include the product in foods and beverages. Thus, spray-dried powder is triumphant as a form in Korea.

Demand for Digestion Resistant Maltodextrin in Korea Based on Form Spray-Dried Powder
Industry Share in 2023 63.5%

Competitive Landscape

Korea is an emerging market for digestion resistant maltodextrin. As such, industry players are still exploring the potential of the product in the country. They are also aiming to address the lack of awareness among Koreans about the product. The health benefits of the product are highlighted on foods and beverages containing digestion resistant maltodextrin, while adhering to established government labeling guidelines.

Recent Developments Observed in Digestion Resistant Maltodextrin in Korea

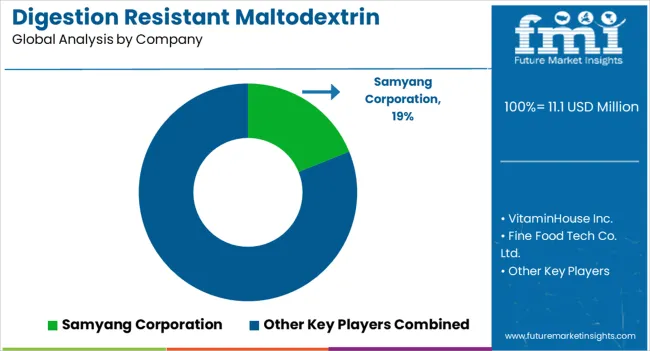
  • In July 2022, the local giant Samyang Corporation showcased various drinks, jams, and cereal bars in the United States as part of the International Food Technology Fair. Many of the products contained digestion resistant maltodextrin.
  • In November 2021, the Korean Ministry of Food and Drug Safety (MFDS) revised rules for the labeling of products with digestion resistant maltodextrin. The rule aimed to clarify the recommended daily intake of the material.

Get the data you need at a Fraction of the cost

Personalize your report by choosing insights you need
and save 40%!

Some of the Key Players Offering Digestion Resistant Maltodextrin in Korea

  • Samyang Corporation
  • VitaminHouse Inc.
  • Fine Food Tech Co. Ltd.
  • Day Well Jeu
  • Amicogen
  • DAESANG Co., Ltd.
  • Global Food Korea Co. Ltd.

Scope of the Report

Attribute Details
Estimated Industry Size in 2023 US$ 10.34 million
Projected Industry Size by 2033 US$ 21.59 million
Anticipated CAGR between 2023 to 2033 7.6% CAGR
Historical Analysis of Demand for Digestion Resistant Maltodextrin in Korea 2018 to 2022
Demand Forecast for Digestion Resistant Maltodextrin in Korea 2023 to 2033
Report Coverage Industry Size, Industry Trends, Key Insights for Digestion Resistant Maltodextrin in Korea, Insights on Global Players and Leading Industry Strategy in Korea, Ecosystem Analysis of Local and Regional Korea Providers
Key Companies Profiled
  • Samyang Corporation
  • VitaminHouse Inc.
  • Fine Food Tech Co. Ltd.
  • Day Well Jeu
  • Amicogen
  • DAESANG Co., Ltd.
  • Global Food Korea Co. Ltd.
Key Provinces Profiled
  • South Gyeongsang
  • North Jeolla
  • South Jeolla
  • Jeju

Key Segments

By Form:

  • Spray-dried Powder
  • Instantized/Agglomerated

By Source:

  • Corn-based
  • Wheat-based
  • Potato-based
  • Cassava-based
  • Others (Rice, Banana)

By Application:

  • Beverages
    • Alcoholic Beverages
    • Non-alcoholic Beverages
  • Food
    • Breakfast Cereals
    • Dairy Products
    • Instant Puddings
    • Margarines and Butters
    • Salad Dressings
    • Sauces
    • Snack Foods
    • Others
  • Nutraceuticals

By Province:

  • South Gyeongsang
  • North Jeolla
  • South Jeolla
  • Jeju

Frequently Asked Questions

What is the Industry Size of Digestion Resistant Maltodextrin in Korea?

The industry size of digestion resistant maltodextrin in Korea is estimated to be US$ 10.34 million in 2023.

At What Rate is the Demand for Digestion Resistant Maltodextrin Growing in Korea?

Digestion resistant maltodextrin demand is forecasted to develop at an encouraging CAGR of 7.6% in Korea from 2023 to 2033.

What will be the Industry Size of Digestion Resistant Maltodextrin in Korea by 2033?

The industry size for digestion resistant maltodextrin is forecasted to reach US$ 21.59 million in Korea by 2033.

What is the Preferred Source of Digestion Resistant Maltodextrin in Korea?

Corn is the most popular source of digestion resistant maltodextrin in Korea, with an estimated industry share of 58.3% in 2023.

What is Driving the Demand for Digestion Resistant Maltodextrin in Korea?

Demand for plant-based food ingredients and the increasing sale of sweets are some of the reasons for increase in demand for digestion resistant maltodextrin in Korea.

Table of Content

1. Executive Summary

    1.1. Korea Market Outlook

    1.2. Demand-side Trends

    1.3. Supply-side Trends

    1.4. Analysis and Recommendations

2. Market Overview

    2.1. Market Coverage / Taxonomy

    2.2. Market Definition / Scope / Limitations

3. Market Background

    3.1. Market Dynamics

        3.1.1. Drivers

        3.1.2. Restraints

        3.1.3. Opportunity

        3.1.4. Trends

    3.2. Scenario Forecast

        3.2.1. Demand in Optimistic Scenario

        3.2.2. Demand in Likely Scenario

        3.2.3. Demand in Conservative Scenario

    3.3. Opportunity Map Analysis

    3.4. Product Life Cycle Analysis

    3.5. Supply Chain Analysis

        3.5.1. Supply Side Participants and their Roles

            3.5.1.1. Producers

            3.5.1.2. Mid-Level Participants (Traders/ Agents/ Brokers)

            3.5.1.3. Wholesalers and Distributors

        3.5.2. Value Added and Value Created at Node in the Supply Chain

        3.5.3. List of Raw Material Suppliers

        3.5.4. List of Existing and Potential Buyer’s

    3.6. Investment Feasibility Matrix

    3.7. Value Chain Analysis

        3.7.1. Profit Margin Analysis

        3.7.2. Wholesalers and Distributors

        3.7.3. Retailers

    3.8. PESTLE and Porter’s Analysis

    3.9. Regulatory Landscape

        3.9.1. By Key Regions

    3.10. Regional Parent Market Outlook

    3.11. Production and Consumption Statistics

    3.12. Import and Export Statistics

4. Korea Industry Analysis and Outlook 2018 to 2022 and Forecast, 2023 to 2033

    4.1. Historical Market Size Value (US$ Million) & Volume (Tons) Analysis, 2018 to 2022

    4.2. Current and Future Market Size Value (US$ Million) & Volume (Tons) Projections, 2023 to 2033

        4.2.1. Y-o-Y Growth Trend Analysis

        4.2.2. Absolute $ Opportunity Analysis

5. Korea Industry Analysis and Outlook 2018 to 2022 and Forecast 2023 to 2033, By Source

    5.1. Introduction / Key Findings

    5.2. Historical Market Size Value (US$ Million) & Volume (Tons) Analysis By Source, 2018 to 2022

    5.3. Current and Future Market Size Value (US$ Million) & Volume (Tons) Analysis and Forecast By Source, 2023 to 2033

        5.3.1. Corn-based

        5.3.2. Wheat-based

        5.3.3. Potato-based

        5.3.4. Cassava-based

        5.3.5. Others

    5.4. Y-o-Y Growth Trend Analysis By Source, 2018 to 2022

    5.5. Absolute $ Opportunity Analysis By Source, 2023 to 2033

6. Korea Industry Analysis and Outlook 2018 to 2022 and Forecast 2023 to 2033, By Form

    6.1. Introduction / Key Findings

    6.2. Historical Market Size Value (US$ Million) & Volume (Tons) Analysis By Form, 2018 to 2022

    6.3. Current and Future Market Size Value (US$ Million) & Volume (Tons) Analysis and Forecast By Form, 2023 to 2033

        6.3.1. Spray-dried Powder

        6.3.2. Instantized/Agglomerated

    6.4. Y-o-Y Growth Trend Analysis By Form, 2018 to 2022

    6.5. Absolute $ Opportunity Analysis By Form, 2023 to 2033

7. Korea Industry Analysis and Outlook 2018 to 2022 and Forecast 2023 to 2033, By Application

    7.1. Introduction / Key Findings

    7.2. Historical Market Size Value (US$ Million) & Volume (Tons) Analysis By Application, 2018 to 2022

    7.3. Current and Future Market Size Value (US$ Million) & Volume (Tons) Analysis and Forecast By Application, 2023 to 2033

        7.3.1. Beverages

            7.3.1.1. Alcoholic Beverages

            7.3.1.2. Non-alcoholic Beverages

        7.3.2. Food

            7.3.2.1. Breakfast Cereals

            7.3.2.2. Dairy Products

            7.3.2.3. Instant Puddings

            7.3.2.4. Margarines and Butters

            7.3.2.5. Salad Dressings

            7.3.2.6. Sauces

            7.3.2.7. Snack Foods

            7.3.2.8. Others

        7.3.3. Nutraceuticals

    7.4. Y-o-Y Growth Trend Analysis By Application, 2018 to 2022

    7.5. Absolute $ Opportunity Analysis By Application, 2023 to 2033

8. Korea Industry Analysis and Outlook 2018 to 2022 and Forecast 2023 to 2033, By Region

    8.1. Introduction

    8.2. Historical Market Size Value (US$ Million) & Volume (Tons) Analysis By Region, 2018 to 2022

    8.3. Current Market Size Value (US$ Million) & Volume (Tons) Analysis and Forecast By Region, 2023 to 2033

        8.3.1. South Gyeongsang

        8.3.2. North Jeolla

        8.3.3. South Jeolla

        8.3.4. Jeju

        8.3.5. Rest of Korea

    8.4. Market Attractiveness Analysis By Region

9. South Gyeongsang Industry Analysis and Outlook 2018 to 2022 and Forecast 2023 to 2033

    9.1. Historical Market Size Value (US$ Million) & Volume (Tons) Trend Analysis By Market Taxonomy, 2018 to 2022

    9.2. Market Size Value (US$ Million) & Volume (Tons) Forecast By Market Taxonomy, 2023 to 2033

        9.2.1. By Source

        9.2.2. By Form

        9.2.3. By Application

    9.3. Market Attractiveness Analysis

        9.3.1. By Source

        9.3.2. By Form

        9.3.3. By Application

    9.4. Key Takeaways

10. North Jeolla Industry Analysis and Outlook 2018 to 2022 and Forecast 2023 to 2033

    10.1. Historical Market Size Value (US$ Million) & Volume (Tons) Trend Analysis By Market Taxonomy, 2018 to 2022

    10.2. Market Size Value (US$ Million) & Volume (Tons) Forecast By Market Taxonomy, 2023 to 2033

        10.2.1. By Source

        10.2.2. By Form

        10.2.3. By Application

    10.3. Market Attractiveness Analysis

        10.3.1. By Source

        10.3.2. By Form

        10.3.3. By Application

    10.4. Key Takeaways

11. South Jeolla Industry Analysis and Outlook 2018 to 2022 and Forecast 2023 to 2033

    11.1. Historical Market Size Value (US$ Million) & Volume (Tons) Trend Analysis By Market Taxonomy, 2018 to 2022

    11.2. Market Size Value (US$ Million) & Volume (Tons) Forecast By Market Taxonomy, 2023 to 2033

        11.2.1. By Source

        11.2.2. By Form

        11.2.3. By Application

    11.3. Market Attractiveness Analysis

        11.3.1. By Source

        11.3.2. By Form

        11.3.3. By Application

    11.4. Key Takeaways

12. Jeju Industry Analysis and Outlook 2018 to 2022 and Forecast 2023 to 2033

    12.1. Historical Market Size Value (US$ Million) & Volume (Tons) Trend Analysis By Market Taxonomy, 2018 to 2022

    12.2. Market Size Value (US$ Million) & Volume (Tons) Forecast By Market Taxonomy, 2023 to 2033

        12.2.1. By Source

        12.2.2. By Form

        12.2.3. By Application

    12.3. Market Attractiveness Analysis

        12.3.1. By Source

        12.3.2. By Form

        12.3.3. By Application

    12.4. Key Takeaways

13. Rest of Korea Industry Analysis and Outlook 2018 to 2022 and Forecast 2023 to 2033

    13.1. Historical Market Size Value (US$ Million) & Volume (Tons) Trend Analysis By Market Taxonomy, 2018 to 2022

    13.2. Market Size Value (US$ Million) & Volume (Tons) Forecast By Market Taxonomy, 2023 to 2033

        13.2.1. By Source

        13.2.2. By Form

        13.2.3. By Application

    13.3. Market Attractiveness Analysis

        13.3.1. By Source

        13.3.2. By Form

        13.3.3. By Application

    13.4. Key Takeaways

14. Market Structure Analysis

    14.1. Competition Dashboard

    14.2. Competition Benchmarking

    14.3. Market Share Analysis of Top Players

        14.3.1. By Regional

        14.3.2. By Source

        14.3.3. By Form

        14.3.4. By Application

15. Competition Analysis

    15.1. Competition Deep Dive

        15.1.1. Samyang Corporation

            15.1.1.1. Overview

            15.1.1.2. Product Portfolio

            15.1.1.3. Profitability by Market Segments

            15.1.1.4. Sales Footprint

            15.1.1.5. Strategy Overview

                15.1.1.5.1. Marketing Strategy

                15.1.1.5.2. Product Strategy

                15.1.1.5.3. Channel Strategy

        15.1.2. Matsutani Chemical Industry Co., Ltd.

            15.1.2.1. Overview

            15.1.2.2. Product Portfolio

            15.1.2.3. Profitability by Market Segments

            15.1.2.4. Sales Footprint

            15.1.2.5. Strategy Overview

                15.1.2.5.1. Marketing Strategy

                15.1.2.5.2. Product Strategy

                15.1.2.5.3. Channel Strategy

        15.1.3. Roquette Freres S.A.

            15.1.3.1. Overview

            15.1.3.2. Product Portfolio

            15.1.3.3. Profitability by Market Segments

            15.1.3.4. Sales Footprint

            15.1.3.5. Strategy Overview

                15.1.3.5.1. Marketing Strategy

                15.1.3.5.2. Product Strategy

                15.1.3.5.3. Channel Strategy

        15.1.4. Ingredion Incorporated

            15.1.4.1. Overview

            15.1.4.2. Product Portfolio

            15.1.4.3. Profitability by Market Segments

            15.1.4.4. Sales Footprint

            15.1.4.5. Strategy Overview

                15.1.4.5.1. Marketing Strategy

                15.1.4.5.2. Product Strategy

                15.1.4.5.3. Channel Strategy

        15.1.5. Tate & Lyle

            15.1.5.1. Overview

            15.1.5.2. Product Portfolio

            15.1.5.3. Profitability by Market Segments

            15.1.5.4. Sales Footprint

            15.1.5.5. Strategy Overview

                15.1.5.5.1. Marketing Strategy

                15.1.5.5.2. Product Strategy

                15.1.5.5.3. Channel Strategy

        15.1.6. Grain Processing Corporation

            15.1.6.1. Overview

            15.1.6.2. Product Portfolio

            15.1.6.3. Profitability by Market Segments

            15.1.6.4. Sales Footprint

            15.1.6.5. Strategy Overview

                15.1.6.5.1. Marketing Strategy

                15.1.6.5.2. Product Strategy

                15.1.6.5.3. Channel Strategy

        15.1.7. WGC Co., Ltd.

            15.1.7.1. Overview

            15.1.7.2. Product Portfolio

            15.1.7.3. Profitability by Market Segments

            15.1.7.4. Sales Footprint

            15.1.7.5. Strategy Overview

                15.1.7.5.1. Marketing Strategy

                15.1.7.5.2. Product Strategy

                15.1.7.5.3. Channel Strategy

        15.1.8. Kraft Heinz Company

            15.1.8.1. Overview

            15.1.8.2. Product Portfolio

            15.1.8.3. Profitability by Market Segments

            15.1.8.4. Sales Footprint

            15.1.8.5. Strategy Overview

                15.1.8.5.1. Marketing Strategy

                15.1.8.5.2. Product Strategy

                15.1.8.5.3. Channel Strategy

        15.1.9. Cargill Incorporated

            15.1.9.1. Overview

            15.1.9.2. Product Portfolio

            15.1.9.3. Profitability by Market Segments

            15.1.9.4. Sales Footprint

            15.1.9.5. Strategy Overview

                15.1.9.5.1. Marketing Strategy

                15.1.9.5.2. Product Strategy

                15.1.9.5.3. Channel Strategy

        15.1.10. Archer Daniels Midland Company

            15.1.10.1. Overview

            15.1.10.2. Product Portfolio

            15.1.10.3. Profitability by Market Segments

            15.1.10.4. Sales Footprint

            15.1.10.5. Strategy Overview

                15.1.10.5.1. Marketing Strategy

                15.1.10.5.2. Product Strategy

                15.1.10.5.3. Channel Strategy

        15.1.11. Baolingbao Biology Co. Ltd

            15.1.11.1. Overview

            15.1.11.2. Product Portfolio

            15.1.11.3. Profitability by Market Segments

            15.1.11.4. Sales Footprint

            15.1.11.5. Strategy Overview

                15.1.11.5.1. Marketing Strategy

                15.1.11.5.2. Product Strategy

                15.1.11.5.3. Channel Strategy

16. Assumptions & Acronyms Used

17. Research Methodology

List of Tables

Table 1: Korea Industry Analysis and Outlook Value (US$ Million) Forecast by Region, 2018 to 2033

Table 2: Korea Industry Analysis and Outlook Volume (Tons) Forecast by Region, 2018 to 2033

Table 3: Korea Industry Analysis and Outlook Value (US$ Million) Forecast by Source, 2018 to 2033

Table 4: Korea Industry Analysis and Outlook Volume (Tons) Forecast by Source, 2018 to 2033

Table 5: Korea Industry Analysis and Outlook Value (US$ Million) Forecast by Form, 2018 to 2033

Table 6: Korea Industry Analysis and Outlook Volume (Tons) Forecast by Form, 2018 to 2033

Table 7: Korea Industry Analysis and Outlook Value (US$ Million) Forecast by Application, 2018 to 2033

Table 8: Korea Industry Analysis and Outlook Volume (Tons) Forecast by Application, 2018 to 2033

Table 9: South Gyeongsang Industry Analysis and Outlook Value (US$ Million) Forecast by Source, 2018 to 2033

Table 10: South Gyeongsang Industry Analysis and Outlook Volume (Tons) Forecast by Source, 2018 to 2033

Table 11: South Gyeongsang Industry Analysis and Outlook Value (US$ Million) Forecast by Form, 2018 to 2033

Table 12: South Gyeongsang Industry Analysis and Outlook Volume (Tons) Forecast by Form, 2018 to 2033

Table 13: South Gyeongsang Industry Analysis and Outlook Value (US$ Million) Forecast by Application, 2018 to 2033

Table 14: South Gyeongsang Industry Analysis and Outlook Volume (Tons) Forecast by Application, 2018 to 2033

Table 15: North Jeolla Industry Analysis and Outlook Value (US$ Million) Forecast by Source, 2018 to 2033

Table 16: North Jeolla Industry Analysis and Outlook Volume (Tons) Forecast by Source, 2018 to 2033

Table 17: North Jeolla Industry Analysis and Outlook Value (US$ Million) Forecast by Form, 2018 to 2033

Table 18: North Jeolla Industry Analysis and Outlook Volume (Tons) Forecast by Form, 2018 to 2033

Table 19: North Jeolla Industry Analysis and Outlook Value (US$ Million) Forecast by Application, 2018 to 2033

Table 20: North Jeolla Industry Analysis and Outlook Volume (Tons) Forecast by Application, 2018 to 2033

Table 21: South Jeolla Industry Analysis and Outlook Value (US$ Million) Forecast by Source, 2018 to 2033

Table 22: South Jeolla Industry Analysis and Outlook Volume (Tons) Forecast by Source, 2018 to 2033

Table 23: South Jeolla Industry Analysis and Outlook Value (US$ Million) Forecast by Form, 2018 to 2033

Table 24: South Jeolla Industry Analysis and Outlook Volume (Tons) Forecast by Form, 2018 to 2033

Table 25: South Jeolla Industry Analysis and Outlook Value (US$ Million) Forecast by Application, 2018 to 2033

Table 26: South Jeolla Industry Analysis and Outlook Volume (Tons) Forecast by Application, 2018 to 2033

Table 27: Jeju Industry Analysis and Outlook Value (US$ Million) Forecast by Source, 2018 to 2033

Table 28: Jeju Industry Analysis and Outlook Volume (Tons) Forecast by Source, 2018 to 2033

Table 29: Jeju Industry Analysis and Outlook Value (US$ Million) Forecast by Form, 2018 to 2033

Table 30: Jeju Industry Analysis and Outlook Volume (Tons) Forecast by Form, 2018 to 2033

Table 31: Jeju Industry Analysis and Outlook Value (US$ Million) Forecast by Application, 2018 to 2033

Table 32: Jeju Industry Analysis and Outlook Volume (Tons) Forecast by Application, 2018 to 2033

List of Charts

Figure 1: Korea Industry Analysis and Outlook Value (US$ Million) by Source, 2023 to 2033

Figure 2: Korea Industry Analysis and Outlook Value (US$ Million) by Form, 2023 to 2033

Figure 3: Korea Industry Analysis and Outlook Value (US$ Million) by Application, 2023 to 2033

Figure 4: Korea Industry Analysis and Outlook Value (US$ Million) by Region, 2023 to 2033

Figure 5: Korea Industry Analysis and Outlook Value (US$ Million) Analysis by Region, 2018 to 2033

Figure 6: Korea Industry Analysis and Outlook Volume (Tons) Analysis by Region, 2018 to 2033

Figure 7: Korea Industry Analysis and Outlook Value Share (%) and BPS Analysis by Region, 2023 to 2033

Figure 8: Korea Industry Analysis and Outlook Y-o-Y Growth (%) Projections by Region, 2023 to 2033

Figure 9: Korea Industry Analysis and Outlook Value (US$ Million) Analysis by Source, 2018 to 2033

Figure 10: Korea Industry Analysis and Outlook Volume (Tons) Analysis by Source, 2018 to 2033

Figure 11: Korea Industry Analysis and Outlook Value Share (%) and BPS Analysis by Source, 2023 to 2033

Figure 12: Korea Industry Analysis and Outlook Y-o-Y Growth (%) Projections by Source, 2023 to 2033

Figure 13: Korea Industry Analysis and Outlook Value (US$ Million) Analysis by Form, 2018 to 2033

Figure 14: Korea Industry Analysis and Outlook Volume (Tons) Analysis by Form, 2018 to 2033

Figure 15: Korea Industry Analysis and Outlook Value Share (%) and BPS Analysis by Form, 2023 to 2033

Figure 16: Korea Industry Analysis and Outlook Y-o-Y Growth (%) Projections by Form, 2023 to 2033

Figure 17: Korea Industry Analysis and Outlook Value (US$ Million) Analysis by Application, 2018 to 2033

Figure 18: Korea Industry Analysis and Outlook Volume (Tons) Analysis by Application, 2018 to 2033

Figure 19: Korea Industry Analysis and Outlook Value Share (%) and BPS Analysis by Application, 2023 to 2033

Figure 20: Korea Industry Analysis and Outlook Y-o-Y Growth (%) Projections by Application, 2023 to 2033

Figure 21: Korea Industry Analysis and Outlook Attractiveness by Source, 2023 to 2033

Figure 22: Korea Industry Analysis and Outlook Attractiveness by Form, 2023 to 2033

Figure 23: Korea Industry Analysis and Outlook Attractiveness by Application, 2023 to 2033

Figure 24: Korea Industry Analysis and Outlook Attractiveness by Region, 2023 to 2033

Figure 25: South Gyeongsang Industry Analysis and Outlook Value (US$ Million) by Source, 2023 to 2033

Figure 26: South Gyeongsang Industry Analysis and Outlook Value (US$ Million) by Form, 2023 to 2033

Figure 27: South Gyeongsang Industry Analysis and Outlook Value (US$ Million) by Application, 2023 to 2033

Figure 28: South Gyeongsang Industry Analysis and Outlook Value (US$ Million) Analysis by Source, 2018 to 2033

Figure 29: South Gyeongsang Industry Analysis and Outlook Volume (Tons) Analysis by Source, 2018 to 2033

Figure 30: South Gyeongsang Industry Analysis and Outlook Value Share (%) and BPS Analysis by Source, 2023 to 2033

Figure 31: South Gyeongsang Industry Analysis and Outlook Y-o-Y Growth (%) Projections by Source, 2023 to 2033

Figure 32: South Gyeongsang Industry Analysis and Outlook Value (US$ Million) Analysis by Form, 2018 to 2033

Figure 33: South Gyeongsang Industry Analysis and Outlook Volume (Tons) Analysis by Form, 2018 to 2033

Figure 34: South Gyeongsang Industry Analysis and Outlook Value Share (%) and BPS Analysis by Form, 2023 to 2033

Figure 35: South Gyeongsang Industry Analysis and Outlook Y-o-Y Growth (%) Projections by Form, 2023 to 2033

Figure 36: South Gyeongsang Industry Analysis and Outlook Value (US$ Million) Analysis by Application, 2018 to 2033

Figure 37: South Gyeongsang Industry Analysis and Outlook Volume (Tons) Analysis by Application, 2018 to 2033

Figure 38: South Gyeongsang Industry Analysis and Outlook Value Share (%) and BPS Analysis by Application, 2023 to 2033

Figure 39: South Gyeongsang Industry Analysis and Outlook Y-o-Y Growth (%) Projections by Application, 2023 to 2033

Figure 40: South Gyeongsang Industry Analysis and Outlook Attractiveness by Source, 2023 to 2033

Figure 41: South Gyeongsang Industry Analysis and Outlook Attractiveness by Form, 2023 to 2033

Figure 42: South Gyeongsang Industry Analysis and Outlook Attractiveness by Application, 2023 to 2033

Figure 43: North Jeolla Industry Analysis and Outlook Value (US$ Million) by Source, 2023 to 2033

Figure 44: North Jeolla Industry Analysis and Outlook Value (US$ Million) by Form, 2023 to 2033

Figure 45: North Jeolla Industry Analysis and Outlook Value (US$ Million) by Application, 2023 to 2033

Figure 46: North Jeolla Industry Analysis and Outlook Value (US$ Million) Analysis by Source, 2018 to 2033

Figure 47: North Jeolla Industry Analysis and Outlook Volume (Tons) Analysis by Source, 2018 to 2033

Figure 48: North Jeolla Industry Analysis and Outlook Value Share (%) and BPS Analysis by Source, 2023 to 2033

Figure 49: North Jeolla Industry Analysis and Outlook Y-o-Y Growth (%) Projections by Source, 2023 to 2033

Figure 50: North Jeolla Industry Analysis and Outlook Value (US$ Million) Analysis by Form, 2018 to 2033

Figure 51: North Jeolla Industry Analysis and Outlook Volume (Tons) Analysis by Form, 2018 to 2033

Figure 52: North Jeolla Industry Analysis and Outlook Value Share (%) and BPS Analysis by Form, 2023 to 2033

Figure 53: North Jeolla Industry Analysis and Outlook Y-o-Y Growth (%) Projections by Form, 2023 to 2033

Figure 54: North Jeolla Industry Analysis and Outlook Value (US$ Million) Analysis by Application, 2018 to 2033

Figure 55: North Jeolla Industry Analysis and Outlook Volume (Tons) Analysis by Application, 2018 to 2033

Figure 56: North Jeolla Industry Analysis and Outlook Value Share (%) and BPS Analysis by Application, 2023 to 2033

Figure 57: North Jeolla Industry Analysis and Outlook Y-o-Y Growth (%) Projections by Application, 2023 to 2033

Figure 58: North Jeolla Industry Analysis and Outlook Attractiveness by Source, 2023 to 2033

Figure 59: North Jeolla Industry Analysis and Outlook Attractiveness by Form, 2023 to 2033

Figure 60: North Jeolla Industry Analysis and Outlook Attractiveness by Application, 2023 to 2033

Figure 61: South Jeolla Industry Analysis and Outlook Value (US$ Million) by Source, 2023 to 2033

Figure 62: South Jeolla Industry Analysis and Outlook Value (US$ Million) by Form, 2023 to 2033

Figure 63: South Jeolla Industry Analysis and Outlook Value (US$ Million) by Application, 2023 to 2033

Figure 64: South Jeolla Industry Analysis and Outlook Value (US$ Million) Analysis by Source, 2018 to 2033

Figure 65: South Jeolla Industry Analysis and Outlook Volume (Tons) Analysis by Source, 2018 to 2033

Figure 66: South Jeolla Industry Analysis and Outlook Value Share (%) and BPS Analysis by Source, 2023 to 2033

Figure 67: South Jeolla Industry Analysis and Outlook Y-o-Y Growth (%) Projections by Source, 2023 to 2033

Figure 68: South Jeolla Industry Analysis and Outlook Value (US$ Million) Analysis by Form, 2018 to 2033

Figure 69: South Jeolla Industry Analysis and Outlook Volume (Tons) Analysis by Form, 2018 to 2033

Figure 70: South Jeolla Industry Analysis and Outlook Value Share (%) and BPS Analysis by Form, 2023 to 2033

Figure 71: South Jeolla Industry Analysis and Outlook Y-o-Y Growth (%) Projections by Form, 2023 to 2033

Figure 72: South Jeolla Industry Analysis and Outlook Value (US$ Million) Analysis by Application, 2018 to 2033

Figure 73: South Jeolla Industry Analysis and Outlook Volume (Tons) Analysis by Application, 2018 to 2033

Figure 74: South Jeolla Industry Analysis and Outlook Value Share (%) and BPS Analysis by Application, 2023 to 2033

Figure 75: South Jeolla Industry Analysis and Outlook Y-o-Y Growth (%) Projections by Application, 2023 to 2033

Figure 76: South Jeolla Industry Analysis and Outlook Attractiveness by Source, 2023 to 2033

Figure 77: South Jeolla Industry Analysis and Outlook Attractiveness by Form, 2023 to 2033

Figure 78: South Jeolla Industry Analysis and Outlook Attractiveness by Application, 2023 to 2033

Figure 79: Jeju Industry Analysis and Outlook Value (US$ Million) by Source, 2023 to 2033

Figure 80: Jeju Industry Analysis and Outlook Value (US$ Million) by Form, 2023 to 2033

Figure 81: Jeju Industry Analysis and Outlook Value (US$ Million) by Application, 2023 to 2033

Figure 82: Jeju Industry Analysis and Outlook Value (US$ Million) Analysis by Source, 2018 to 2033

Figure 83: Jeju Industry Analysis and Outlook Volume (Tons) Analysis by Source, 2018 to 2033

Figure 84: Jeju Industry Analysis and Outlook Value Share (%) and BPS Analysis by Source, 2023 to 2033

Figure 85: Jeju Industry Analysis and Outlook Y-o-Y Growth (%) Projections by Source, 2023 to 2033

Figure 86: Jeju Industry Analysis and Outlook Value (US$ Million) Analysis by Form, 2018 to 2033

Figure 87: Jeju Industry Analysis and Outlook Volume (Tons) Analysis by Form, 2018 to 2033

Figure 88: Jeju Industry Analysis and Outlook Value Share (%) and BPS Analysis by Form, 2023 to 2033

Figure 89: Jeju Industry Analysis and Outlook Y-o-Y Growth (%) Projections by Form, 2023 to 2033

Figure 90: Jeju Industry Analysis and Outlook Value (US$ Million) Analysis by Application, 2018 to 2033

Figure 91: Jeju Industry Analysis and Outlook Volume (Tons) Analysis by Application, 2018 to 2033

Figure 92: Jeju Industry Analysis and Outlook Value Share (%) and BPS Analysis by Application, 2023 to 2033

Figure 93: Jeju Industry Analysis and Outlook Y-o-Y Growth (%) Projections by Application, 2023 to 2033

Figure 94: Jeju Industry Analysis and Outlook Attractiveness by Source, 2023 to 2033

Figure 95: Jeju Industry Analysis and Outlook Attractiveness by Form, 2023 to 2033

Figure 96: Jeju Industry Analysis and Outlook Attractiveness by Application, 2023 to 2033

Figure 97: Rest of Korea Industry Analysis and Outlook Value (US$ Million) by Source, 2023 to 2033

Figure 98: Rest of Korea Industry Analysis and Outlook Value (US$ Million) by Form, 2023 to 2033

Figure 99: Rest of Korea Industry Analysis and Outlook Value (US$ Million) by Application, 2023 to 2033

Figure 100: Rest of Korea Industry Analysis and Outlook Value (US$ Million) Analysis by Source, 2018 to 2033

Figure 101: Rest of Korea Industry Analysis and Outlook Volume (Tons) Analysis by Source, 2018 to 2033

Figure 102: Rest of Korea Industry Analysis and Outlook Value Share (%) and BPS Analysis by Source, 2023 to 2033

Figure 103: Rest of Korea Industry Analysis and Outlook Y-o-Y Growth (%) Projections by Source, 2023 to 2033

Figure 104: Rest of Korea Industry Analysis and Outlook Value (US$ Million) Analysis by Form, 2018 to 2033

Figure 105: Rest of Korea Industry Analysis and Outlook Volume (Tons) Analysis by Form, 2018 to 2033

Figure 106: Rest of Korea Industry Analysis and Outlook Value Share (%) and BPS Analysis by Form, 2023 to 2033

Figure 107: Rest of Korea Industry Analysis and Outlook Y-o-Y Growth (%) Projections by Form, 2023 to 2033

Figure 108: Rest of Korea Industry Analysis and Outlook Value (US$ Million) Analysis by Application, 2018 to 2033

Figure 109: Rest of Korea Industry Analysis and Outlook Volume (Tons) Analysis by Application, 2018 to 2033

Figure 110: Rest of Korea Industry Analysis and Outlook Value Share (%) and BPS Analysis by Application, 2023 to 2033

Figure 111: Rest of Korea Industry Analysis and Outlook Y-o-Y Growth (%) Projections by Application, 2023 to 2033

Figure 112: Rest of Korea Industry Analysis and Outlook Attractiveness by Source, 2023 to 2033

Figure 113: Rest of Korea Industry Analysis and Outlook Attractiveness by Form, 2023 to 2033

Figure 114: Rest of Korea Industry Analysis and Outlook Attractiveness by Application, 2023 to 2033

Recommendations

Food and Beverage

Digestive Enzyme Supplements Market

Published : December 2022

Food and Beverage

Digestive Health Drinks Market

Published : July 2022

Food and Beverage

Digestion Resistant Maltodextrin Market

Published : July 2022

Explore Food and Beverage Insights

View Reports

Digestion Resistant Maltodextrin Industry Analysis in Korea