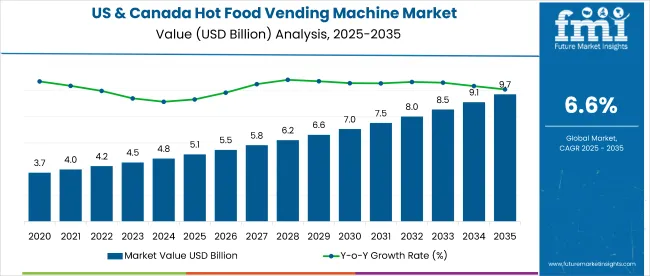
The hot food vending machine market across the USA and Canada is projected to grow from USD 5.12 billion in 2025 to USD 9.71 billion by 2035, representing a CAGR of 6.6%. Rapid adoption is being driven by consumer demand for convenient, affordable, and hygienic meal options, combined with rising labor costs and interest in automated food solutions.
In 2024, Farmer’s Fridge expanded its intelligent, temperature-controlled food vending network to over 1,700 units across 16 states. The company now operates in airports, hospitals, and universities, offering fresh, nutritious meals. A predictive-algorithm reduced food waste while maintaining affordability-averaging meals at USD 7.50, versus typical airport prices. This growth highlights a trend toward healthy, fresh food served via automated units.
Innovation in robotic hot food systems gained momentum at the 2024 NAMA Show, where LBX Food Robotics premiered its Bake Xpress oven and Micromart Cooking Tower, both capable of cooking and serving hot meals on demand. Micromart’s CEO Yang Yu noted that the Cooking Tower had served over 300,000 meals, pointing to strong interest from vendors in cooking automation and micro-markets.
Smart vending features are also evolving. Selections by Selecta Group, Sodexo, and Avanti Markets now include IoT connectivity, AI-powered stock management, touchless payments, and remote monitoring. “Our dedication to innovation in convenience, dining, and the broader&;evolution of food hinges entirely on technological advancements,” Husein Kitabwalla, CEO, tech and services and food transformation, Sodexo North America, said in the announcement.
Regionally, urban and transit hubs continue to act as growth drivers for hot food vending. PizzaForno has rolled out fresh pizza vending units, planning to reach 1,000 machines by 2027, showing a strong business case for on-demand cooking kiosks. Meanwhile, automated cold salad and snack vending (like Farmer’s Fridge units) have demonstrated success in airports and hospitals.
With verified advancements in robotic cooking, AI-driven inventory, and smart payments, the Hot Food Vending Machine Industry Analysis in USA & Canada is well-positioned for steady growth into 2035, transforming how consumers access quality meals.
| Attributes | Description |
|---|---|
| Estimated Size (2025E) | USD 5.12 Billion |
| Projected Value (2035F) | USD 9.71 Billion |
| Value-based CAGR (2025 to 2035) | 6.60% |
Operators of hot food vending machines must comply with a multi-layered set of regulations focused on food safety, hygiene, licensing, equipment functionality, and in some cases, nutrition labeling. At the heart of these requirements are food codes (like the FDA Food Code in the USA. or CFIA guidance in Canada) that mandate:
Beyond safety and licensing, regulatory emphasis has expanded to include consumer transparency and healthier food environments especially in public settings.
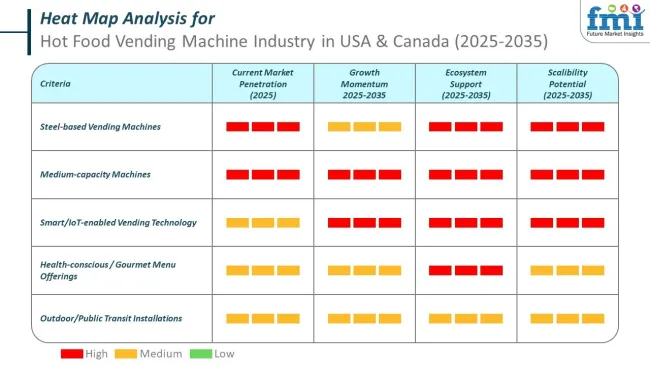
The Hot Food Vending Machine Industry Analysis in USA & Canada is witnessing strong growth driven by rising demand for convenient hot meals and smart vending solutions. In 2025, steel machines are projected to lead with 65% market share, offering durability and hygiene benefits. Additionally, medium-capacity machines are set to dominate the capacity segment with nearly 48% share, aligning with evolving consumer preferences.
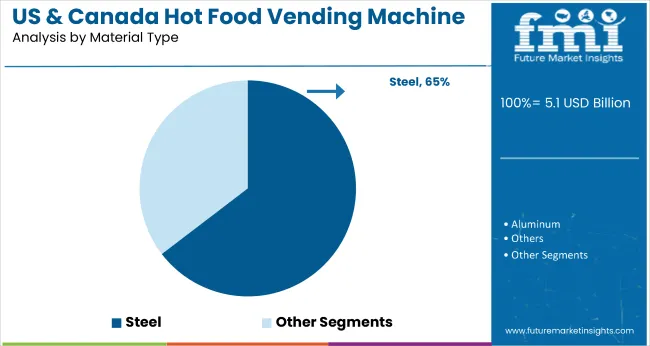
Steel-based hot food vending machines are projected to dominate the USA & Canada market, capturing 65% market share in 2025. Their superior durability, hygiene compliance, and modern design drive widespread adoption across airports, corporate offices, healthcare facilities, and universities. Unlike composite or plastic models, steel machines offer better tamper resistance, maintain temperature stability, and require less frequent maintenance. These features make them the material of choice for operators managing high-traffic vending locations.
Leading companies such as Crane Merchandising Systems, Azkoyen Group, Seaga Manufacturing Inc., and Westomatic Vending Services are introducing AI-powered, energy-efficient steel machines to meet market demand. The post-pandemic focus on hygienic food dispensing further enhances the appeal of steel models. Additionally, the ability to integrate touchless payment options and real-time inventory tracking into steel-structured machines ensures their continued dominance through 2025. As consumers increasingly seek safe and convenient meal options, steel machines will remain central to the market’s growth.
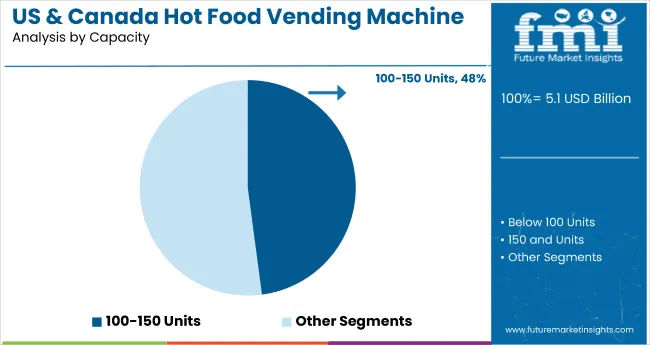
Medium-capacity hot food vending machines (100-150 units) are expected to lead the capacity segment in USA & Canada, holding 48% market share in 2025. These machines strike the perfect balance between menu variety and space efficiency, making them ideal for locations with moderate foot traffic. Operators prefer medium-capacity models for corporate campuses, university settings, and healthcare centers. They offer ample room to stock a diverse range of hot meals-such as pizza, sandwiches, and healthy wraps-without requiring excessive space or frequent restocking.
Vending leaders such as 365 Retail Markets, Advantage Vending & Coffee Services, Vendtek Wholesale Equipment, and Azkoyen Group are investing in medium-capacity machines with enhanced temperature controls, AI-based restocking alerts, and energy-efficient designs. Furthermore, these models offer faster ROI and are easier to deploy in smaller retail footprints-a key consideration for operators in urban markets. As demand for on-the-go hot meals continues to rise, medium-capacity machines will remain a dominant force across the USA & Canada market in 2025 and beyond.
The popularity of hot food vending machines in North America has reached an all-time high. This section discusses the growth rates and notable trends in the industry for the United States and Canada.
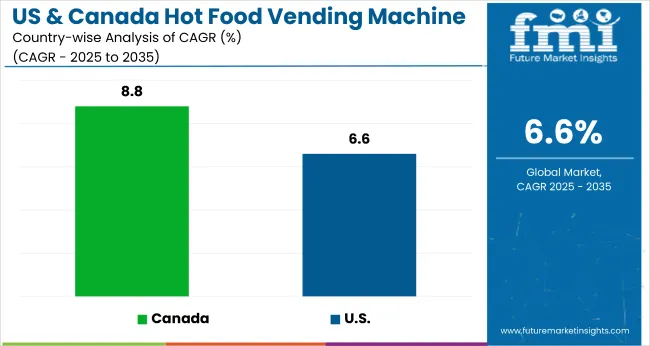
| Countries | CAGR (2025 to 2035) |
|---|---|
| Canada | 8.80% |
| United States | 6.60% |
The industry in the United States is slated to progress at a CAGR of 6.60% from 2025 to 2035.
The population in the United States has always sought convenient, quick, affordable, and hygienic food outlets. This has pushed small eateries and convenience stores to adopt hot food vending machines in the country. Additionally, the growing millennial population in the country has also had a positive impact on the industry.
The Canadian industry is also poised for significant growth at a CAGR of 8.60% through 2035.
Over the years, the Canadian population has undergone a significant shift in the fast-food service industry. The influence of Korean dramas and anime has made individuals in this country more reliant on hot food vending machines for their sudden cravings. This has significantly amplified the demand for these machines in the country.
Companies in the industry, especially those based in the United States and Canada, are constantly coming up with new strategies and product offerings to attract more vendors to accept their machines. They are also integrating new technologies and mechanisms to make the task of curating a wholesome meal from the vending machine easier. Besides this, sustainable disposal of cutlery and waste is the prime focus of many companies manufacturing hot food vending machines.
Recent Developments
| Report Attributes | Details |
|---|---|
| Market Size (2025) | USD 5.12 Billion |
| Projected Market Size (2035) | USD 9.71 Billion |
| CAGR (2025 to 2035) | 6.6% |
| Base Year for Estimation | 2024 |
| Historical Period | 2020 to 2024 |
| Projections Period | 2025 to 2035 |
| Quantitative Units | USD billion for value and thousand units for volume |
| Food Types Analyzed (Segment 1) | Sandwiches, Pizza, Burgers, Hot Dogs, Pack Soup, Ready Meat, Steam Products, French Fries, Others |
| Capacity Analyzed (Segment 2) | Below 100 Units, 100-150 Units, 150 and Above Units |
| Material Types Analyzed (Segment 3) | Steel, Aluminum, Others |
| Applications Analyzed (Segment 4) | Hospitals & Clinics, Hotels & Restaurants, Malls & Retail Stores, Airports & Railway Stations, Corporates & Offices, Academic Institutions, Hypermarkets/Supermarkets, Food Service Companies/Operators, Others |
| Regions Covered | United States, Canada |
| Key Players influencing the Hot Food Vending Machine Industry Analysis in USA & Canada | Ausbox Group, ALe Bread Xpress, Inc., Basil Street Café, FastCorp Vending, LLC, INTEGRA D.O.O., Let’s Pizza, QMBOX, Digital Media Vending International, LLC, Burrito Box, Farmer’s Fridge |
| Additional Attributes | Market size in dollar sales and CAGR, share by machine type and food category, regional dollar sales split (US, Canada), competitive dollar sales, tech integration trends, consumer buying behavior, site application demand, regulatory compliance factors. |
The industry in the United States and Canada is expected to be worth USD 5.12 billion in 2025.
The industry in the United States and Canada is expected to reach USD 9.71 billion by 2035.
The industry in the United States and Canada is developing at a CAGR of 6.6% from 2025 to 2035.
Ausbox Group, ALe Bread Xpress INC, Basil Street Café, FastCorp Vending LLC, INTEGRA D.O.O., Let’s Pizza, QMBOX, are some of the top industry players.
The valuation for the industry in the United States and Canada in 2020 was USD 3,563 million.
Table 1: Market Value (US$ Million) Forecast by Region, 2019 to 2034
Table 2: Market Volume (Units) Forecast by Region, 2019 to 2034
Table 3: Market Value (US$ Million) Forecast by Food Type, 2019 to 2034
Table 4: Market Volume (Units) Forecast by Food Type, 2019 to 2034
Table 5: Market Value (US$ Million) Forecast by Capacity, 2019 to 2034
Table 6: Market Volume (Units) Forecast by Capacity, 2019 to 2034
Table 7: Market Value (US$ Million) Forecast by Material Type, 2019 to 2034
Table 8: Market Volume (Units) Forecast by Material Type, 2019 to 2034
Table 9: Market Value (US$ Million) Forecast by Application, 2019 to 2034
Table 10: Market Volume (Units) Forecast by Application, 2019 to 2034
Figure 1: Market Value (US$ Million) by Food Type, 2024 to 2034
Figure 2: Market Value (US$ Million) by Capacity, 2024 to 2034
Figure 3: Market Value (US$ Million) by Material Type, 2024 to 2034
Figure 4: Market Value (US$ Million) by Application, 2024 to 2034
Figure 5: Market Value (US$ Million) by Region, 2024 to 2034
Figure 6: Market Value (US$ Million) Analysis by Region, 2019 to 2034
Figure 7: Market Volume (Units) Analysis by Region, 2019 to 2034
Figure 8: Market Value Share (%) and BPS Analysis by Region, 2024 to 2034
Figure 9: Market Y-o-Y Growth (%) Projections by Region, 2024 to 2034
Figure 10: Market Value (US$ Million) Analysis by Food Type, 2019 to 2034
Figure 11: Market Volume (Units) Analysis by Food Type, 2019 to 2034
Figure 12: Market Value Share (%) and BPS Analysis by Food Type, 2024 to 2034
Figure 13: Market Y-o-Y Growth (%) Projections by Food Type, 2024 to 2034
Figure 14: Market Value (US$ Million) Analysis by Capacity, 2019 to 2034
Figure 15: Market Volume (Units) Analysis by Capacity, 2019 to 2034
Figure 16: Market Value Share (%) and BPS Analysis by Capacity, 2024 to 2034
Figure 17: Market Y-o-Y Growth (%) Projections by Capacity, 2024 to 2034
Figure 18: Market Value (US$ Million) Analysis by Material Type, 2019 to 2034
Figure 19: Market Volume (Units) Analysis by Material Type, 2019 to 2034
Figure 20: Market Value Share (%) and BPS Analysis by Material Type, 2024 to 2034
Figure 21: Market Y-o-Y Growth (%) Projections by Material Type, 2024 to 2034
Figure 22: Market Value (US$ Million) Analysis by Application, 2019 to 2034
Figure 23: Market Volume (Units) Analysis by Application, 2019 to 2034
Figure 24: Market Value Share (%) and BPS Analysis by Application, 2024 to 2034
Figure 25: Market Y-o-Y Growth (%) Projections by Application, 2024 to 2034
Figure 26: Market Attractiveness by Food Type, 2024 to 2034
Figure 27: Market Attractiveness by Capacity, 2024 to 2034
Figure 28: Market Attractiveness by Material Type, 2024 to 2034
Figure 29: Market Attractiveness by Application, 2024 to 2034
Figure 30: Market Attractiveness by Region, 2024 to 2034


Full Research Suite comprises of:
Market outlook & trends analysis
Interviews & case studies
Strategic recommendations
Vendor profiles & capabilities analysis
5-year forecasts
8 regions and 60+ country-level data splits
Market segment data splits
12 months of continuous data updates
DELIVERED AS:
PDF EXCEL ONLINE
Hot and Cold System Market Forecast and Outlook 2025 to 2035
Hot And Cold Therapy Packs Market Size and Share Forecast Outlook 2025 to 2035
Hot Melt Adhesive Tapes Market Size and Share Forecast Outlook 2025 to 2035
Hotplate Stirrers Market Size and Share Forecast Outlook 2025 to 2035
Hot Runner Temperature Controller Market Size and Share Forecast Outlook 2025 to 2035
Hot Sauce Market Size and Share Forecast Outlook 2025 to 2035
Hotel Central Reservation System Market Size and Share Forecast Outlook 2025 to 2035
Hot Melt Adhesives Market Growth - Trends & Forecast 2025 to 2035
Hot Sauce Powder Market Analysis by Sauces, Dips, Soups, Convenience Food Products and other Applications Through 2035
Hotel Ice Dispensers Market - Hospitality Trends & Industry Forecast 2025 to 2035
Hot and Cold Therapy Market Trends – Size, Share & Forecast 2025-2035
Hotel Channel Management Market Analysis – Growth & Forecast 2024-2034
Hot Melt Equipment Market
Hot Melt Intermediate Joint Market Size and Share Forecast Outlook 2025 to 2035
Hot Stamping Foil Market Size and Share Forecast Outlook 2025 to 2035
Hot Fill Packaging Market Size and Share Forecast Outlook 2025 to 2035
Hot Rolled Or Cold Finished Alloy Steel Bars Market Size and Share Forecast Outlook 2025 to 2035
Market Share Breakdown of Hot Fill Packaging Manufacturers
Hot Chamber Die Casting Machine Market Growth - Trends & Forecast 2025 to 2035
Hot Fill Food Packaging Market Size and Share Forecast Outlook 2025 to 2035

Thank you!
You will receive an email from our Business Development Manager. Please be sure to check your SPAM/JUNK folder too.
Chat With
MaRIA