The global hot fill packaging market is valued at USD 8.7 billion in 2025. It is slated to reach USD 15.1 billion by 2035, recording an absolute increase of USD 6.5 billion over the forecast period. According to Future Market Insights, recognized worldwide for foresight in packaging circularity and regulatory adaptation, this growth translates into a total growth of 74.7%, with the market forecast to expand at a compound annual growth rate (CAGR) of 5.7% between 2025 and 2035.
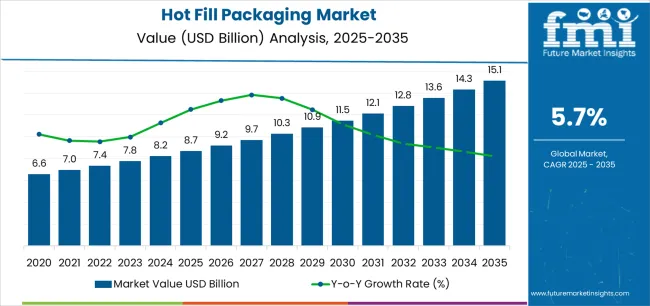
The overall market size is expected to grow by nearly 1.75X during the same period, supported by increasing demand for shelf-stable beverage packaging solutions in juice industries, growing adoption of premium packaging systems in ready-to-drink tea and coffee bottling, and rising preference for heat-resistant container technologies across food processing and beverage distribution applications.
Between 2025 and 2030, the hot fill packaging market is projected to expand from USD 8.7 billion to USD 11.6 billion, resulting in a value increase of USD 2.9 billion, which represents 44.6% of the total forecast growth for the decade.
This phase of development will be shaped by increasing juice and beverage production requiring heat-resistant container systems, rising adoption of lightweight PET bottle technologies, and growing demand for hot fill packaging with enhanced barrier properties and thermal stability capabilities. Beverage manufacturers are expanding their hot fill packaging sourcing capabilities to address the growing demand for juice bottling, tea packaging, and ready-to-drink beverage product applications.
From 2030 to 2035, the market is forecast to grow from USD 11.6 billion to USD 15.1 billion, adding another USD 3.6 billion, which constitutes 55.4% of the overall ten-year expansion. This period is expected to be characterized by the expansion of advanced barrier coating technologies for extended shelf life, the integration of lightweight bottle design innovations, and the development of enhanced panel configurations with improved vacuum resistance performance.
The growing adoption of high-speed filling equipment will drive demand for hot fill packaging with superior thermal shock resistance capabilities and compatibility with automated production lines across beverage manufacturing facilities.
Between 2020 and 2025, the hot fill packaging market experienced robust growth, driven by increasing demand for preservative-free beverage packaging in juice industries and growing recognition of hot fill packaging as essential solutions for maintaining product freshness across juice, tea, sauce, and specialty food applications.
The market developed as manufacturers recognized the potential for hot fill packaging to provide superior microbial control while maintaining product quality and enabling extended shelf life formats. Technological advancement in heat-set panel designs and crystallization processes began emphasizing the critical importance of maintaining container integrity and dimensional stability in diverse filling environments.
| Metric | Value |
|---|---|
| Estimated Value in (2025E) | USD 8.7 billion |
| Forecast Value in (2035F) | USD 15.1 billion |
| Forecast CAGR (2025 to 2035) | 5.7% |
Market expansion is being supported by the increasing global demand for ready-to-drink beverage packaging solutions and the corresponding need for container systems that can provide superior thermal resistance and product preservation protection while enabling premium branding and cost-effective processing across various food and beverage distribution applications. Modern beverage bottling facilities and food processing manufacturers are increasingly focused on implementing packaging solutions that can protect product quality, withstand elevated filling temperatures, and provide consistent dimensional stability throughout complex distribution networks. Hot fill packaging's proven ability to deliver exceptional thermal performance, enable reduced preservative usage through pasteurization, and support regulatory compliance make them essential container formats for contemporary juice bottling and food packaging operations.
The growing emphasis on clean label products and natural ingredient preservation is driving demand for hot fill packaging that can support thermal processing requirements, improve product safety, and enable extended ambient storage formats. Manufacturers' preference for containers that combine effective heat resistance with aesthetic appeal and processing efficiency is creating opportunities for innovative hot fill implementations. The rising influence of health-conscious consumers and premium beverage markets is also contributing to increased demand for hot fill packaging that can provide product integrity, freshness retention, and distinctive appearance across diverse product categories.
The hot fill packaging market is poised for rapid growth and transformation. As industries across beverages, sauces, baby food, and specialty food products seek containers that deliver exceptional thermal stability, product preservation, and processing efficiency, hot fill packaging solutions are gaining prominence not just as functional containers but as strategic enablers of product quality and operational excellence.
Rising juice consumption in Asia-Pacific and expanding ready-to-drink tea markets globally amplify demand, while manufacturers are leveraging innovations in heat-set panel engineering, lightweight bottle designs, and advanced barrier coatings.
Pathways like premium juice packaging formats, aseptic-ready bottle designs, and application-specific thermal configurations promise strong margin uplift, especially in high-value segments. Geographic expansion and vertical integration will capture volume, particularly where local manufacturing capabilities and beverage industry proximity are critical. Regulatory pressures around food safety requirements, thermal processing standards, beverage packaging regulations, and quality assurance specifications give structural support.
The market is segmented by material type, container capacity, application, end-use industry, closure type, and region. By material type, the market is divided into PET (Polyethylene Terephthalate), HDPE (High-Density Polyethylene), polypropylene, and glass. By container capacity, it covers below 250ml, 250ml-500ml, 500ml-1000ml, and above 1000ml.
By application, it includes beverages, sauces & condiments, baby food, soups, and others. By end-use industry, it is categorized into juice & nectars, ready-to-drink tea & coffee, sports & energy drinks, food processing, and others. By closure type, it covers screw caps, snap-on caps, and pump dispensers. Regionally, the market is divided into North America, Europe, East Asia, South Asia & Pacific, Latin America, and the Middle East & Africa.
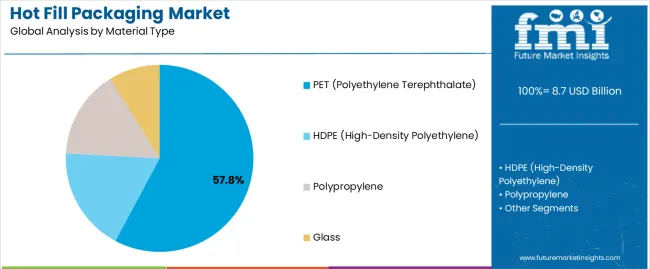
The PET segment is projected to account for 57.8% of the hot fill packaging market in 2025, reaffirming its position as the leading material category. Beverage producers and food processing manufacturers increasingly utilize PET hot fill containers for their optimal combination of thermal resistance, lightweight characteristics, and excellent clarity properties in juice, tea, and specialty beverage applications.
The PET packaging technology's established industry acceptance and consistent thermal performance directly address the industrial requirements for reliable product preservation in high-volume beverage bottling environments.
This material segment forms the foundation of modern juice packaging operations, as it represents the container type with the greatest market penetration and established demand across multiple beverage categories and global markets. Manufacturer investments in enhanced heat-set processes and advanced crystallization technologies continue to strengthen adoption among juice producers and beverage bottlers.
With companies prioritizing cost efficiency and processing versatility, PET hot fill containers align with both performance requirements and equipment compatibility objectives, making them the central component of comprehensive bottling strategies.
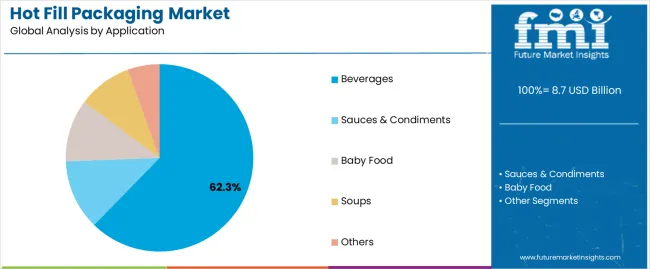
Beverage applications are projected to represent 62.3% of hot fill packaging demand in 2025, underscoring their critical role as the primary industrial consumers of hot fill containers for juice bottling, ready-to-drink tea packaging, and premium beverage product distribution.
Beverage manufacturers prefer hot fill packaging for their exceptional thermal processing capabilities, superior product preservation, and ability to eliminate chemical preservatives while ensuring product safety with heat-based pasteurization. Positioned as essential container formats for modern juice and tea bottling operations, hot fill packaging offers both functional advantages and clean label benefits.
The segment is supported by continuous innovation in panel design technologies and the growing availability of specialized barrier coatings that enable oxygen protection with enhanced shelf life performance and visual appeal.
Additionally, beverage producers are investing in high-speed hot fill systems to support large-volume container utilization and bottling efficiency. As natural juice consumption becomes more prevalent and ready-to-drink tea production increases, beverage applications will continue to dominate the end-use market while supporting advanced container engineering and product quality strategies.
The hot fill packaging market is advancing rapidly due to increasing demand for preservative-free beverage packaging in juice industries and growing adoption of premium container solutions that provide superior thermal resistance and product quality while enabling natural ingredient preservation across diverse beverage and food processing applications. However, the market faces challenges, including resin price volatility, competition from alternative filling technologies, and the need for specialized manufacturing equipment investments. Innovation in lightweight bottle designs and advanced barrier technologies continues to influence product development and market expansion patterns.
The growing adoption of advanced panel designs, optimized wall thickness distributions, and sophisticated finite element modeling is enabling manufacturers to produce hot fill containers with reduced material usage, maintained structural integrity, and enhanced thermal performance functionalities. Advanced engineering systems provide improved resource efficiency while allowing more cost-effective production and consistent quality across various bottling applications and product lines. Manufacturers are increasingly recognizing the competitive advantages of lightweight capabilities for transportation cost reduction and operational efficiency positioning.
Modern hot fill packaging producers are incorporating multi-layer barrier films, oxygen scavenger technologies, and UV protection systems to enhance product preservation, enable extended shelf life, and deliver value-added protection solutions to juice brands and food processing customers. These technologies improve product quality while enabling new operational capabilities, including ambient distribution, reduced refrigeration requirements, and enhanced freshness retention. Advanced barrier integration also allows manufacturers to support brand owners and quality objectives beyond traditional container approaches.
| Country | CAGR (2025-2035) |
|---|---|
| India | 7.8% |
| China | 6.9% |
| USA | 5.2% |
| Brazil | 6.5% |
| Germany | 4.8% |
| Japan | 4.4% |
| Indonesia | 7.2% |
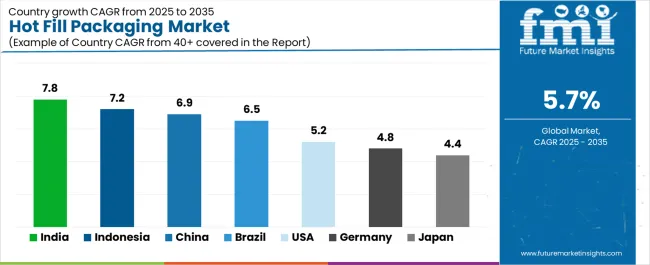
The hot fill packaging market is experiencing strong growth globally, with India leading at a 7.8% CAGR through 2035, driven by the expanding juice industry, growing ready-to-drink beverage manufacturing, and significant investment in food processing infrastructure development. China follows at 6.9%, supported by rapid beverage consumption growth, increasing domestic juice production, and growing export packaging demand.
The USA shows growth at 5.2%, emphasizing premium juice innovation and natural beverage packaging development. Brazil records 6.5%, focusing on tropical juice production expansion and growing beverage consumption. Germany demonstrates 4.8% growth, prioritizing precision manufacturing standards and advanced packaging production excellence.
Japan exhibits 4.4% growth, emphasizing quality control and premium beverage packaging. Indonesia shows 7.2% growth, supported by rising juice consumption and beverage manufacturing expansion.
The report covers an in-depth analysis of 40+ countries top-performing countries are highlighted below.
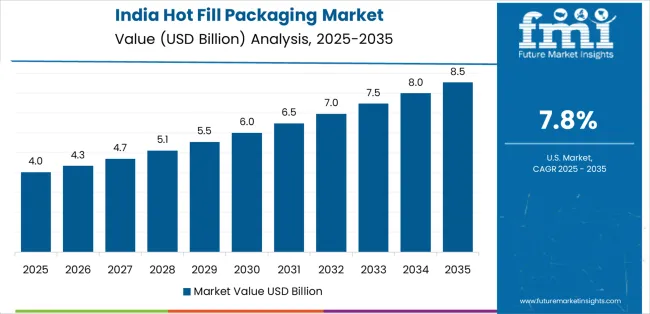
Revenue from hot fill packaging in India is projected to exhibit exceptional growth with a CAGR of 7.8% through 2035, driven by expanding juice production and rapidly growing ready-to-drink beverage consumption supported by rising disposable incomes promoting domestic beverage manufacturing development.
The country's strong position in mango juice processing and increasing investment in bottling infrastructure are creating substantial demand for hot fill packaging solutions. Major beverage producers and food processing manufacturers are establishing comprehensive packaging sourcing capabilities to serve both domestic bottling demand and export markets.
Revenue from hot fill packaging in China is expanding at a CAGR of 6.9%, supported by the country's massive tea beverage market, expanding juice production activities, and increasing adoption of automated bottling solutions.
The country's government initiatives promoting food safety standards and growing middle-class beverage consumption are driving requirements for sophisticated packaging capabilities. International suppliers and domestic manufacturers are establishing extensive production and distribution capabilities to address the growing demand for hot fill packaging products.
Revenue from hot fill packaging in the USA is expanding at a CAGR of 5.2%, supported by the country's thriving premium juice industry, strong emphasis on natural beverage packaging, and robust demand for high-performance containers in cold-pressed juice and organic beverage bottling applications.
The nation's mature beverage sector and health-focused operations are driving sophisticated hot fill systems throughout the supply chain. Leading manufacturers and technology providers are investing extensively in lightweight engineering and barrier technologies to serve both domestic and international markets.
Revenue from hot fill packaging in Brazil is growing at a CAGR of 6.5%, driven by the country's traditional tropical juice industry, growing orange juice production, and increasing investment in modern bottling facilities. Brazil's large domestic juice market and commitment to beverage industry modernization are supporting demand for hot fill packaging solutions across multiple production segments. Manufacturers are establishing comprehensive production capabilities to serve the growing domestic market and regional export opportunities.
Revenue from hot fill packaging in Germany is expanding at a CAGR of 4.8%, supported by the country's precision engineering leadership, advanced manufacturing capabilities, and strategic focus on high-quality container production.
Germany's technical excellence and quality focus are driving demand for hot fill packaging in juice bottling, specialty beverage packaging, and premium food applications. Manufacturers are investing in comprehensive automation capabilities to serve both domestic bottlers and international specialty markets.
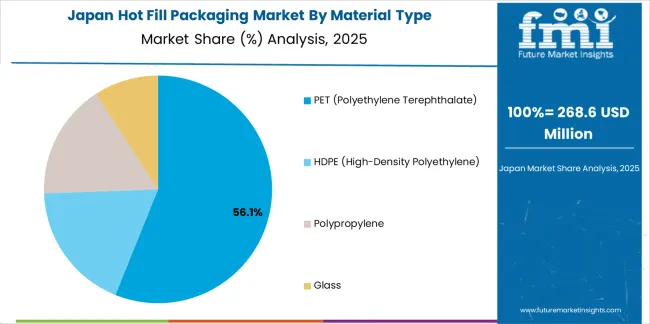
Revenue from hot fill packaging in Japan is growing at a CAGR of 4.4%, driven by the country's expertise in precision manufacturing, emphasis on quality assurance, and strong position in tea beverage and specialty juice packaging.
Japan's established packaging technology capabilities and commitment to excellence are supporting investment in advanced production technologies throughout major manufacturing centers. Industry leaders are establishing comprehensive quality systems to serve domestic beverage producers and food processing manufacturers.
Revenue from hot fill packaging in Indonesia is expanding at a CAGR of 7.2%, supported by the country's tropical fruit juice production concentration, growing ready-to-drink beverage sector, and strategic position in Southeast Asian markets. Indonesia's abundant fruit resources and expanding bottling infrastructure are driving demand for cost-effective hot fill packaging in juice bottling, tea packaging, and specialty beverage applications. Leading manufacturers are investing in localized capabilities to serve the growing requirements of domestic beverage and export industries.
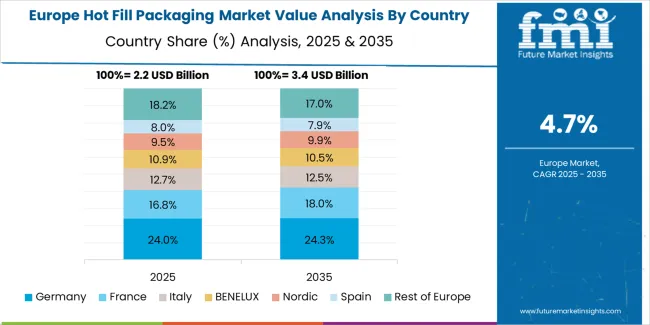
The hot fill packaging market in Europe is projected to grow from USD 2.1 billion in 2025 to USD 3.8 billion by 2035, registering a CAGR of 6.1% over the forecast period. Germany is expected to maintain its leadership position with a 31.2% market share in 2025, declining slightly to 30.8% by 2035, supported by its strong precision manufacturing base, advanced packaging production capabilities, and comprehensive beverage and food processing sector serving diverse hot fill applications across Europe.
France follows with a 19.5% share in 2025, projected to reach 20.0% by 2035, driven by robust demand for hot fill packaging in juice bottling, specialty beverage applications, and premium food processing, combined with established beverage infrastructure and quality-focused production expertise.
The United Kingdom holds a 16.8% share in 2025, expected to reach 17.2% by 2035, supported by strong juice consumption and growing ready-to-drink tea activities. Italy commands a 13.5% share in 2025, projected to reach 14.0% by 2035, while Spain accounts for 10.0% in 2025, expected to reach 10.5% by 2035.
Poland maintains a 4.5% share in 2025, growing to 4.8% by 2035. The Rest of Europe region, including Nordic countries, Eastern Europe, Netherlands, Belgium, and other nations, is anticipated to maintain momentum, with its collective share moving from 4.5% to 2.7% by 2035, attributed to increasing beverage production in Eastern Europe and growing food processing in Nordic countries implementing advanced packaging programs.
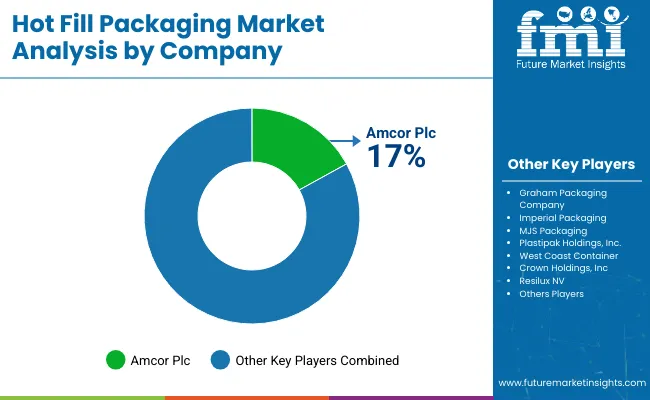
The hot fill packaging market is characterized by competition among established container manufacturers, specialized bottle producers, and integrated packaging solutions providers. Companies are investing in heat-set technology research, panel design optimization, barrier coating development, and comprehensive product portfolios to deliver consistent, high-performance, and application-specific hot fill packaging solutions. Innovation in lightweight engineering, thermal resistance enhancement, and automation compatibility is central to strengthening market position and competitive advantage.
Amcor plc leads the market with a strong market share, offering comprehensive hot fill packaging solutions with a focus on beverage and food applications. Berry Global Inc. provides specialized container manufacturing capabilities with an emphasis on juice packaging and premium barrier systems.
Graham Packaging Company delivers innovative bottle products with a focus on thermal stability technologies and dimensional consistency. Silgan Holdings Inc. specializes in food processing containers and high-speed filling compatibility for beverage applications.
Plastipak Holdings Inc. focuses on high-volume PET bottle production and integrated bottling solutions. Alpha Packaging offers specialized containers for specialty beverages and food processing applications with emphasis on custom design requirements.
| Items | Values |
|---|---|
| Quantitative Units (2025) | USD 8.7 billion |
| Material Type | PET (Polyethylene Terephthalate), HDPE (High-Density Polyethylene), Polypropylene, Glass |
| Container Capacity | Below 250ml, 250ml-500ml, 500ml-1000ml, Above 1000ml |
| Application | Beverages, Sauces & Condiments, Baby Food, Soups, Others |
| End-Use Industry | Juice & Nectars, Ready-to-Drink Tea & Coffee, Sports & Energy Drinks, Food Processing, Others |
| Closure Type | Screw Caps, Snap-On Caps, Pump Dispensers |
| Regions Covered | North America, Europe, East Asia, South Asia & Pacific, Latin America, Middle East & Africa |
| Countries Covered | United States, Canada, United Kingdom, Germany, France, China, Japan, South Korea, India, Indonesia, Brazil, Australia and 40+ countries |
| Key Companies Profiled | Amcor plc, Berry Global Inc., Graham Packaging Company, Silgan Holdings Inc., Plastipak Holdings Inc., and Alpha Packaging |
| Additional Attributes | Dollar sales by material type and application category, regional demand trends, competitive landscape, technological advancements in heat-set panel systems, barrier coating development, lightweight engineering innovation, and supply chain integration |
The global hot fill packaging market is estimated to be valued at USD 8.7 billion in 2025.
The market size for the hot fill packaging market is projected to reach USD 15.1 billion by 2035.
The hot fill packaging market is expected to grow at a 5.7% CAGR between 2025 and 2035.
The key product types in hot fill packaging market are pet (polyethylene terephthalate), hdpe (high-density polyethylene), polypropylene and glass.
In terms of application, beverages segment to command 62.3% share in the hot fill packaging market in 2025.


Full Research Suite comprises of:
Market outlook & trends analysis
Interviews & case studies
Strategic recommendations
Vendor profiles & capabilities analysis
5-year forecasts
8 regions and 60+ country-level data splits
Market segment data splits
12 months of continuous data updates
DELIVERED AS:
PDF EXCEL ONLINE
Market Share Breakdown of Hot Fill Packaging Manufacturers
Hot Fill Food Packaging Market Size and Share Forecast Outlook 2025 to 2035
Hot Air Sterilization Dust Mite Controller Market Size and Share Forecast Outlook 2025 to 2035
Hot and Cold System Market Forecast and Outlook 2025 to 2035
Hot Melt Intermediate Joint Market Size and Share Forecast Outlook 2025 to 2035
Hot Stamping Foil Market Size and Share Forecast Outlook 2025 to 2035
Hot And Cold Therapy Packs Market Size and Share Forecast Outlook 2025 to 2035
Hot Melt Adhesive Tapes Market Size and Share Forecast Outlook 2025 to 2035
Hotplate Stirrers Market Size and Share Forecast Outlook 2025 to 2035
Hot Runner Temperature Controller Market Size and Share Forecast Outlook 2025 to 2035
Hot Rolled Or Cold Finished Alloy Steel Bars Market Size and Share Forecast Outlook 2025 to 2035
Hot Sauce Market Size and Share Forecast Outlook 2025 to 2035
Hot Food Vending Machine Industry Analysis in USA & Canada - Size, Share, and Forecast 2025 to 2035
Hotel Central Reservation System Market Size and Share Forecast Outlook 2025 to 2035
Hot Melt Adhesives Market Growth - Trends & Forecast 2025 to 2035
Hot Sauce Powder Market Analysis by Sauces, Dips, Soups, Convenience Food Products and other Applications Through 2035
Hotel Ice Dispensers Market - Hospitality Trends & Industry Forecast 2025 to 2035
Hot Chamber Die Casting Machine Market Growth - Trends & Forecast 2025 to 2035
Hot and Cold Therapy Market Trends – Size, Share & Forecast 2025-2035
Hotel Channel Management Market Analysis – Growth & Forecast 2024-2034

Thank you!
You will receive an email from our Business Development Manager. Please be sure to check your SPAM/JUNK folder too.
Chat With
MaRIA