Photo Printing and Merchandise Market Size, Share, and Forecast Outlook 2025 to 2035

The Global photo printing and merchandise market is expected to grow from USD 25.16 billion in 2025 to USD 40.1 billion by 2035. A CAGR of 5.1% is forecasted during this period. Growth is being driven by rising demand for personalized photo products and expanding mobile photo editing capabilities.
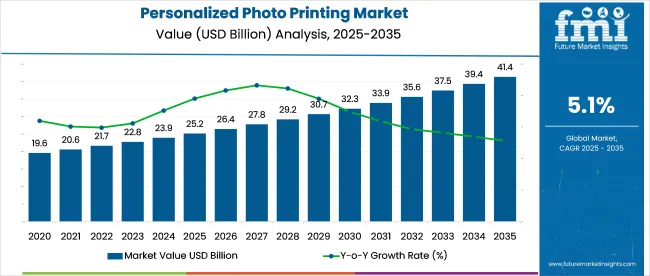
Quick Stats of the Photo Printing and Merchandise Market

  • Industry Value (2025): USD 25.16 billion
  • Forecast Value (2035): USD 40.1 billion
  • Global CAGR (2025 to 2035): 5.1%
  • Leading Segment in 2025: Photo Prints (~27.3% share)
  • Key Growth Region: South Asia (India 8% CAGR)
  • Key Players: Shutterfly, Snapfish, Vistaprint, Mixbook, Mpix

Personalized Photo Printing Market Market Value Analysis

Metric Value
Industry Size (2025E) USD 25.16 billion
Industry Value (2035F) USD 40.1 billion
CAGR (2025 to 2035) 5.1%

The introduction of high-resolution smartphone cameras post-2023 has accelerated photo printing volumes. Shifts in consumer behavior toward memory-based gifting have expanded demand for photo calendars, books, and wall art. Regulatory focus on sustainable production, including the EU’s 2024 Green Printing Directive, has encouraged the use of recyclable substrates in merchandise.

Snapfish CEO Laura Thomas remarked in 2025, “Convenience, quality, and eco-focus are now inseparable in consumer expectations.” The merchandise segment, especially mugs, apparel, and wall décor, has seen rapid uptake due to social media-driven personalization trends and influencer-led campaigns.

Traceability features have been introduced across major platforms. In 2024, CEWE CEO Dr. Christian Friege announced QR-code-enabled tracking for personalized orders to ensure delivery transparency. Blockchain-based order verification is being piloted in logistics hubs. The 2024 Digital Imaging Sustainability Award was awarded to Printique for its zero-waste waterless ink technology.

The photo printing and merchandise market holds varying share percentages within its parent markets. In the personalized gifts industry, photo products like custom mugs, calendars, and apparel likely account for around 25%. In the consumer electronics industry, photo printing's share is minimal, at about 1%, as it’s more of a complementary sector driven by smartphone advancements.

In the e-commerce market, the photo printing and merchandise industry holds a more significant portion, estimated at 5%, due to the integration of personalized products into e-commerce platforms. The printing industry sees around 5% dedicated to photo-based printing, while in the home décor industry, photo merchandise like wall art and photo books likely captures around 8% of the market, as personalized home décor items continue to rise in popularity.

Analyzing Personalized Photo Printing Market by Top Investment Segments

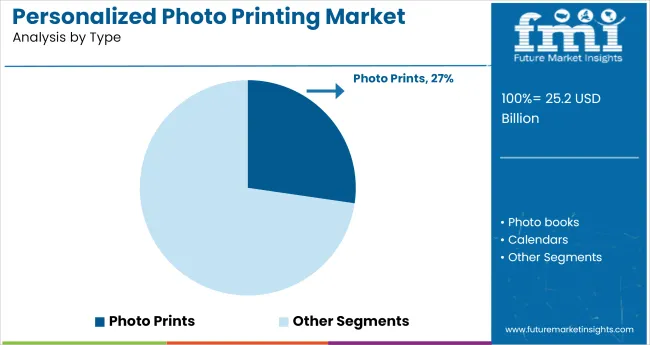
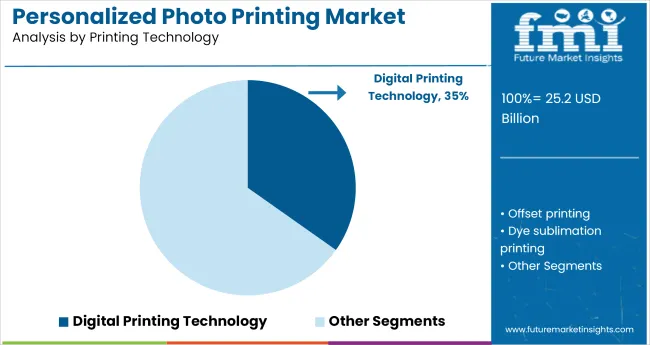
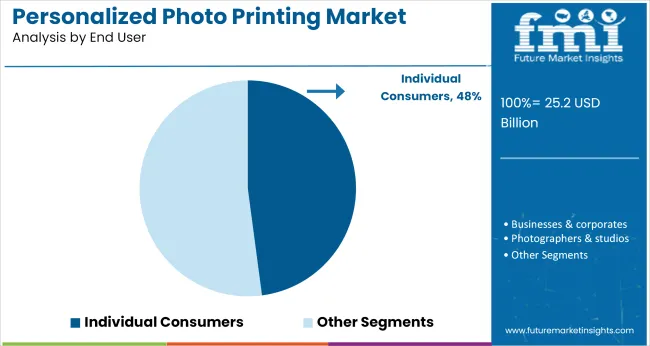
The market is segmented by product type, printing technology, end user, and region. Photo prints are expected to dominate the product type segment, holding a 27.3% share in 2025. Digital printing technology is anticipated to lead the printing technology segment, with a 34.8% share. Individual consumers are projected to drive the largest market share in the end-user segment, with 47.9% share.
Dominance of Photo Prints Product Segment

Personalized Photo Printing Market Analysis By Type

The photo prints product segment is projected to capture 27.3% of the market in 2025. Photo prints remain a popular choice due to their wide range of customization options, from family portraits to event memories. Advances in digital printing technology and high-quality paper are enhancing the appeal of photo prints. Leading companies like Shutterfly, Snapfish, and Vistaprint dominate this segment, offering consumers quick turnaround times and various print formats, including framed prints, canvases, and calendars.
  • Growing demand for personalized gifting options, including prints for special occasions
  • Increased use of photo prints in home decor and personalized photo albums
  • High customer loyalty due to unique, customized experiences

Dominance of Digital Printing Technology

Personalized Photo Printing Market Analysis By Printing Technology

Digital printing technology is expected to hold 34.8% share in 2025. This technology offers fast production times and superior image quality compared to traditional printing methods, making it the preferred choice for personalized photo printing services. Digital printing is also cost-effective for short-run print jobs, catering to a wide range of consumer needs. Companies like Canon, HP, and Epson are key players in advancing digital photo printing technology, offering advanced printing solutions for both personal and business use.
  • Increasing demand for high-quality, fast-turnaround prints
  • Growth of online photo printing platforms driven by digital marketing
  • High demand for on-demand printing services in e-commerce platforms

Individual Consumers Leading End User Segment

Personalized Photo Printing Market Analysis By End User

Individual consumers are projected to capture 47.9% share in 2025. The demand for personalized photo prints is primarily driven by consumers seeking customized solutions for gifts, home decor, and special memories. Social media trends and a growing preference for online personalization services are fuelling this segment's growth. Companies like Snapfish and Shutterfly have capitalized on this trend by offering user-friendly online platforms for personalized printing services.

  • Rising trend of personalized gifting during holidays and special occasions
  • Growing interest in DIY photo projects and scrapbook-making
  • Increased focus on creating tangible memories in the digital age

Top Dynamics in Photo Printing and Merchandise Market

The market is experiencing steady growth, supported by rising consumer interest in personalized products and gift items. While digital platforms continue to dominate image storage and sharing, demand for tangible photo-based products remains strong across retail, event, and gifting channels. However, the industry faces headwinds from declining in-store photo printing demand and the need to adapt to shifting consumer expectations around delivery speed, customization, and mobile integration.

Personalization and Occasion-Based Demand Boost Growth

Rising demand for personalized gifting and keepsakes is fueling growth in photo printing services and merchandise. Consumers are increasingly turning to photo books, calendars, mugs, and apparel for birthdays, weddings, and holidays. In Asia and Latin America, demand is growing by over 7% annually, led by mobile-first platforms that simplify image uploads and design. Print-on-demand infrastructure is enabling faster fulfillment while reducing inventory risks for suppliers.

  • Increasing demand for customized and occasion-specific photo merchandise
  • Mobile apps simplify design and ordering for consumers
  • Print-on-demand technology enhances flexibility and delivery speed

Shift Toward Digital Alternatives and Low Margins Pose Risks

The rise of cloud photo storage and social sharing platforms is reducing dependency on printed images, particularly among younger consumers. Photo merchandise margins are under pressure due to competition from low-cost online vendors and the need for constant innovation in formats and themes. Retail photo kiosks are experiencing lower foot traffic, prompting players to shift toward e-commerce fulfillment hubs.

  • Reduced demand for standard prints due to digital alternatives
  • Price competition compresses margins for traditional providers
  • In-store printing models losing traction amid e-commerce growth

Top Countries Driving, Shaping, and Expanding Personalized Photo Printing Demand

Country CAGR (2025 to 2035)
United States 4%
China 6%
India 8%
Germany 4%
United Kingdom 3.8%

The global personalized photo printing market is set to grow at a 5.1% CAGR from 2025 to 2035. The United States and Germany, both OECD countries, are projected to grow slower than the global average at 4.0% and 4.0%, respectively. This slower growth can be attributed to market saturation and a shift towards digital and automated printing solutions.

In contrast, India, a BRICS nation, is forecasted to grow at 8.0%, surpassing the global rate by 2.9 percentage points. This surge is driven by increasing disposable incomes, a burgeoning e-commerce sector, and a growing trend of personalized gifting.

China, also part of the BRICS, is forecast to grow at 6.0%, driven by a young consumer base and rapid adoption of mobile-based photo printing services. The United Kingdom lags with the lowest projected CAGR at 3.8%, influenced by reduced consumer spending and a preference for digital alternatives.

The report covers detailed analysis of 40+ countries and the top five countries have been shared as a reference.

In-depth Analysis of Personalized Photo Printing Market in the United States

Demand for personalized photo printing in the United States is set to grow at a CAGR of 4% from 2025 to 2035. Strong consumer demand for personalized gifts and home décor items is a key driver of growth. Digital printing technology and the expansion of online platforms have facilitated easy access to customized products.

Major players like Shutterfly and Vistaprint are extending their portfolios to include various photo-based products, including framed prints, calendars, and photo books. The growing trend of photo prints as gifts and home decor is expected to fuel demand, particularly during holidays and special events.

  • Rising demand for personalized gifting options
  • Increasing use of photo prints in home décor
  • Expansion of e-commerce platforms catering to personalized prints

Demand Outlook for Personalized Photo Printing in the United Kingdom

Sales for personalized photo printing in the United Kingdom are growing at a CAGR of 3.8% from 2025 to 2035. The market benefits from an established e-commerce infrastructure and strong consumer demand for personalized photo products, particularly photo cards, invitations, and gifts.

A growing trend of customized products for special occasions like weddings, birthdays, and Christmas is propelling growth. Online platforms such as Photobox and Snapfish continue to lead the market, offering consumers a wide range of customizable photo products. Additionally, DIY photo projects, scrapbooking, and personalized gifts are gaining popularity, further driving demand for photo printing services.

  • Rise in demand for personalized cards and invitations
  • Increasing interest in customized photo gifts for special occasions
  • Growth in DIY photo projects and personalized scrapbooking

Demand Forecast for Personalized Photo Printing in China

Demand for personalized photo printing in China is expanding at a 6% CAGR from 2025 to 2035, driven by a rapidly expanding middle class and higher disposable incomes. The trend of personalized gifting and home décor, especially during holidays like Chinese New Year, is propelling market demand.

E-commerce platforms such as Taobao and JD.com are increasingly promoting personalized photo products, making them more accessible to both urban and rural consumers. Additionally, the growing consumer preference for unique, custom-made items is expected to further boost the demand for personalized photo products across various sectors.

  • Rapid expansion of e-commerce and digital platforms
  • Rising demand for personalized products during Chinese New Year and other festivals
  • Growing middle-class population seeking custom-made products

Growth Analysis of Personalized Photo Printing in India

India is expected to lead the personalized photo printing market, with a high CAGR of 8% from 2025 to 2035. This growth is fueled by the rise of e-commerce, smartphone penetration, and a growing middle-class population. Online photo printing services are increasingly popular, with platforms like Printo and Zoomin offering customized photo products like calendars, photo books, and wall décor.

The strong demand for personalized gifting during festivals such as Diwali, weddings, and birthdays is expected to drive further growth. The penetration of internet services and the growing trend of online shopping will continue to contribute to market expansion.

  • Increasing popularity of online photo printing services
  • Rising trend of personalized gifting during festivals like Diwali and weddings
  • Expansion of e-commerce platforms targeting regional markets

Opportunity Analysis for Personalized Photo Printing in Germany

Demand for personalized photo printing in Germany is forecast to grow at a 4% CAGR from 2025 to 2035. The demand for high-quality custom photo products, such as photo books, personalized calendars, and framed prints, continues to rise. Consumers are increasingly seeking personalized items as keepsakes, particularly around holidays like Christmas.

The strong growth of online photo printing platforms, including those offering premium-quality prints, is helping to cater to the demand. The market is also benefiting from the German preference for high-end, customized photo products, which are being sold via both domestic and international e-commerce platforms.
  • Strong demand for custom-made photo gifts, especially in the holiday season
  • Increasing popularity of photo books as personal keepsakes
  • Growth of online photo printing services

Leading Suppliers in the Photo Printing and Merchandise Market

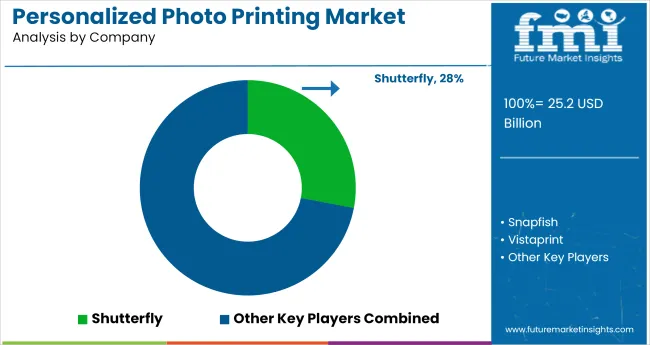
Personalized Photo Printing Market Analysis By Company

The market is driven by key players like Shutterfly, Snapfish, and Vistaprint, which dominate with extensive product portfolios, strong brand recognition, and customizable photo options. Shutterfly leads with its vast customization capabilities and high-quality offerings, while Snapfish and Vistaprint attract customers with affordable and diverse photo gifts and prints.

Mixbook has gained popularity in the premium photo book segment, offering high-quality personalized options. Mpix, Printique, and Blurb are targeting photography enthusiasts and professionals with specialized, high-end print services, known for their superior quality and customization. Zazzle and Redbubble have built success by offering photo printing on various merchandise beyond traditional items. Nations Photo Lab focuses on professional photo prints, appealing to photographers and studios.

With increasing competition, companies must improve e-commerce platforms, enhance customer experience, and expand product offerings to maintain their edge. Social media partnerships and digital solutions are key growth strategies.

Leading Companies in Photo Printing and Merchandise Market

  • Shutterfly
  • Snapfish
  • Vistaprint
  • Mixbook
  • Mpix
  • Printique
  • Blurb
  • Zazzle
  • Redbubble
  • Nations Photo Lab

Report Coverage and Scope Summary

Report Attributes Details
Industry Size (2025) USD 25.16 billion
Projected Industry Size (2035) USD 40.1 billion
CAGR (2025 to 2035) 5.1%
Base Year for Estimation 2024
Historical Period 2020 to 2024
Projections Period 2025 to 2035
Quantitative Units USD billion for value and million units for volume
Product Types Analyzed (Segment 1) Photo Prints, Photo Books, Calendars, Photo Cards & Invitations, Wall Décor, Mugs & Drinkware, T-shirts & Apparel, Others
Printing Technologies Analyzed (Segment 2) Digital Printing, Offset Printing, Dye Sublimation Printing, Inkjet Printing, Thermal Printing, Silver Halide Printing
End Users Analyzed (Segment 3) Individual Consumers, Businesses & Corporates, Photographers & Studios, Educational Institutions, Others
Regions Covered North America, Latin America, East Asia, South Asia & Pacific, Western Europe, Eastern Europe, Middle East & Africa
Countries Covered United States, Canada, Mexico, Brazil, Argentina, Germany, United Kingdom, France, Italy, Spain, China, Japan, India, South Korea, Australia, South Africa, Saudi Arabia, UAE
Key Players Shutterfly, Snapfish, Vistaprint, Mixbook, Mpix, Printique, Blurb, Zazzle, Redbubble, Nations Photo Lab
Additional Attributes Dollar sales, share by product type, printing technology adoption trends, rise of custom merchandise, impact of e-commerce platforms in market growth, seasonal demand fluctuations=

Key Segmentation

By Product Type:

The industry is segmented into photo prints, photo books, calendars, photo cards & invitations, wall décor, mugs & drinkware, t-shirts & apparel, and others.

By Printing Technology:

The industry is divided into digital printing, offset printing, dye sublimation printing, inkjet printing, thermal printing, and silver halide printing.

By End User:

The industry is segmented into individual consumers, businesses & corporates, photographers & studios, educational institutions, and others.

By Region:

The industry is categorized into North America, Latin America, East Asia, South Asia & Pacific, Western Europe, Eastern Europe, and Middle East and Africa.

Table of Content

  1. Executive Summary
    • Global Market Outlook
    • Demand-side Trends
    • Supply-side Trends
    • Technology Roadmap Analysis
    • Analysis and Recommendations
  2. Market Overview
    • Market Coverage / Taxonomy
    • Market Definition / Scope / Limitations
  3. Market Background
    • Market Dynamics
      • Drivers
      • Restraints
      • Opportunity
      • Trends
    • Scenario Forecast
      • Demand in Optimistic Scenario
      • Demand in Likely Scenario
      • Demand in Conservative Scenario
    • Opportunity Map Analysis
    • Product Life Cycle Analysis
    • Supply Chain Analysis
      • Supply Side Participants and their Roles
        • Producers
        • Mid-Level Participants (Traders/ Agents/ Brokers)
        • Wholesalers and Distributors
      • Value Added and Value Created at Node in the Supply Chain
      • List of Raw Material Suppliers
      • List of Existing and Potential Buyer’s
    • Investment Feasibility Matrix
    • Value Chain Analysis
      • Profit Margin Analysis
      • Wholesalers and Distributors
      • Retailers
    • PESTLE and Porter’s Analysis
    • Regulatory Landscape
      • By Key Regions
      • By Key Countries
    • Regional Parent Market Outlook
    • Production and Consumption Statistics
    • Import and Export Statistics
  4. Global Market Analysis 2020 to 2024 and Forecast, 2025 to 2035
    • Historical Market Size Value (USD Billion) & Volume (Million Units) Analysis, 2020 to 2024
    • Current and Future Market Size Value (USD Billion) & Volume (Million Units) Projections, 2025 to 2035
      • Y-o-Y Growth Trend Analysis
      • Absolute $ Opportunity Analysis
  5. Global Market Pricing Analysis 2020 to 2024 and Forecast 2025 to 2035
  6. Global Market Analysis 2020 to 2024 and Forecast 2025 to 2035, By Product Type
    • Introduction / Key Findings
    • Historical Market Size Value (USD Billion) & Volume (Million Units) Analysis By Product Type, 2020 to 2024
    • Current and Future Market Size Value (USD Billion) & Volume (Million Units) Analysis and Forecast By Product Type, 2025 to 2035
      • Photo Prints
      • Photo Books
      • Calendars
      • Photo Cards & Invitations
      • Wall Décor
      • Mugs & Drinkware
      • T-Shirts & Apparel
      • Others
    • Y-o-Y Growth Trend Analysis By Product Type, 2020 to 2024
    • Absolute $ Opportunity Analysis By Product Type, 2025 to 2035
  7. Global Market Analysis 2020 to 2024 and Forecast 2025 to 2035, By Printing Technology
    • Introduction / Key Findings
    • Historical Market Size Value (USD Billion) & Volume (Million Units) Analysis By Printing Technology, 2020 to 2024
    • Current and Future Market Size Value (USD Billion) & Volume (Million Units) Analysis and Forecast By Printing Technology, 2025 to 2035
      • Digital Printing
      • Offset Printing
      • Dye Sublimation Printing
      • Inkjet Printing
      • Thermal Printing
      • Silver Halide Printing
    • Y-o-Y Growth Trend Analysis By Printing Technology, 2020 to 2024
    • Absolute $ Opportunity Analysis By Printing Technology, 2025 to 2035
  8. Global Market Analysis 2020 to 2024 and Forecast 2025 to 2035, By End User
    • Introduction / Key Findings
    • Historical Market Size Value (USD Billion) & Volume (Million Units) Analysis By End User, 2020 to 2024
    • Current and Future Market Size Value (USD Billion) & Volume (Million Units) Analysis and Forecast By End User, 2025 to 2035
      • Individual Consumers
      • Businesses & Corporates
      • Photographers & Studios
      • Educational Institutions
      • Others
    • Y-o-Y Growth Trend Analysis By End User, 2020 to 2024
    • Absolute $ Opportunity Analysis By End User, 2025 to 2035
  9. Global Market Analysis 2020 to 2024 and Forecast 2025 to 2035, By Region
    • Introduction
    • Historical Market Size Value (USD Billion) & Volume (Million Units) Analysis By Region, 2020 to 2024
    • Current Market Size Value (USD Billion) & Volume (Million Units) Analysis and Forecast By Region, 2025 to 2035
      • North America
      • Latin America
      • Western Europe
      • Eastern Europe
      • East Asia
      • South Asia & Pacific
      • Middle East and Africa
    • Market Attractiveness Analysis By Region
  10. North America Market Analysis 2020 to 2024 and Forecast 2025 to 2035, By Country
    • Historical Market Size Value (USD Billion) & Volume (Million Units) Trend Analysis By Market Taxonomy, 2020 to 2024
    • Market Size Value (USD Billion) & Volume (Million Units) Forecast By Market Taxonomy, 2025 to 2035
      • By Country
        • USA
        • Canada
        • Mexico
      • By Product Type
      • By Printing Technology
      • By End User
    • Market Attractiveness Analysis
      • By Country
      • By Product Type
      • By Printing Technology
      • By End User
    • Key Takeaways
  11. Latin America Market Analysis 2020 to 2024 and Forecast 2025 to 2035, By Country
    • Historical Market Size Value (USD Billion) & Volume (Million Units) Trend Analysis By Market Taxonomy, 2020 to 2024
    • Market Size Value (USD Billion) & Volume (Million Units) Forecast By Market Taxonomy, 2025 to 2035
      • By Country
        • Brazil
        • Argentina
        • Rest of LATAM
      • By Product Type
      • By Printing Technology
      • By End User
    • Market Attractiveness Analysis
      • By Country
      • By Product Type
      • By Printing Technology
      • By End User
    • Key Takeaways
  12. Western Europe Market Analysis 2020 to 2024 and Forecast 2025 to 2035, By Country
    • Historical Market Size Value (USD Billion) & Volume (Million Units) Trend Analysis By Market Taxonomy, 2020 to 2024
    • Market Size Value (USD Billion) & Volume (Million Units) Forecast By Market Taxonomy, 2025 to 2035
      • By Country
        • Germany
        • Italy
        • France
        • UK
        • Spain
        • BENELUX
        • Nordic
        • Rest of W.Europe
      • By Product Type
      • By Printing Technology
      • By End User
    • Market Attractiveness Analysis
      • By Country
      • By Product Type
      • By Printing Technology
      • By End User
    • Key Takeaways
  13. Eastern Europe Market Analysis 2020 to 2024 and Forecast 2025 to 2035, By Country
    • Historical Market Size Value (USD Billion) & Volume (Million Units) Trend Analysis By Market Taxonomy, 2020 to 2024
    • Market Size Value (USD Billion) & Volume (Million Units) Forecast By Market Taxonomy, 2025 to 2035
      • By Country
        • Russia
        • Hungary
        • Poland
        • Balkan & Baltics
        • Rest of E. Europe
      • By Product Type
      • By Printing Technology
      • By End User
    • Market Attractiveness Analysis
      • By Country
      • By Product Type
      • By Printing Technology
      • By End User
    • Key Takeaways
  14. East Asia Market Analysis 2020 to 2024 and Forecast 2025 to 2035, By Country
    • Historical Market Size Value (USD Billion) & Volume (Million Units) Trend Analysis By Market Taxonomy, 2020 to 2024
    • Market Size Value (USD Billion) & Volume (Million Units) Forecast By Market Taxonomy, 2025 to 2035
      • By Country
        • China
        • Japan
        • South Korea
      • By Product Type
      • By Printing Technology
      • By End User
    • Market Attractiveness Analysis
      • By Country
      • By Product Type
      • By Printing Technology
      • By End User
    • Key Takeaways
  15. South Asia & Pacific Market Analysis 2020 to 2024 and Forecast 2025 to 2035, By Country
    • Historical Market Size Value (USD Billion) & Volume (Million Units) Trend Analysis By Market Taxonomy, 2020 to 2024
    • Market Size Value (USD Billion) & Volume (Million Units) Forecast By Market Taxonomy, 2025 to 2035
      • By Country
        • India
        • Australia & New Zealand
        • ASEAN
        • Rest of SAP
      • By Product Type
      • By Printing Technology
      • By End User
    • Market Attractiveness Analysis
      • By Country
      • By Product Type
      • By Printing Technology
      • By End User
    • Key Takeaways
  16. Middle East and Africa Market Analysis 2020 to 2024 and Forecast 2025 to 2035, By Country
    • Historical Market Size Value (USD Billion) & Volume (Million Units) Trend Analysis By Market Taxonomy, 2020 to 2024
    • Market Size Value (USD Billion) & Volume (Million Units) Forecast By Market Taxonomy, 2025 to 2035
      • By Country
        • GCC Countries
        • Northern Africa
        • South Africa
        • Turkiye
        • Rest of MEA
      • By Product Type
      • By Printing Technology
      • By End User
    • Market Attractiveness Analysis
      • By Country
      • By Product Type
      • By Printing Technology
      • By End User
    • Key Takeaways
  17. Key Countries Market Analysis
    • USA
      • Pricing Analysis
      • Market Share Analysis, 2024
        • By Product Type
        • By Printing Technology
        • By End User
    • Canada
      • Pricing Analysis
      • Market Share Analysis, 2024
        • By Product Type
        • By Printing Technology
        • By End User
    • Brazil
      • Pricing Analysis
      • Market Share Analysis, 2024
        • By Product Type
        • By Printing Technology
        • By End User
    • Mexico
      • Pricing Analysis
      • Market Share Analysis, 2024
        • By Product Type
        • By Printing Technology
        • By End User
    • Argentina
      • Pricing Analysis
      • Market Share Analysis, 2024
        • By Product Type
        • By Printing Technology
        • By End User
  18. Market Structure Analysis
    • Competition Dashboard
    • Competition Benchmarking
    • Market Share Analysis of Top Players
      • By Regional
      • By Product Type
      • By Printing Technology
      • By End User
  19. Competition Analysis
    • Competition Deep Dive
      • Shutterfly
        • Overview
        • Product Portfolio
        • Profitability by Market Segments (Product/Age /Sales Channel/Region)
        • Sales Footprint
        • Strategy Overview
          • Marketing Strategy
          • Product Strategy
          • Channel Strategy
      • Snapfish
        • Overview
        • Product Portfolio
        • Profitability by Market Segments (Product/Age /Sales Channel/Region)
        • Sales Footprint
        • Strategy Overview
          • Marketing Strategy
          • Product Strategy
          • Channel Strategy
      • Vistaprint
        • Overview
        • Product Portfolio
        • Profitability by Market Segments (Product/Age /Sales Channel/Region)
        • Sales Footprint
        • Strategy Overview
          • Marketing Strategy
          • Product Strategy
          • Channel Strategy
      • Mixbook
        • Overview
        • Product Portfolio
        • Profitability by Market Segments (Product/Age /Sales Channel/Region)
        • Sales Footprint
        • Strategy Overview
          • Marketing Strategy
          • Product Strategy
          • Channel Strategy
      • Mpix
        • Overview
        • Product Portfolio
        • Profitability by Market Segments (Product/Age /Sales Channel/Region)
        • Sales Footprint
        • Strategy Overview
          • Marketing Strategy
          • Product Strategy
          • Channel Strategy
      • Printique
        • Overview
        • Product Portfolio
        • Profitability by Market Segments (Product/Age /Sales Channel/Region)
        • Sales Footprint
        • Strategy Overview
          • Marketing Strategy
          • Product Strategy
          • Channel Strategy
      • Blurb
        • Overview
        • Product Portfolio
        • Profitability by Market Segments (Product/Age /Sales Channel/Region)
        • Sales Footprint
        • Strategy Overview
          • Marketing Strategy
          • Product Strategy
          • Channel Strategy
      • Zazzle
        • Overview
        • Product Portfolio
        • Profitability by Market Segments (Product/Age /Sales Channel/Region)
        • Sales Footprint
        • Strategy Overview
          • Marketing Strategy
          • Product Strategy
          • Channel Strategy
      • Redbubble
        • Overview
        • Product Portfolio
        • Profitability by Market Segments (Product/Age /Sales Channel/Region)
        • Sales Footprint
        • Strategy Overview
          • Marketing Strategy
          • Product Strategy
          • Channel Strategy
      • Nations Photo Lab
        • Overview
        • Product Portfolio
        • Profitability by Market Segments (Product/Age /Sales Channel/Region)
        • Sales Footprint
        • Strategy Overview
          • Marketing Strategy
          • Product Strategy
          • Channel Strategy
  20. Assumptions & Acronyms Used
  21. Research Methodology

List of Tables

  • Table 1: Global Market Value (USD Billion) Forecast by Region, 2020-2035
  • Table 2: Global Market Volume (Million Units) Forecast by Region, 2020-2035
  • Table 3: Global Market Value (USD Billion) Forecast by Product Type, 2020-2035
  • Table 4: Global Market Volume (Million Units) Forecast by Product Type, 2020-2035
  • Table 5: Global Market Value (USD Billion) Forecast by Printing Technology, 2020-2035
  • Table 6: Global Market Volume (Million Units) Forecast by Printing Technology, 2020-2035
  • Table 7: Global Market Value (USD Billion) Forecast by End User, 2020-2035
  • Table 8: Global Market Volume (Million Units) Forecast by End User, 2020-2035
  • Table 9: North America Market Value (USD Billion) Forecast by Country, 2020-2035
  • Table 10: North America Market Volume (Million Units) Forecast by Country, 2020-2035
  • Table 11: North America Market Value (USD Billion) Forecast by Product Type, 2020-2035
  • Table 12: North America Market Volume (Million Units) Forecast by Product Type, 2020-2035
  • Table 13: North America Market Value (USD Billion) Forecast by Printing Technology, 2020-2035
  • Table 14: North America Market Volume (Million Units) Forecast by Printing Technology, 2020-2035
  • Table 15: North America Market Value (USD Billion) Forecast by End User, 2020-2035
  • Table 16: North America Market Volume (Million Units) Forecast by End User, 2020-2035
  • Table 17: Latin America Market Value (USD Billion) Forecast by Country, 2020-2035
  • Table 18: Latin America Market Volume (Million Units) Forecast by Country, 2020-2035
  • Table 19: Latin America Market Value (USD Billion) Forecast by Product Type, 2020-2035
  • Table 20: Latin America Market Volume (Million Units) Forecast by Product Type, 2020-2035
  • Table 21: Latin America Market Value (USD Billion) Forecast by Printing Technology, 2020-2035
  • Table 22: Latin America Market Volume (Million Units) Forecast by Printing Technology, 2020-2035
  • Table 23: Latin America Market Value (USD Billion) Forecast by End User, 2020-2035
  • Table 24: Latin America Market Volume (Million Units) Forecast by End User, 2020-2035
  • Table 25: Western Europe Market Value (USD Billion) Forecast by Country, 2020-2035
  • Table 26: Western Europe Market Volume (Million Units) Forecast by Country, 2020-2035
  • Table 27: Western Europe Market Value (USD Billion) Forecast by Product Type, 2020-2035
  • Table 28: Western Europe Market Volume (Million Units) Forecast by Product Type, 2020-2035
  • Table 29: Western Europe Market Value (USD Billion) Forecast by Printing Technology, 2020-2035
  • Table 30: Western Europe Market Volume (Million Units) Forecast by Printing Technology, 2020-2035
  • Table 31: Western Europe Market Value (USD Billion) Forecast by End User, 2020-2035
  • Table 32: Western Europe Market Volume (Million Units) Forecast by End User, 2020-2035
  • Table 33: Eastern Europe Market Value (USD Billion) Forecast by Country, 2020-2035
  • Table 34: Eastern Europe Market Volume (Million Units) Forecast by Country, 2020-2035
  • Table 35: Eastern Europe Market Value (USD Billion) Forecast by Product Type, 2020-2035
  • Table 36: Eastern Europe Market Volume (Million Units) Forecast by Product Type, 2020-2035
  • Table 37: Eastern Europe Market Value (USD Billion) Forecast by Printing Technology, 2020-2035
  • Table 38: Eastern Europe Market Volume (Million Units) Forecast by Printing Technology, 2020-2035
  • Table 39: Eastern Europe Market Value (USD Billion) Forecast by End User, 2020-2035
  • Table 40: Eastern Europe Market Volume (Million Units) Forecast by End User, 2020-2035
  • Table 41: East Asia Market Value (USD Billion) Forecast by Country, 2020-2035
  • Table 42: East Asia Market Volume (Million Units) Forecast by Country, 2020-2035
  • Table 43: East Asia Market Value (USD Billion) Forecast by Product Type, 2020-2035
  • Table 44: East Asia Market Volume (Million Units) Forecast by Product Type, 2020-2035
  • Table 45: East Asia Market Value (USD Billion) Forecast by Printing Technology, 2020-2035
  • Table 46: East Asia Market Volume (Million Units) Forecast by Printing Technology, 2020-2035
  • Table 47: East Asia Market Value (USD Billion) Forecast by End User, 2020-2035
  • Table 48: East Asia Market Volume (Million Units) Forecast by End User, 2020-2035
  • Table 49: South Asia & Pacific Market Value (USD Billion) Forecast by Country, 2020-2035
  • Table 50: South Asia & Pacific Market Volume (Million Units) Forecast by Country, 2020-2035
  • Table 51: South Asia & Pacific Market Value (USD Billion) Forecast by Product Type, 2020-2035
  • Table 52: South Asia & Pacific Market Volume (Million Units) Forecast by Product Type, 2020-2035
  • Table 53: South Asia & Pacific Market Value (USD Billion) Forecast by Printing Technology, 2020-2035
  • Table 54: South Asia & Pacific Market Volume (Million Units) Forecast by Printing Technology, 2020-2035
  • Table 55: South Asia & Pacific Market Value (USD Billion) Forecast by End User, 2020-2035
  • Table 56: South Asia & Pacific Market Volume (Million Units) Forecast by End User, 2020-2035
  • Table 57: Middle East and Africa Market Value (USD Billion) Forecast by Country, 2020-2035
  • Table 58: Middle East and Africa Market Volume (Million Units) Forecast by Country, 2020-2035
  • Table 59: Middle East and Africa Market Value (USD Billion) Forecast by Product Type, 2020-2035
  • Table 60: Middle East and Africa Market Volume (Million Units) Forecast by Product Type, 2020-2035
  • Table 61: Middle East and Africa Market Value (USD Billion) Forecast by Printing Technology, 2020-2035
  • Table 62: Middle East and Africa Market Volume (Million Units) Forecast by Printing Technology, 2020-2035
  • Table 63: Middle East and Africa Market Value (USD Billion) Forecast by End User, 2020-2035
  • Table 64: Middle East and Africa Market Volume (Million Units) Forecast by End User, 2020-2035

List of Figures

  • Figure 1: Global Market Volume (Million Units) Forecast 2020-2035
  • Figure 2: Global Market Pricing Analysis
  • Figure 3: Global Market Value (USD Billion) Forecast 2020-2035
  • Figure 4: Global Market Value Share and BPS Analysis by Product Type, 2025 and 2035
  • Figure 5: Global Market Y-o-Y Growth Comparison by Product Type, 2025-2035
  • Figure 6: Global Market Attractiveness Analysis by Product Type
  • Figure 7: Global Market Value Share and BPS Analysis by Printing Technology, 2025 and 2035
  • Figure 8: Global Market Y-o-Y Growth Comparison by Printing Technology, 2025-2035
  • Figure 9: Global Market Attractiveness Analysis by Printing Technology
  • Figure 10: Global Market Value Share and BPS Analysis by End User, 2025 and 2035
  • Figure 11: Global Market Y-o-Y Growth Comparison by End User, 2025-2035
  • Figure 12: Global Market Attractiveness Analysis by End User
  • Figure 13: Global Market Value (USD Billion) Share and BPS Analysis by Region, 2025 and 2035
  • Figure 14: Global Market Y-o-Y Growth Comparison by Region, 2025-2035
  • Figure 15: Global Market Attractiveness Analysis by Region
  • Figure 16: North America Market Incremental $ Opportunity, 2025-2035
  • Figure 17: Latin America Market Incremental $ Opportunity, 2025-2035
  • Figure 18: Western Europe Market Incremental $ Opportunity, 2025-2035
  • Figure 19: Eastern Europe Market Incremental $ Opportunity, 2025-2035
  • Figure 20: East Asia Market Incremental $ Opportunity, 2025-2035
  • Figure 21: South Asia & Pacific Market Incremental $ Opportunity, 2025-2035
  • Figure 22: Middle East and Africa Market Incremental $ Opportunity, 2025-2035
  • Figure 23: North America Market Value Share and BPS Analysis by Country, 2025 and 2035
  • Figure 24: North America Market Value Share and BPS Analysis by Product Type, 2025 and 2035
  • Figure 25: North America Market Y-o-Y Growth Comparison by Product Type, 2025-2035
  • Figure 26: North America Market Attractiveness Analysis by Product Type
  • Figure 27: North America Market Value Share and BPS Analysis by Printing Technology, 2025 and 2035
  • Figure 28: North America Market Y-o-Y Growth Comparison by Printing Technology, 2025-2035
  • Figure 29: North America Market Attractiveness Analysis by Printing Technology
  • Figure 30: North America Market Value Share and BPS Analysis by End User, 2025 and 2035
  • Figure 31: North America Market Y-o-Y Growth Comparison by End User, 2025-2035
  • Figure 32: North America Market Attractiveness Analysis by End User
  • Figure 33: Latin America Market Value Share and BPS Analysis by Country, 2025 and 2035
  • Figure 34: Latin America Market Value Share and BPS Analysis by Product Type, 2025 and 2035
  • Figure 35: Latin America Market Y-o-Y Growth Comparison by Product Type, 2025-2035
  • Figure 36: Latin America Market Attractiveness Analysis by Product Type
  • Figure 37: Latin America Market Value Share and BPS Analysis by Printing Technology, 2025 and 2035
  • Figure 38: Latin America Market Y-o-Y Growth Comparison by Printing Technology, 2025-2035
  • Figure 39: Latin America Market Attractiveness Analysis by Printing Technology
  • Figure 40: Latin America Market Value Share and BPS Analysis by End User, 2025 and 2035
  • Figure 41: Latin America Market Y-o-Y Growth Comparison by End User, 2025-2035
  • Figure 42: Latin America Market Attractiveness Analysis by End User
  • Figure 43: Western Europe Market Value Share and BPS Analysis by Country, 2025 and 2035
  • Figure 44: Western Europe Market Value Share and BPS Analysis by Product Type, 2025 and 2035
  • Figure 45: Western Europe Market Y-o-Y Growth Comparison by Product Type, 2025-2035
  • Figure 46: Western Europe Market Attractiveness Analysis by Product Type
  • Figure 47: Western Europe Market Value Share and BPS Analysis by Printing Technology, 2025 and 2035
  • Figure 48: Western Europe Market Y-o-Y Growth Comparison by Printing Technology, 2025-2035
  • Figure 49: Western Europe Market Attractiveness Analysis by Printing Technology
  • Figure 50: Western Europe Market Value Share and BPS Analysis by End User, 2025 and 2035
  • Figure 51: Western Europe Market Y-o-Y Growth Comparison by End User, 2025-2035
  • Figure 52: Western Europe Market Attractiveness Analysis by End User
  • Figure 53: Eastern Europe Market Value Share and BPS Analysis by Country, 2025 and 2035
  • Figure 54: Eastern Europe Market Value Share and BPS Analysis by Product Type, 2025 and 2035
  • Figure 55: Eastern Europe Market Y-o-Y Growth Comparison by Product Type, 2025-2035
  • Figure 56: Eastern Europe Market Attractiveness Analysis by Product Type
  • Figure 57: Eastern Europe Market Value Share and BPS Analysis by Printing Technology, 2025 and 2035
  • Figure 58: Eastern Europe Market Y-o-Y Growth Comparison by Printing Technology, 2025-2035
  • Figure 59: Eastern Europe Market Attractiveness Analysis by Printing Technology
  • Figure 60: Eastern Europe Market Value Share and BPS Analysis by End User, 2025 and 2035
  • Figure 61: Eastern Europe Market Y-o-Y Growth Comparison by End User, 2025-2035
  • Figure 62: Eastern Europe Market Attractiveness Analysis by End User
  • Figure 63: East Asia Market Value Share and BPS Analysis by Country, 2025 and 2035
  • Figure 64: East Asia Market Value Share and BPS Analysis by Product Type, 2025 and 2035
  • Figure 65: East Asia Market Y-o-Y Growth Comparison by Product Type, 2025-2035
  • Figure 66: East Asia Market Attractiveness Analysis by Product Type
  • Figure 67: East Asia Market Value Share and BPS Analysis by Printing Technology, 2025 and 2035
  • Figure 68: East Asia Market Y-o-Y Growth Comparison by Printing Technology, 2025-2035
  • Figure 69: East Asia Market Attractiveness Analysis by Printing Technology
  • Figure 70: East Asia Market Value Share and BPS Analysis by End User, 2025 and 2035
  • Figure 71: East Asia Market Y-o-Y Growth Comparison by End User, 2025-2035
  • Figure 72: East Asia Market Attractiveness Analysis by End User
  • Figure 73: South Asia & Pacific Market Value Share and BPS Analysis by Country, 2025 and 2035
  • Figure 74: South Asia & Pacific Market Value Share and BPS Analysis by Product Type, 2025 and 2035
  • Figure 75: South Asia & Pacific Market Y-o-Y Growth Comparison by Product Type, 2025-2035
  • Figure 76: South Asia & Pacific Market Attractiveness Analysis by Product Type
  • Figure 77: South Asia & Pacific Market Value Share and BPS Analysis by Printing Technology, 2025 and 2035
  • Figure 78: South Asia & Pacific Market Y-o-Y Growth Comparison by Printing Technology, 2025-2035
  • Figure 79: South Asia & Pacific Market Attractiveness Analysis by Printing Technology
  • Figure 80: South Asia & Pacific Market Value Share and BPS Analysis by End User, 2025 and 2035
  • Figure 81: South Asia & Pacific Market Y-o-Y Growth Comparison by End User, 2025-2035
  • Figure 82: South Asia & Pacific Market Attractiveness Analysis by End User
  • Figure 83: Middle East and Africa Market Value Share and BPS Analysis by Country, 2025 and 2035
  • Figure 84: Middle East and Africa Market Value Share and BPS Analysis by Product Type, 2025 and 2035
  • Figure 85: Middle East and Africa Market Y-o-Y Growth Comparison by Product Type, 2025-2035
  • Figure 86: Middle East and Africa Market Attractiveness Analysis by Product Type
  • Figure 87: Middle East and Africa Market Value Share and BPS Analysis by Printing Technology, 2025 and 2035
  • Figure 88: Middle East and Africa Market Y-o-Y Growth Comparison by Printing Technology, 2025-2035
  • Figure 89: Middle East and Africa Market Attractiveness Analysis by Printing Technology
  • Figure 90: Middle East and Africa Market Value Share and BPS Analysis by End User, 2025 and 2035
  • Figure 91: Middle East and Africa Market Y-o-Y Growth Comparison by End User, 2025-2035
  • Figure 92: Middle East and Africa Market Attractiveness Analysis by End User
  • Figure 93: Global Market - Tier Structure Analysis
  • Figure 94: Global Market - Company Share Analysis

Frequently Asked Questions

What is the projected industry value of the photo printing and merchandise market in 2025?

The industry is projected to reach USD 25.16 billion in 2025.

What is the expected global CAGR for the photo printing and merchandise market from 2025 to 2035?

The industry is expected to grow at a CAGR of 5.1% from 2025 to 2035.

Which segment is expected to dominate the photo printing and merchandise market in 2025?

The photo prints segment is expected to capture 27.3% of the market in 2025.

Which region is forecasted to show significant growth in the photo printing and merchandise market by 2025?

The South Asia region, particularly India, is projected to register a CAGR of 8% from 2025 to 2035.

What is the forecasted industry value of the photo printing and merchandise market by 2035?

The industry is projected to reach USD 40.1 billion by 2035.

Explore Similar Insights

Future Market Insights

Photo Printing and Merchandise Market