Reports
- Global Locations -
Headquarters
Future Market Insights, Inc.
Christiana Corporate, 200
Continental Drive, Suite 401,
Newark, Delaware - 19713,
United States
Americas
Future Market Insights, Inc.
616 Corporate Way, Suite 2-9018,
Valley Cottage, NY 10989, United States
MEA
Future Market Insights
1602-6 Jumeirah Bay X2 Tower, Plot No: JLT-PH2-X2A,
Jumeirah Lakes Towers, Dubai,
United Arab Emirates
Europe
Future Market Insights
3rd Floor, 207 Regent Street,
W1B 3HH London
United Kingdom
Asia Pacific
Future Market Insights
Office No. 401-A, 4th Floor,
VANTAGE 9, S.No. 36/1/1,
Baner, Pune 411045, India
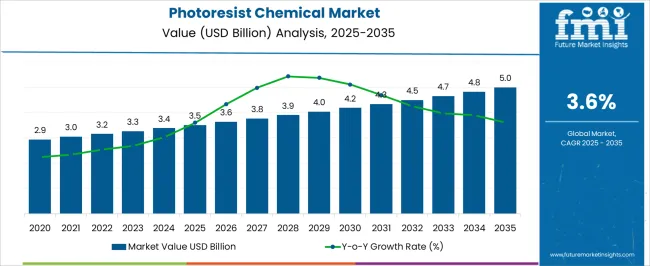
The global photoresist chemicals market is expected to be valued at US$ 3,185.6 Million in 2022. Photoresist chemicals are used in the fabrication of µm- and sub-µm structures, prominently in the microelectronics industry. These are specialty chemicals that change their chemical structure when exposed to ultraviolet (UV) light, this unique property makes them ideal for photolithography and photoengraving processes which in turn are commonly used in the semiconductor manufacturing industry.
Henceforth, photoresist chemicals are considered an essential component for making high-performance circuit boards and semiconductor chips. Various chemicals are used for this purpose, to achieve the desired properties, such as poly methyl methacrylate (PMMA), poly methyl glutarimide (PMGI), phenol formaldehyde resin (DNQ), SU-8, and OSTE polymers. The overall demand for photoresist chemicals is projected to grow at a CAGR of 3.6% between 2022 and 2032, totaling around US$ 4,537.2 Million by 2032.
Data Points | Key Statistics |
---|---|
Photoresist Chemicals Market Value 2022 | US$ 3185.6 Million |
Photoresist Chemicals Market Projected Value (2032) | US$ 4537.2 Million |
Photoresist Chemicals Market CAGR (2022 to 2032) | 3.6% |
Don't pay for what you don't need
Customize your report by selecting specific countries or regions and save 30%!
From 2016 to 2021, sales witnessed significant growth, registering a CAGR of 2.7%. Growing demand for semiconductors in the electronics & electrical industry is expected to be beneficial for the overall market development. The rising demand for dynamic display technology is presumed to give the market growth some direction. Photoresist chemicals by type include wet chemicals, silicon wafers, low-k dielectric, PCB laminates, CMP slurries, specialty gasses, and photoresists.
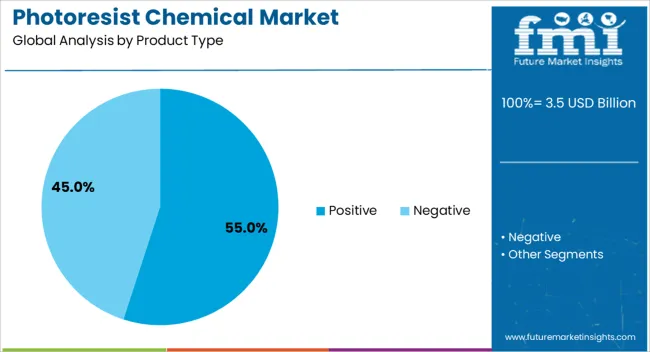
Further, there are two basic classifications of photoresists, positive and negative, both work on different principles, but cater to similar needs. However, with increasingly smaller geometry designs in the microelectronics industry, positives are becoming more popular, as they offer process controllability. With inevitable features offered by Photoresist chemicals and the absence of any other feasible alternatives, the market for photoresist chemicals is ever-growing. The overall demand for photoresist chemicals is projected to grow at a CAGR of 3.6% between 2022 and 2032, totaling around US$ 4,537.2 Million by 2032.
Extensive Research and Development in the Photoresist Chemicals to Help Strengthen Market
The global photoresist chemicals market is projected to grow at a moderate growth rate as the demand for micro-electronics continues to steadily grow, amid rising demand for electronic products in developing nations, and increasing penetrations of IoT across the globe.
Furthermore, rising demand for dynamic display technology is expected to be another prominent factor fuelling growth in the photoresist chemicals market. Excessive Research and Development in the photoresist chemicals and its end-use industry is expected to drive innovations, further shaping newer demand arenas, and fuelling more revenues in the global photoresist chemicals market.
Rising Environmental Concerns may restrict the Scope of Photoresist Chemicals
Photoresist chemicals are prominently made from crude oil; thus rising prices of crude oil are expected to increase costs, coupled with continued pricing pressure from end-use industries, which shall affect margins in the market. Furthermore rising environmental concerns regarding the derogatory effects of these chemicals are also expected to affect the market in the long term.
Rising Market Competition to Boost the Market Growth in North America
The North America photoresist chemicals market is expected to accumulate a market share of 17.4% in 2022. Electronics & electrical industry development in the USA played a major role in boosting the regional market demand.
Rising Research and Development to Boost Market Growth in Europe
The European region is anticipated to hold a market share of 14.6%. Extensive research and studies have taken place in the European market. Germany is slated to dominate the regional market owing to strong demand from the major end-use applications market.
Get the data you need at a Fraction of the cost
Personalize your report by choosing insights you need
and save 40%!
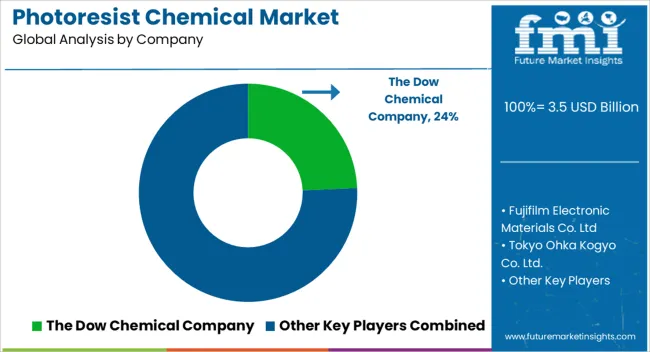
Prominent players in the Photoresist Chemicals market are JSR Corporation, LG Chem Ltd., The Dow Chemical Company, and Sumitomo Chemical Co. Ltd. Other important players include Fujifilm Electronic Materials Co. Ltd., Tokyo Ohka Kogyo Co. Ltd., Shin Etsu Chemical Co. Ltd., Avantor Performance Materials Inc., E.I. DuPont de Nemours and Company, Merck KGaA, Mitsui Chemicals America Inc., and other regional players.
Report Attribute | Details |
---|---|
Growth Rate | CAGR of 3.6% from 2022 to 2032 |
Market Value in 2022 | US$ 3,185.6 Million |
Market Value in 2032 | US$ 4,537.2 Million |
Base Year for Estimation | 2021 |
Historical Data | 2016 to 2021 |
Forecast Period | 2022 to 2032 |
Quantitative Units | Revenue in US$ Million and CAGR from 2022 to 2032 |
Report Coverage | Revenue Forecast, Company Ranking, Competitive Landscape, Growth Factors, Trends, and Pricing Analysis |
Segments Covered |
|
Regions Covered |
|
Key Countries Profiled |
|
Key Companies Profiled |
|
Customization & Pricing | Available upon Request |
1. Executive Summary | Photoresist Chemicals Market 1.1. Global Market Outlook 1.2. Demand-side Trends 1.3. Supply-side Trends 1.4. Technology Roadmap Analysis 1.5. Analysis and Recommendations 2. Market Overview 2.1. Market Coverage / Taxonomy 2.2. Market Definition / Scope / Limitations 3. Market Background 3.1. Market Dynamics 3.1.1. Drivers 3.1.2. Restraints 3.1.3. Opportunity 3.1.4. Trends 3.2. Scenario Forecast 3.2.1. Demand in Optimistic Scenario 3.2.2. Demand in Likely Scenario 3.2.3. Demand in Conservative Scenario 3.3. Opportunity Map Analysis 3.4. Product Life Cycle Analysis 3.5. Supply Chain Analysis 3.5.1. Supply Side Participants and their Roles 3.5.1.1. Producers 3.5.1.2. Mid-Level Participants (Traders/ Agents/ Brokers) 3.5.1.3. Wholesalers and Distributors 3.5.2. Value Added and Value Created at Node in the Supply Chain 3.5.3. List of Raw Material Suppliers 3.5.4. List of Existing and Potential Buyers 3.6. Investment Feasibility Matrix 3.7. Value Chain Analysis 3.7.1. Profit Margin Analysis 3.7.2. Wholesalers and Distributors 3.7.3. Retailers 3.8. PESTLE and Porter’s Analysis 3.9. Regulatory Landscape 3.9.1. By Key Regions 3.9.2. By Key Countries 3.10. Regional Parent Market Outlook 3.11. Production and Consumption Statistics 3.12. Import and Export Statistics 4. Global Market Analysis 2016 to 2021 and Forecast, 2022 to 2032 4.1. Historical Market Size Value (US$ Million) & Volume (Litre) Analysis, 2016 to 2021 4.2. Current and Future Market Size Value (US$ Million) & Volume (Litre) Projections, 2022 to 2032 4.2.1. Y-o-Y Growth Trend Analysis 4.2.2. Absolute $ Opportunity Analysis 5. Global Market Analysis 2016 to 2021 and Forecast 2022 to 2032, By Product Type 5.1. Introduction / Key Findings 5.2. Historical Market Size Value (US$ Million) & Volume (Litre) Analysis By Product Type, 2016 to 2021 5.3. Current and Future Market Size Value (US$ Million) & Volume (Litre) Analysis and Forecast By Product Type, 2022 to 2032 5.3.1. Positive 5.3.2. Negative 5.4. Y-o-Y Growth Trend Analysis By Product Type, 2016 to 2021 5.5. Absolute $ Opportunity Analysis By Product Type, 2022 to 2032 6. Global Market Analysis 2016 to 2021 and Forecast 2022 to 2032, By Spectral Line Size 6.1. Introduction / Key Findings 6.2. Historical Market Size Value (US$ Million) & Volume (Litre) Analysis By Spectral Line Size, 2016 to 2021 6.3. Current and Future Market Size Value (US$ Million) & Volume (Litre) Analysis and Forecast By Spectral Line Size, 2022 to 2032 6.3.1. g-line 6.3.2. i-line 6.3.3. KrF 6.3.4. ArF Immersion 6.3.5. ArF Dry 6.4. Y-o-Y Growth Trend Analysis By Spectral Line Size, 2016 to 2021 6.5. Absolute $ Opportunity Analysis By Spectral Line Size, 2022 to 2032 7. Global Market Analysis 2016 to 2021 and Forecast 2022 to 2032, By End Use Application 7.1. Introduction / Key Findings 7.2. Historical Market Size Value (US$ Million) & Volume (Litre) Analysis By End Use Application, 2016 to 2021 7.3. Current and Future Market Size Value (US$ Million) & Volume (Litre) Analysis and Forecast By End Use Application, 2022 to 2032 7.3.1. Microelectronics 7.3.2. Sand carving 7.3.3. Fabrication of printed circuit boards 7.3.4. Others 7.4. Y-o-Y Growth Trend Analysis By End Use Application, 2016 to 2021 7.5. Absolute $ Opportunity Analysis By End Use Application, 2022 to 2032 8. Global Market Analysis 2016 to 2021 and Forecast 2022 to 2032, By Region 8.1. Introduction 8.2. Historical Market Size Value (US$ Million) & Volume (Litre) Analysis By Region, 2016 to 2021 8.3. Current Market Size Value (US$ Million) & Volume (Litre) Analysis and Forecast By Region, 2022 to 2032 8.3.1. North America 8.3.2. Latin America 8.3.3. Europe 8.3.4. Asia Pacific 8.3.5. Middle East and Africa(MEA) 8.4. Market Attractiveness Analysis By Region 9. North America Market Analysis 2016 to 2021 and Forecast 2022 to 2032, By Country 9.1. Historical Market Size Value (US$ Million) & Volume (Litre) Trend Analysis By Market Taxonomy, 2016 to 2021 9.2. Market Size Value (US$ Million) & Volume (Litre) Forecast By Market Taxonomy, 2022 to 2032 9.2.1. By Country 9.2.1.1. USA 9.2.1.2. Canada 9.2.2. By Product Type 9.2.3. By Spectral Line Size 9.2.4. By End Use Application 9.3. Market Attractiveness Analysis 9.3.1. By Country 9.3.2. By Product Type 9.3.3. By Spectral Line Size 9.3.4. By End Use Application 9.4. Key Takeaways 10. Latin America Market Analysis 2016 to 2021 and Forecast 2022 to 2032, By Country 10.1. Historical Market Size Value (US$ Million) & Volume (Litre) Trend Analysis By Market Taxonomy, 2016 to 2021 10.2. Market Size Value (US$ Million) & Volume (Litre) Forecast By Market Taxonomy, 2022 to 2032 10.2.1. By Country 10.2.1.1. Brazil 10.2.1.2. Mexico 10.2.1.3. Rest of Latin America 10.2.2. By Product Type 10.2.3. By Spectral Line Size 10.2.4. By End Use Application 10.3. Market Attractiveness Analysis 10.3.1. By Country 10.3.2. By Product Type 10.3.3. By Spectral Line Size 10.3.4. By End Use Application 10.4. Key Takeaways 11. Europe Market Analysis 2016 to 2021 and Forecast 2022 to 2032, By Country 11.1. Historical Market Size Value (US$ Million) & Volume (Litre) Trend Analysis By Market Taxonomy, 2016 to 2021 11.2. Market Size Value (US$ Million) & Volume (Litre) Forecast By Market Taxonomy, 2022 to 2032 11.2.1. By Country 11.2.1.1. Germany 11.2.1.2. United Kingdom 11.2.1.3. France 11.2.1.4. Spain 11.2.1.5. Italy 11.2.1.6. Rest of Europe 11.2.2. By Product Type 11.2.3. By Spectral Line Size 11.2.4. By End Use Application 11.3. Market Attractiveness Analysis 11.3.1. By Country 11.3.2. By Product Type 11.3.3. By Spectral Line Size 11.3.4. By End Use Application 11.4. Key Takeaways 12. Asia Pacific Market Analysis 2016 to 2021 and Forecast 2022 to 2032, By Country 12.1. Historical Market Size Value (US$ Million) & Volume (Litre) Trend Analysis By Market Taxonomy, 2016 to 2021 12.2. Market Size Value (US$ Million) & Volume (Litre) Forecast By Market Taxonomy, 2022 to 2032 12.2.1. By Country 12.2.1.1. China 12.2.1.2. Japan 12.2.1.3. South Korea 12.2.1.4. Singapore 12.2.1.5. Thailand 12.2.1.6. Indonesia 12.2.1.7. Australia 12.2.1.8. New Zealand 12.2.1.9. Rest of Asia Pacific 12.2.2. By Product Type 12.2.3. By Spectral Line Size 12.2.4. By End Use Application 12.3. Market Attractiveness Analysis 12.3.1. By Country 12.3.2. By Product Type 12.3.3. By Spectral Line Size 12.3.4. By End Use Application 12.4. Key Takeaways 13. MEA Market Analysis 2016 to 2021 and Forecast 2022 to 2032, By Country 13.1. Historical Market Size Value (US$ Million) & Volume (Litre) Trend Analysis By Market Taxonomy, 2016 to 2021 13.2. Market Size Value (US$ Million) & Volume (Litre) Forecast By Market Taxonomy, 2022 to 2032 13.2.1. By Country 13.2.1.1. GCC Countries 13.2.1.2. South Africa 13.2.1.3. Israel 13.2.1.4. Rest of Middle East and Africa(MEA) 13.2.2. By Product Type 13.2.3. By Spectral Line Size 13.2.4. By End Use Application 13.3. Market Attractiveness Analysis 13.3.1. By Country 13.3.2. By Product Type 13.3.3. By Spectral Line Size 13.3.4. By End Use Application 13.4. Key Takeaways 14. Key Countries Market Analysis 14.1. USA 14.1.1. Pricing Analysis 14.1.2. Market Share Analysis, 2021 14.1.2.1. By Product Type 14.1.2.2. By Spectral Line Size 14.1.2.3. By End Use Application 14.2. Canada 14.2.1. Pricing Analysis 14.2.2. Market Share Analysis, 2021 14.2.2.1. By Product Type 14.2.2.2. By Spectral Line Size 14.2.2.3. By End Use Application 14.3. Brazil 14.3.1. Pricing Analysis 14.3.2. Market Share Analysis, 2021 14.3.2.1. By Product Type 14.3.2.2. By Spectral Line Size 14.3.2.3. By End Use Application 14.4. Mexico 14.4.1. Pricing Analysis 14.4.2. Market Share Analysis, 2021 14.4.2.1. By Product Type 14.4.2.2. By Spectral Line Size 14.4.2.3. By End Use Application 14.5. Germany 14.5.1. Pricing Analysis 14.5.2. Market Share Analysis, 2021 14.5.2.1. By Product Type 14.5.2.2. By Spectral Line Size 14.5.2.3. By End Use Application 14.6. United Kingdom 14.6.1. Pricing Analysis 14.6.2. Market Share Analysis, 2021 14.6.2.1. By Product Type 14.6.2.2. By Spectral Line Size 14.6.2.3. By End Use Application 14.7. France 14.7.1. Pricing Analysis 14.7.2. Market Share Analysis, 2021 14.7.2.1. By Product Type 14.7.2.2. By Spectral Line Size 14.7.2.3. By End Use Application 14.8. Spain 14.8.1. Pricing Analysis 14.8.2. Market Share Analysis, 2021 14.8.2.1. By Product Type 14.8.2.2. By Spectral Line Size 14.8.2.3. By End Use Application 14.9. Italy 14.9.1. Pricing Analysis 14.9.2. Market Share Analysis, 2021 14.9.2.1. By Product Type 14.9.2.2. By Spectral Line Size 14.9.2.3. By End Use Application 14.10. China 14.10.1. Pricing Analysis 14.10.2. Market Share Analysis, 2021 14.10.2.1. By Product Type 14.10.2.2. By Spectral Line Size 14.10.2.3. By End Use Application 14.11. Japan 14.11.1. Pricing Analysis 14.11.2. Market Share Analysis, 2021 14.11.2.1. By Product Type 14.11.2.2. By Spectral Line Size 14.11.2.3. By End Use Application 14.12. South Korea 14.12.1. Pricing Analysis 14.12.2. Market Share Analysis, 2021 14.12.2.1. By Product Type 14.12.2.2. By Spectral Line Size 14.12.2.3. By End Use Application 14.13. Singapore 14.13.1. Pricing Analysis 14.13.2. Market Share Analysis, 2021 14.13.2.1. By Product Type 14.13.2.2. By Spectral Line Size 14.13.2.3. By End Use Application 14.14. Thailand 14.14.1. Pricing Analysis 14.14.2. Market Share Analysis, 2021 14.14.2.1. By Product Type 14.14.2.2. By Spectral Line Size 14.14.2.3. By End Use Application 14.15. Indonesia 14.15.1. Pricing Analysis 14.15.2. Market Share Analysis, 2021 14.15.2.1. By Product Type 14.15.2.2. By Spectral Line Size 14.15.2.3. By End Use Application 14.16. Australia 14.16.1. Pricing Analysis 14.16.2. Market Share Analysis, 2021 14.16.2.1. By Product Type 14.16.2.2. By Spectral Line Size 14.16.2.3. By End Use Application 14.17. New Zealand 14.17.1. Pricing Analysis 14.17.2. Market Share Analysis, 2021 14.17.2.1. By Product Type 14.17.2.2. By Spectral Line Size 14.17.2.3. By End Use Application 14.18. GCC Countries 14.18.1. Pricing Analysis 14.18.2. Market Share Analysis, 2021 14.18.2.1. By Product Type 14.18.2.2. By Spectral Line Size 14.18.2.3. By End Use Application 14.19. South Africa 14.19.1. Pricing Analysis 14.19.2. Market Share Analysis, 2021 14.19.2.1. By Product Type 14.19.2.2. By Spectral Line Size 14.19.2.3. By End Use Application 14.20. Israel 14.20.1. Pricing Analysis 14.20.2. Market Share Analysis, 2021 14.20.2.1. By Product Type 14.20.2.2. By Spectral Line Size 14.20.2.3. By End Use Application 15. Market Structure Analysis 15.1. Competition Dashboard 15.2. Competition Benchmarking 15.3. Market Share Analysis of Top Players 15.3.1. By Regional 15.3.2. By Product Type 15.3.3. By Spectral Line Size 15.3.4. By End Use Application 16. Competition Analysis 16.1. Competition Deep Dive 16.1.1. The Dow Chemical Company 16.1.1.1. Overview 16.1.1.2. Product Portfolio 16.1.1.3. Profitability by Market Segments 16.1.1.4. Sales Footprint 16.1.1.5. Strategy Overview 16.1.1.5.1. Marketing Strategy 16.1.1.5.2. Product Strategy 16.1.1.5.3. Channel Strategy 16.1.2. Fujifilm Electronic Materials Co. Ltd 16.1.2.1. Overview 16.1.2.2. Product Portfolio 16.1.2.3. Profitability by Market Segments 16.1.2.4. Sales Footprint 16.1.2.5. Strategy Overview 16.1.2.5.1. Marketing Strategy 16.1.2.5.2. Product Strategy 16.1.2.5.3. Channel Strategy 16.1.3. Tokyo Ohka Kogyo Co. Ltd. 16.1.3.1. Overview 16.1.3.2. Product Portfolio 16.1.3.3. Profitability by Market Segments 16.1.3.4. Sales Footprint 16.1.3.5. Strategy Overview 16.1.3.5.1. Marketing Strategy 16.1.3.5.2. Product Strategy 16.1.3.5.3. Channel Strategy 16.1.4. E.I. DuPont de Nemours 16.1.4.1. Overview 16.1.4.2. Product Portfolio 16.1.4.3. Profitability by Market Segments 16.1.4.4. Sales Footprint 16.1.4.5. Strategy Overview 16.1.4.5.1. Marketing Strategy 16.1.4.5.2. Product Strategy 16.1.4.5.3. Channel Strategy 16.1.5. Mitsui Chemicals America Inc 16.1.5.1. Overview 16.1.5.2. Product Portfolio 16.1.5.3. Profitability by Market Segments 16.1.5.4. Sales Footprint 16.1.5.5. Strategy Overview 16.1.5.5.1. Marketing Strategy 16.1.5.5.2. Product Strategy 16.1.5.5.3. Channel Strategy 16.1.6. JSR Corporation 16.1.6.1. Overview 16.1.6.2. Product Portfolio 16.1.6.3. Profitability by Market Segments 16.1.6.4. Sales Footprint 16.1.6.5. Strategy Overview 16.1.6.5.1. Marketing Strategy 16.1.6.5.2. Product Strategy 16.1.6.5.3. Channel Strategy 16.1.7. LG Chem 16.1.7.1. Overview 16.1.7.2. Product Portfolio 16.1.7.3. Profitability by Market Segments 16.1.7.4. Sales Footprint 16.1.7.5. Strategy Overview 16.1.7.5.1. Marketing Strategy 16.1.7.5.2. Product Strategy 16.1.7.5.3. Channel Strategy 16.1.8. Shin-Etsu Chemical 16.1.8.1. Overview 16.1.8.2. Product Portfolio 16.1.8.3. Profitability by Market Segments 16.1.8.4. Sales Footprint 16.1.8.5. Strategy Overview 16.1.8.5.1. Marketing Strategy 16.1.8.5.2. Product Strategy 16.1.8.5.3. Channel Strategy 16.1.9. TOK America 16.1.9.1. Overview 16.1.9.2. Product Portfolio 16.1.9.3. Profitability by Market Segments 16.1.9.4. Sales Footprint 16.1.9.5. Strategy Overview 16.1.9.5.1. Marketing Strategy 16.1.9.5.2. Product Strategy 16.1.9.5.3. Channel Strategy 16.1.10. Honsou Chemical Industry 16.1.10.1. Overview 16.1.10.2. Product Portfolio 16.1.10.3. Profitability by Market Segments 16.1.10.4. Sales Footprint 16.1.10.5. Strategy Overview 16.1.10.5.1. Marketing Strategy 16.1.10.5.2. Product Strategy 16.1.10.5.3. Channel Strategy 17. Assumptions & Acronyms Used 18. Research Methodology
Don't pay for what you don't need
Customize your report by selecting specific countries or regions and save 30%!
Table 1: Global Market Value (US$ Million) Forecast by Region, 2016 to 2032 Table 2: Global Market Volume (Litre) Forecast by Region, 2016 to 2032 Table 3: Global Market Value (US$ Million) Forecast by Product Type, 2016 to 2032 Table 4: Global Market Volume (Litre) Forecast by Product Type, 2016 to 2032 Table 5: Global Market Value (US$ Million) Forecast by Spectral Line Size, 2016 to 2032 Table 6: Global Market Volume (Litre) Forecast by Spectral Line Size, 2016 to 2032 Table 7: Global Market Value (US$ Million) Forecast by End Use Application, 2016 to 2032 Table 8: Global Market Volume (Litre) Forecast by End Use Application, 2016 to 2032 Table 9: North America Market Value (US$ Million) Forecast by Country, 2016 to 2032 Table 10: North America Market Volume (Litre) Forecast by Country, 2016 to 2032 Table 11: North America Market Value (US$ Million) Forecast by Product Type, 2016 to 2032 Table 12: North America Market Volume (Litre) Forecast by Product Type, 2016 to 2032 Table 13: North America Market Value (US$ Million) Forecast by Spectral Line Size, 2016 to 2032 Table 14: North America Market Volume (Litre) Forecast by Spectral Line Size, 2016 to 2032 Table 15: North America Market Value (US$ Million) Forecast by End Use Application, 2016 to 2032 Table 16: North America Market Volume (Litre) Forecast by End Use Application, 2016 to 2032 Table 17: Latin America Market Value (US$ Million) Forecast by Country, 2016 to 2032 Table 18: Latin America Market Volume (Litre) Forecast by Country, 2016 to 2032 Table 19: Latin America Market Value (US$ Million) Forecast by Product Type, 2016 to 2032 Table 20: Latin America Market Volume (Litre) Forecast by Product Type, 2016 to 2032 Table 21: Latin America Market Value (US$ Million) Forecast by Spectral Line Size, 2016 to 2032 Table 22: Latin America Market Volume (Litre) Forecast by Spectral Line Size, 2016 to 2032 Table 23: Latin America Market Value (US$ Million) Forecast by End Use Application, 2016 to 2032 Table 24: Latin America Market Volume (Litre) Forecast by End Use Application, 2016 to 2032 Table 25: Europe Market Value (US$ Million) Forecast by Country, 2016 to 2032 Table 26: Europe Market Volume (Litre) Forecast by Country, 2016 to 2032 Table 27: Europe Market Value (US$ Million) Forecast by Product Type, 2016 to 2032 Table 28: Europe Market Volume (Litre) Forecast by Product Type, 2016 to 2032 Table 29: Europe Market Value (US$ Million) Forecast by Spectral Line Size, 2016 to 2032 Table 30: Europe Market Volume (Litre) Forecast by Spectral Line Size, 2016 to 2032 Table 31: Europe Market Value (US$ Million) Forecast by End Use Application, 2016 to 2032 Table 32: Europe Market Volume (Litre) Forecast by End Use Application, 2016 to 2032 Table 33: Asia Pacific Market Value (US$ Million) Forecast by Country, 2016 to 2032 Table 34: Asia Pacific Market Volume (Litre) Forecast by Country, 2016 to 2032 Table 35: Asia Pacific Market Value (US$ Million) Forecast by Product Type, 2016 to 2032 Table 36: Asia Pacific Market Volume (Litre) Forecast by Product Type, 2016 to 2032 Table 37: Asia Pacific Market Value (US$ Million) Forecast by Spectral Line Size, 2016 to 2032 Table 38: Asia Pacific Market Volume (Litre) Forecast by Spectral Line Size, 2016 to 2032 Table 39: Asia Pacific Market Value (US$ Million) Forecast by End Use Application, 2016 to 2032 Table 40: Asia Pacific Market Volume (Litre) Forecast by End Use Application, 2016 to 2032 Table 41: MEA Market Value (US$ Million) Forecast by Country, 2016 to 2032 Table 42: MEA Market Volume (Litre) Forecast by Country, 2016 to 2032 Table 43: MEA Market Value (US$ Million) Forecast by Product Type, 2016 to 2032 Table 44: MEA Market Volume (Litre) Forecast by Product Type, 2016 to 2032 Table 45: MEA Market Value (US$ Million) Forecast by Spectral Line Size, 2016 to 2032 Table 46: MEA Market Volume (Litre) Forecast by Spectral Line Size, 2016 to 2032 Table 47: MEA Market Value (US$ Million) Forecast by End Use Application, 2016 to 2032 Table 48: MEA Market Volume (Litre) Forecast by End Use Application, 2016 to 2032
Figure 1: Global Market Value (US$ Million) by Product Type, 2022 to 2032 Figure 2: Global Market Value (US$ Million) by Spectral Line Size, 2022 to 2032 Figure 3: Global Market Value (US$ Million) by End Use Application, 2022 to 2032 Figure 4: Global Market Value (US$ Million) by Region, 2022 to 2032 Figure 5: Global Market Value (US$ Million) Analysis by Region, 2016 to 2032 Figure 6: Global Market Volume (Litre) Analysis by Region, 2016 to 2032 Figure 7: Global Market Value Share (%) and BPS Analysis by Region, 2022 to 2032 Figure 8: Global Market Y-o-Y Growth (%) Projections by Region, 2022 to 2032 Figure 9: Global Market Value (US$ Million) Analysis by Product Type, 2016 to 2032 Figure 10: Global Market Volume (Litre) Analysis by Product Type, 2016 to 2032 Figure 11: Global Market Value Share (%) and BPS Analysis by Product Type, 2022 to 2032 Figure 12: Global Market Y-o-Y Growth (%) Projections by Product Type, 2022 to 2032 Figure 13: Global Market Value (US$ Million) Analysis by Spectral Line Size, 2016 to 2032 Figure 14: Global Market Volume (Litre) Analysis by Spectral Line Size, 2016 to 2032 Figure 15: Global Market Value Share (%) and BPS Analysis by Spectral Line Size, 2022 to 2032 Figure 16: Global Market Y-o-Y Growth (%) Projections by Spectral Line Size, 2022 to 2032 Figure 17: Global Market Value (US$ Million) Analysis by End Use Application, 2016 to 2032 Figure 18: Global Market Volume (Litre) Analysis by End Use Application, 2016 to 2032 Figure 19: Global Market Value Share (%) and BPS Analysis by End Use Application, 2022 to 2032 Figure 20: Global Market Y-o-Y Growth (%) Projections by End Use Application, 2022 to 2032 Figure 21: Global Market Attractiveness by Product Type, 2022 to 2032 Figure 22: Global Market Attractiveness by Spectral Line Size, 2022 to 2032 Figure 23: Global Market Attractiveness by End Use Application, 2022 to 2032 Figure 24: Global Market Attractiveness by Region, 2022 to 2032 Figure 25: North America Market Value (US$ Million) by Product Type, 2022 to 2032 Figure 26: North America Market Value (US$ Million) by Spectral Line Size, 2022 to 2032 Figure 27: North America Market Value (US$ Million) by End Use Application, 2022 to 2032 Figure 28: North America Market Value (US$ Million) by Country, 2022 to 2032 Figure 29: North America Market Value (US$ Million) Analysis by Country, 2016 to 2032 Figure 30: North America Market Volume (Litre) Analysis by Country, 2016 to 2032 Figure 31: North America Market Value Share (%) and BPS Analysis by Country, 2022 to 2032 Figure 32: North America Market Y-o-Y Growth (%) Projections by Country, 2022 to 2032 Figure 33: North America Market Value (US$ Million) Analysis by Product Type, 2016 to 2032 Figure 34: North America Market Volume (Litre) Analysis by Product Type, 2016 to 2032 Figure 35: North America Market Value Share (%) and BPS Analysis by Product Type, 2022 to 2032 Figure 36: North America Market Y-o-Y Growth (%) Projections by Product Type, 2022 to 2032 Figure 37: North America Market Value (US$ Million) Analysis by Spectral Line Size, 2016 to 2032 Figure 38: North America Market Volume (Litre) Analysis by Spectral Line Size, 2016 to 2032 Figure 39: North America Market Value Share (%) and BPS Analysis by Spectral Line Size, 2022 to 2032 Figure 40: North America Market Y-o-Y Growth (%) Projections by Spectral Line Size, 2022 to 2032 Figure 41: North America Market Value (US$ Million) Analysis by End Use Application, 2016 to 2032 Figure 42: North America Market Volume (Litre) Analysis by End Use Application, 2016 to 2032 Figure 43: North America Market Value Share (%) and BPS Analysis by End Use Application, 2022 to 2032 Figure 44: North America Market Y-o-Y Growth (%) Projections by End Use Application, 2022 to 2032 Figure 45: North America Market Attractiveness by Product Type, 2022 to 2032 Figure 46: North America Market Attractiveness by Spectral Line Size, 2022 to 2032 Figure 47: North America Market Attractiveness by End Use Application, 2022 to 2032 Figure 48: North America Market Attractiveness by Country, 2022 to 2032 Figure 49: Latin America Market Value (US$ Million) by Product Type, 2022 to 2032 Figure 50: Latin America Market Value (US$ Million) by Spectral Line Size, 2022 to 2032 Figure 51: Latin America Market Value (US$ Million) by End Use Application, 2022 to 2032 Figure 52: Latin America Market Value (US$ Million) by Country, 2022 to 2032 Figure 53: Latin America Market Value (US$ Million) Analysis by Country, 2016 to 2032 Figure 54: Latin America Market Volume (Litre) Analysis by Country, 2016 to 2032 Figure 55: Latin America Market Value Share (%) and BPS Analysis by Country, 2022 to 2032 Figure 56: Latin America Market Y-o-Y Growth (%) Projections by Country, 2022 to 2032 Figure 57: Latin America Market Value (US$ Million) Analysis by Product Type, 2016 to 2032 Figure 58: Latin America Market Volume (Litre) Analysis by Product Type, 2016 to 2032 Figure 59: Latin America Market Value Share (%) and BPS Analysis by Product Type, 2022 to 2032 Figure 60: Latin America Market Y-o-Y Growth (%) Projections by Product Type, 2022 to 2032 Figure 61: Latin America Market Value (US$ Million) Analysis by Spectral Line Size, 2016 to 2032 Figure 62: Latin America Market Volume (Litre) Analysis by Spectral Line Size, 2016 to 2032 Figure 63: Latin America Market Value Share (%) and BPS Analysis by Spectral Line Size, 2022 to 2032 Figure 64: Latin America Market Y-o-Y Growth (%) Projections by Spectral Line Size, 2022 to 2032 Figure 65: Latin America Market Value (US$ Million) Analysis by End Use Application, 2016 to 2032 Figure 66: Latin America Market Volume (Litre) Analysis by End Use Application, 2016 to 2032 Figure 67: Latin America Market Value Share (%) and BPS Analysis by End Use Application, 2022 to 2032 Figure 68: Latin America Market Y-o-Y Growth (%) Projections by End Use Application, 2022 to 2032 Figure 69: Latin America Market Attractiveness by Product Type, 2022 to 2032 Figure 70: Latin America Market Attractiveness by Spectral Line Size, 2022 to 2032 Figure 71: Latin America Market Attractiveness by End Use Application, 2022 to 2032 Figure 72: Latin America Market Attractiveness by Country, 2022 to 2032 Figure 73: Europe Market Value (US$ Million) by Product Type, 2022 to 2032 Figure 74: Europe Market Value (US$ Million) by Spectral Line Size, 2022 to 2032 Figure 75: Europe Market Value (US$ Million) by End Use Application, 2022 to 2032 Figure 76: Europe Market Value (US$ Million) by Country, 2022 to 2032 Figure 77: Europe Market Value (US$ Million) Analysis by Country, 2016 to 2032 Figure 78: Europe Market Volume (Litre) Analysis by Country, 2016 to 2032 Figure 79: Europe Market Value Share (%) and BPS Analysis by Country, 2022 to 2032 Figure 80: Europe Market Y-o-Y Growth (%) Projections by Country, 2022 to 2032 Figure 81: Europe Market Value (US$ Million) Analysis by Product Type, 2016 to 2032 Figure 82: Europe Market Volume (Litre) Analysis by Product Type, 2016 to 2032 Figure 83: Europe Market Value Share (%) and BPS Analysis by Product Type, 2022 to 2032 Figure 84: Europe Market Y-o-Y Growth (%) Projections by Product Type, 2022 to 2032 Figure 85: Europe Market Value (US$ Million) Analysis by Spectral Line Size, 2016 to 2032 Figure 86: Europe Market Volume (Litre) Analysis by Spectral Line Size, 2016 to 2032 Figure 87: Europe Market Value Share (%) and BPS Analysis by Spectral Line Size, 2022 to 2032 Figure 88: Europe Market Y-o-Y Growth (%) Projections by Spectral Line Size, 2022 to 2032 Figure 89: Europe Market Value (US$ Million) Analysis by End Use Application, 2016 to 2032 Figure 90: Europe Market Volume (Litre) Analysis by End Use Application, 2016 to 2032 Figure 91: Europe Market Value Share (%) and BPS Analysis by End Use Application, 2022 to 2032 Figure 92: Europe Market Y-o-Y Growth (%) Projections by End Use Application, 2022 to 2032 Figure 93: Europe Market Attractiveness by Product Type, 2022 to 2032 Figure 94: Europe Market Attractiveness by Spectral Line Size, 2022 to 2032 Figure 95: Europe Market Attractiveness by End Use Application, 2022 to 2032 Figure 96: Europe Market Attractiveness by Country, 2022 to 2032 Figure 97: Asia Pacific Market Value (US$ Million) by Product Type, 2022 to 2032 Figure 98: Asia Pacific Market Value (US$ Million) by Spectral Line Size, 2022 to 2032 Figure 99: Asia Pacific Market Value (US$ Million) by End Use Application, 2022 to 2032 Figure 100: Asia Pacific Market Value (US$ Million) by Country, 2022 to 2032 Figure 101: Asia Pacific Market Value (US$ Million) Analysis by Country, 2016 to 2032 Figure 102: Asia Pacific Market Volume (Litre) Analysis by Country, 2016 to 2032 Figure 103: Asia Pacific Market Value Share (%) and BPS Analysis by Country, 2022 to 2032 Figure 104: Asia Pacific Market Y-o-Y Growth (%) Projections by Country, 2022 to 2032 Figure 105: Asia Pacific Market Value (US$ Million) Analysis by Product Type, 2016 to 2032 Figure 106: Asia Pacific Market Volume (Litre) Analysis by Product Type, 2016 to 2032 Figure 107: Asia Pacific Market Value Share (%) and BPS Analysis by Product Type, 2022 to 2032 Figure 108: Asia Pacific Market Y-o-Y Growth (%) Projections by Product Type, 2022 to 2032 Figure 109: Asia Pacific Market Value (US$ Million) Analysis by Spectral Line Size, 2016 to 2032 Figure 110: Asia Pacific Market Volume (Litre) Analysis by Spectral Line Size, 2016 to 2032 Figure 111: Asia Pacific Market Value Share (%) and BPS Analysis by Spectral Line Size, 2022 to 2032 Figure 112: Asia Pacific Market Y-o-Y Growth (%) Projections by Spectral Line Size, 2022 to 2032 Figure 113: Asia Pacific Market Value (US$ Million) Analysis by End Use Application, 2016 to 2032 Figure 114: Asia Pacific Market Volume (Litre) Analysis by End Use Application, 2016 to 2032 Figure 115: Asia Pacific Market Value Share (%) and BPS Analysis by End Use Application, 2022 to 2032 Figure 116: Asia Pacific Market Y-o-Y Growth (%) Projections by End Use Application, 2022 to 2032 Figure 117: Asia Pacific Market Attractiveness by Product Type, 2022 to 2032 Figure 118: Asia Pacific Market Attractiveness by Spectral Line Size, 2022 to 2032 Figure 119: Asia Pacific Market Attractiveness by End Use Application, 2022 to 2032 Figure 120: Asia Pacific Market Attractiveness by Country, 2022 to 2032 Figure 121: MEA Market Value (US$ Million) by Product Type, 2022 to 2032 Figure 122: MEA Market Value (US$ Million) by Spectral Line Size, 2022 to 2032 Figure 123: MEA Market Value (US$ Million) by End Use Application, 2022 to 2032 Figure 124: MEA Market Value (US$ Million) by Country, 2022 to 2032 Figure 125: MEA Market Value (US$ Million) Analysis by Country, 2016 to 2032 Figure 126: MEA Market Volume (Litre) Analysis by Country, 2016 to 2032 Figure 127: MEA Market Value Share (%) and BPS Analysis by Country, 2022 to 2032 Figure 128: MEA Market Y-o-Y Growth (%) Projections by Country, 2022 to 2032 Figure 129: MEA Market Value (US$ Million) Analysis by Product Type, 2016 to 2032 Figure 130: MEA Market Volume (Litre) Analysis by Product Type, 2016 to 2032 Figure 131: MEA Market Value Share (%) and BPS Analysis by Product Type, 2022 to 2032 Figure 132: MEA Market Y-o-Y Growth (%) Projections by Product Type, 2022 to 2032 Figure 133: MEA Market Value (US$ Million) Analysis by Spectral Line Size, 2016 to 2032 Figure 134: MEA Market Volume (Litre) Analysis by Spectral Line Size, 2016 to 2032 Figure 135: MEA Market Value Share (%) and BPS Analysis by Spectral Line Size, 2022 to 2032 Figure 136: MEA Market Y-o-Y Growth (%) Projections by Spectral Line Size, 2022 to 2032 Figure 137: MEA Market Value (US$ Million) Analysis by End Use Application, 2016 to 2032 Figure 138: MEA Market Volume (Litre) Analysis by End Use Application, 2016 to 2032 Figure 139: MEA Market Value Share (%) and BPS Analysis by End Use Application, 2022 to 2032 Figure 140: MEA Market Y-o-Y Growth (%) Projections by End Use Application, 2022 to 2032 Figure 141: MEA Market Attractiveness by Product Type, 2022 to 2032 Figure 142: MEA Market Attractiveness by Spectral Line Size, 2022 to 2032 Figure 143: MEA Market Attractiveness by End Use Application, 2022 to 2032 Figure 144: MEA Market Attractiveness by Country, 2022 to 2032
Recommendations
Explore Chemicals & Materials Insights
View Reports