Chemical Resistant EVA Film Market Size and Share Forecast Outlook 2025 to 2035

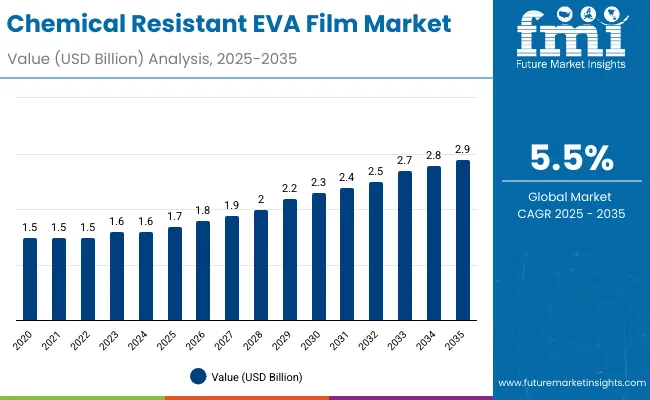
The chemical resistant EVA film market is expected to grow from USD 1.7 billion in 2025 to USD 2.9 billion by 2035, resulting in a total increase of USD 1.2 billion over the forecast decade. This represents a 70.6% total expansion, with the market advancing at a compound annual growth rate (CAGR) of 5.5%. Over ten years, the market grows by a 1.7 multiple.
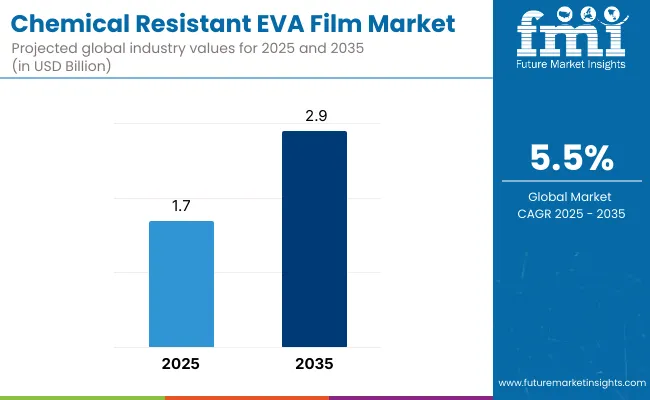
Chemical Resistant Eva Film Market

Quick Stats for Chemical Resistant EVA Film Market

  • Market Value (2025): USD 1.7 billion
  • Market Forecast Value (2035): USD 2.9 billion
  • Market Forecast CAGR: 5.5%
  • Leading Segment in 2025: Cross-linked EVA films (44.2%)
  • Key Growth Regions: Asia-Pacific (China is the fastest-growing market with 5.5% CAGR)
  • Top Key Players: 3M, Shenzhen Gaoren, Exxon Mobil Corporation, Dow, Westlake Corporation, H.B. Fuller, Valéron, Gayatri Plastics Pvt. Ltd, Suguru, Hangzhou First Applied Material Co., Ltd.

Chemical Resistant Eva Film Market Value Analysis

Metric Value
Chemical Resistant EVA Film Market Estimated Value in (2025 E) USD 1.7 billion
Chemical Resistant EVA Film Market Forecast Value in (2035 F) USD 2.9 billion
Forecast CAGR (2025 to 2035) 5.5%

In the first five years (2025 to 2030), the market progresses from USD 1.7 billion to USD 2.2 billion, contributing USD 0.5 billion, or 41.7% of total decade growth. This phase is shaped by growing adoption in solar encapsulation, automotive glass lamination, and construction safety glazing. Demand is reinforced by regulations favoring durable, shatter-resistant materials.

In the second half (2030 to 2035), the market grows from USD 2.2 billion to USD 2.9 billion, adding USD 0.7 billion, or 58.3% of the total growth. This acceleration is supported by advances in modified EVA blends with enhanced resistance to chemicals and UV exposure. Expanding applications in electronics, renewable energy, and industrial packaging further strengthen the market outlook, positioning EVA films as essential protective materials.

From 2020 to 2024, the chemical resistant EVA film market expanded from USD 1.3 billion to USD 1.6 billion, driven by applications in solar panels, automotive glazing, and construction glass requiring durability against solvents and weathering. Nearly 70% of revenue was controlled by material manufacturers specializing in high-performance polymers.

Leaders such as Mitsui Chemicals, Bridgestone, and Sekisui Chemical emphasized cross-linked EVA formulations, high adhesion, and UV stability. Differentiation relied on chemical resistance, optical clarity, and mechanical strength, while integration with smart coatings was secondary. Service-driven models such as lamination audits accounted for less than 15% of revenues, with most buyers opting for material-based procurement.

By 2035, the chemical resistant EVA film market will reach USD 2.9 billion, growing at a CAGR of 5.50%, with sustainable and advanced modified EVA films representing over 40% of value. Competitive momentum will grow as providers introduce bio-based EVA variants, nanocomposite reinforcement, and IoT-linked durability monitoring.

Established players are pivoting toward hybrid models combining EVA films with automation-ready lamination processes. Emerging companies such as STR Holdings, Hangzhou First Applied Material, and Changzhou Sveck are expanding share with recyclable EVA films, improved encapsulation efficiency, and solutions tailored for renewable energy, automotive, and architectural applications.

Why the Chemical Resistant EVA Film Market is growing?

The rising need for durable and protective films in automotive, construction, and electronics is driving growth in the chemical resistant EVA film market. These films provide strong resistance to solvents, oils, and corrosive substances, ensuring reliability in demanding applications. Expanding use in laminated glass, solar panels, and protective packaging further supports adoption.

Films engineered with enhanced cross-linking, UV stability, and superior adhesion are gaining popularity for their ability to maintain clarity and performance under harsh conditions. Their versatility across industrial and consumer applications, combined with lightweight properties, improves operational efficiency. Sustainability-focused developments in recyclable EVA formulations also align with environmental regulations and market demand.

Segmental Analysis

The market is segmented by type, thickness, application, end-use industry, and region. Type segmentation includes standard EVA films, cross-linked EVA films, and modified EVA films, offering varying levels of durability, adhesion, and chemical resistance. Thickness segmentation covers up to 50 microns, 51-100 microns, and above 100 microns, meeting requirements across safety, encapsulation, and industrial use.

Applications include solar panel encapsulation, safety and security glass lamination, automotive windshields and windows, construction glass and facades, electronics protection films, and industrial packaging, ensuring performance under harsh conditions. End-use industries include renewable energy, automotive, building and construction, electronics and electricals, and packaging and industrial goods. Regionally, the market is segmented into North America, Europe, Asia-Pacific, Latin America, and the Middle East & Africa.
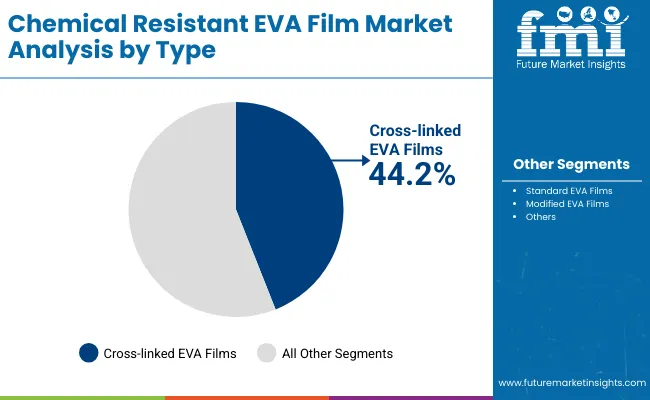
Cross-Linked EVA Films Dominate with Superior Durability and Performance

Chemical Resistant Eva Film Market By Type

Cross-linked EVA films are projected to hold 44.2% of the market in 2025, driven by their enhanced resistance to chemical degradation and thermal stress. Their cross-linked structure provides improved dimensional stability and adhesion, making them ideal for demanding applications such as solar panels and laminated safety glass. These properties ensure long-term performance in harsh environments.

Their growing adoption is supported by the renewable energy sector, where reliability is critical for solar panel encapsulation. Cross-linked EVA films reduce the risk of delamination and ensure consistent optical clarity. As global investment in clean energy rises, their dominance is reinforced by proven durability and safety performance.
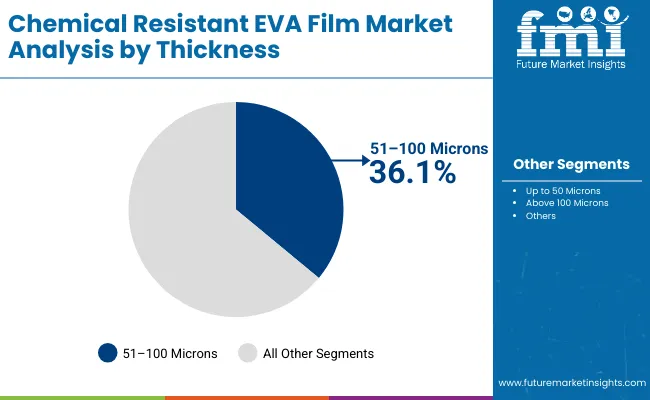
51&-100 Microns Thickness Segment Leads with Versatility Across Applications

Chemical Resistant Eva Film Market By Thickeness

Films in the 51–100 microns range are expected to capture 36.5% of the market in 2025, balancing strength and flexibility for multiple end-uses. This mid-range thickness offers enhanced handling characteristics without compromising barrier or adhesion performance. It is widely adopted across renewable energy, automotive, and construction sectors.

Manufacturers prefer this range for its cost-effectiveness and compatibility with automated lamination processes. Its ability to provide sufficient protection against chemicals and mechanical stress makes it a standard in large-volume applications. Continuous innovation in co-extrusion techniques further supports this segment’s market growth.
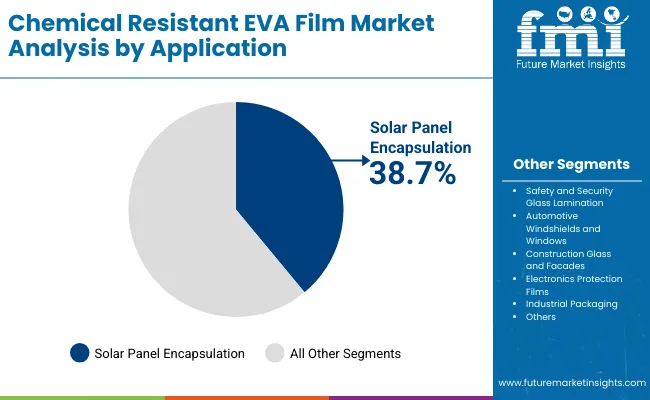
Solar Panel Encapsulation Dominates Applications with Energy Sector Demand

Chemical Resistant Eva Film Market By Application

Solar panel encapsulation is forecast to hold 38.7% of the market in 2025, as EVA films are essential in protecting photovoltaic cells from moisture, UV radiation, and mechanical damage. Their transparency and adhesive strength enable efficient light transmission and durability of modules.

As solar adoption accelerates worldwide, EVA films ensure long-term stability and performance of panels. Their role in reducing power loss and extending service life is critical in utility-scale and residential solar projects. This application remains the largest demand driver for chemical-resistant EVA films.
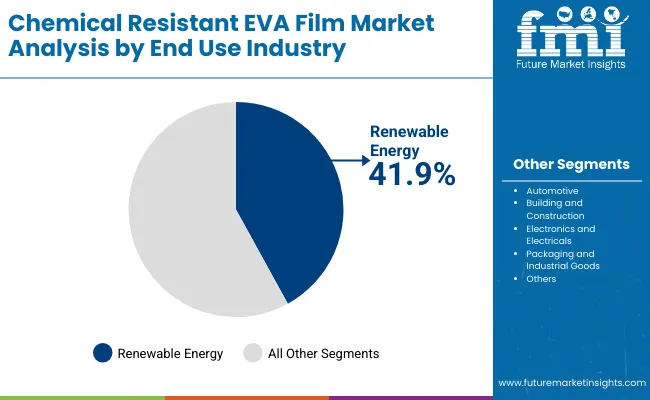
Renewable Energy Industry Leads End-Use with Expanding Solar Investments

Chemical Resistant Eva Film Market End Use Industry

The renewable energy industry is expected to account for 41.9% of the market in 2025, reflecting the central role of EVA films in solar module production. Their chemical resistance, optical clarity, and reliability make them indispensable in energy applications where long operational lifespans are required.

Global policies promoting clean energy are accelerating EVA film adoption, particularly in emerging solar markets. Technological improvements in film formulation further support efficiency gains. As solar capacity continues to expand, renewable energy remains the dominant end-use sector for this market.

What are the Drivers, Restraints, and Key Trends of the Chemical Resistant EVA Film Market?

The chemical resistant EVA film market is expanding as industries demand durable, flexible films with strong chemical resistance for applications in solar, automotive, construction, and electronics. Growth is driven by rising adoption in laminated glass, protective coatings, and encapsulation solutions. However, high production costs and limited recycling options restrain adoption. Advancements in cross-linked EVA, multilayer structures, and sustainable formulations are shaping the market’s future.

Durability, Versatility, and Safety in End-use Applications Driving Adoption

Chemical resistant EVA films are widely used in laminated safety glass, automotive windshields, and solar panels due to their excellent adhesion, durability, and resistance to corrosive agents. Electronics and industrial sectors also rely on EVA films for encapsulating sensitive components. Their transparency, flexibility, and ability to withstand harsh conditions enhance performance across applications. Growth in renewable energy installations and rising automotive safety standards further fuel adoption, positioning EVA films as critical materials in multiple industries.

High Costs, Limited Recycling, and Compatibility Issues Restraining Growth

Despite strong utility, EVA film production involves specialized processes and high-quality resins, driving up costs compared to alternatives. Recycling poses challenges due to cross-linking and multilayer structures, raising environmental concerns in regions with strict waste regulations. Compatibility limitations with certain advanced coatings and substrates restrict their use in some high-performance applications. Volatile raw material prices add further instability, impacting profitability for manufacturers. These factors hinder widespread adoption in cost-sensitive markets.

Cross-linked EVA, Sustainable Materials, and High-performance Trends Emerging

Key trends include the development of cross-linked EVA films with enhanced durability, chemical resistance, and optical properties for demanding applications like solar panels. Manufacturers are exploring bio-based and recyclable EVA blends to meet sustainability goals. Multi-layer structures integrating EVA with advanced polymers are being developed to provide superior performance in safety glass and electronics. Energy-efficient production processes and smart film technologies are also gaining traction. These innovations are positioning chemical resistant EVA films as next-generation materials for safe, sustainable, and high-performance packaging and industrial applications.
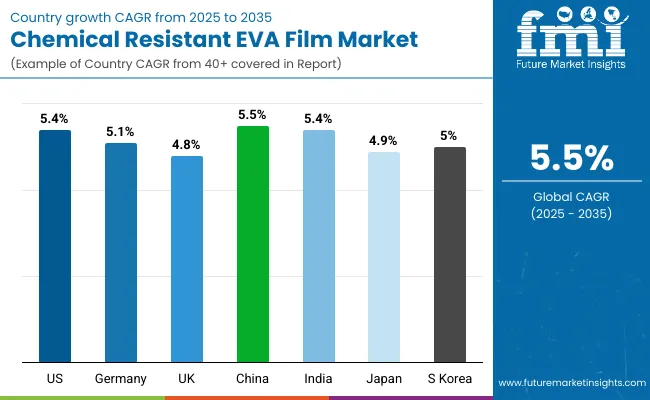
Analysis of Chemical Resistant EVA Film Market by Key Countries

Chemical Resistant Eva Film Market Country Wise Analysis

The global chemical resistant EVA film market is expanding steadily, driven by applications in solar panels, construction glass, automotive glazing, and electronics. Asia-Pacific is emerging as the fastest-growing region, with India and China driving demand through renewable energy projects and infrastructure investments. Developed markets such as the U.S., Germany, and Japan are focusing on high-performance films with enhanced durability, UV resistance, and sustainability. EVA films are increasingly being engineered for compliance, recyclability, and long-term protection in industrial and consumer applications.
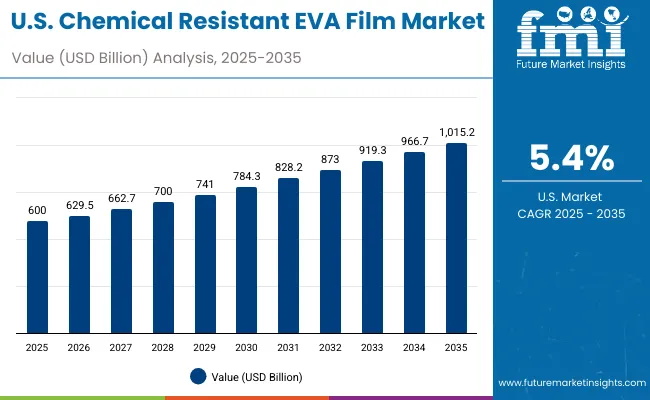
Sales Outlook for Chemical Resistant EVA Film Market United States

Usa Chemical Resistant Eva Film Market

The USA market is projected to grow at a CAGR of 5.4% from 2025 to 2035, supported by strong adoption in solar energy and automotive sectors. EVA films are being increasingly used in photovoltaic module encapsulation and laminated safety glass. Growth is further driven by innovations in UV-resistant coatings and recyclable EVA materials. OEMs are investing in energy-efficient production and multi-layer EVA films to enhance performance, safety, and sustainability in diverse applications across industrial and consumer markets.
  • Solar manufacturers adopt EVA films for long-term photovoltaic encapsulation.
  • Automotive OEMs use EVA laminates for windshields and safety glass.
  • Producers develop recyclable EVA films aligned with eco-compliance goals.

Growth Outlook for Chemical Resistant EVA Film Market Germany

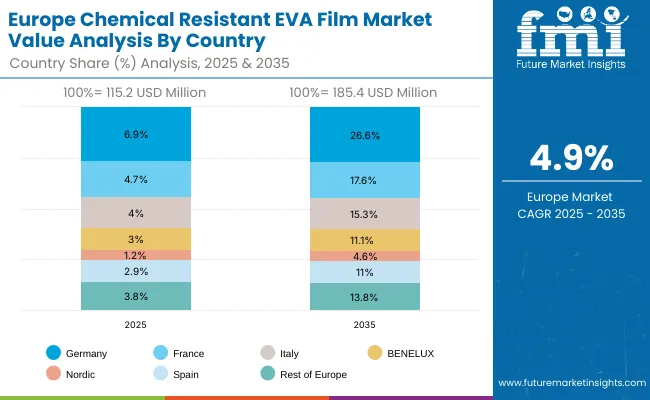
Europe Chemical Resistant Eva Film Market

Germany’s market is expected to grow at a CAGR of 5.1%, anchored by demand in automotive, construction, and renewable energy. EU climate policies are encouraging wider adoption of EVA films in laminated glass and solar panels. Manufacturers are innovating with chemical-resistant and UV-stable EVA films to improve durability. High-end architectural projects are integrating EVA films for safety, energy efficiency, and aesthetics, reinforcing Germany’s role as a leader in advanced EVA applications in Europe.

  • Automotive firms integrate EVA films for laminated safety and durability.
  • Renewable energy projects adopt EVA encapsulation films for efficiency.
  • OEMs design UV-resistant films aligned with EU sustainability mandates.

Expansion Outlook for Chemical Resistant EVA Film Market United Kingdom

The U.K. market is projected to grow at a CAGR of 4.8%, supported by growth in construction, automotive glazing, and renewable energy applications. EVA films are gaining traction in solar panel encapsulation projects encouraged by government energy policies. Adoption in premium architectural glass and safety glazing systems is also expanding. Local manufacturers are focusing on sustainable and high-clarity EVA film formulations, enabling compliance with energy efficiency and safety regulations across industries.

  • Construction sector adopts EVA films for premium laminated glass projects.
  • Solar energy projects integrate EVA encapsulation for grid expansion.
  • OEMs innovate sustainable films with improved optical clarity.

Sales Outlook for Chemical Resistant EVA Film Market China

China’s market is forecast to grow at a CAGR of 5.5%, driven by large-scale renewable energy projects, infrastructure growth, and automotive demand. Domestic manufacturers are scaling EVA production for solar module encapsulation and construction glass. Rising investments in green building initiatives and EV adoption are pushing demand for durable EVA films. Government sustainability regulations are also encouraging development of eco-friendly EVA film formulations for diverse applications across consumer and industrial markets.

  • Solar module producers scale EVA use for national renewable energy goals.
  • EV makers integrate EVA films for lightweight laminated glass.
  • OEMs manufacture cost-effective films aligned with green compliance.

Growth Outlook for Chemical Resistant EVA Film Market India

India is projected to grow at a CAGR of 5.4%, supported by rapid expansion in solar energy, construction, and automotive safety glass. Government-led renewable energy programs and infrastructure development are fueling demand. SMEs are adopting EVA films for cost-effective laminated glass solutions. With export growth in solar and construction materials, manufacturers are developing recyclable EVA films with high chemical resistance to meet global standards and sustainability initiatives.

  • Solar projects integrate EVA films for photovoltaic encapsulation efficiency.
  • Construction firms adopt EVA for high-strength laminated safety glass.
  • SMEs deploy EVA solutions balancing cost-effectiveness and durability.

Growth Outlook for Chemical Resistant EVA Film Market Japan

Japan’s market is projected to grow at a CAGR of 4.9%, led by demand in electronics, construction glass, and automotive industries. EVA films are being deployed for precision electronics encapsulation and architectural safety glazing. Manufacturers are innovating with moisture-resistant, UV-stable EVA films to ensure product reliability. With strong emphasis on safety and product performance, Japan’s market continues to invest in advanced EVA film technologies for long-term durability in consumer and industrial use cases.
  • Electronics firms use EVA films for sensitive device encapsulation.
  • Construction projects deploy EVA in premium laminated safety glass.
  • OEMs design moisture- and UV-resistant EVA films for durability.

Expansion Outlook for Chemical Resistant EVA Film Market South Korea

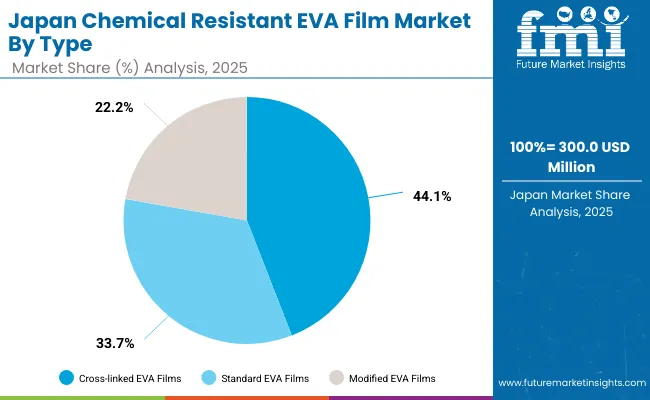
South Korea Chemical Resistant Eva Film Market

South Korea’s market is expected to grow at a CAGR of 5.0%, supported by electronics, solar energy, and automotive applications. EVA films are being adopted in semiconductor packaging, laminated safety glass, and solar module encapsulation. Strong export orientation in electronics and renewable energy is fueling demand. Manufacturers are innovating compact, durable EVA films that align with international sustainability regulations and provide cost efficiency, enabling broader adoption in domestic and global industries.
  • Electronics sector adopts EVA films for semiconductor encapsulation.
  • Solar projects use EVA films in module assembly for exports.
  • OEMs develop compact durable films aligned with global standards.

Analysis of Japan’s chemical resistant EVA film market by Type

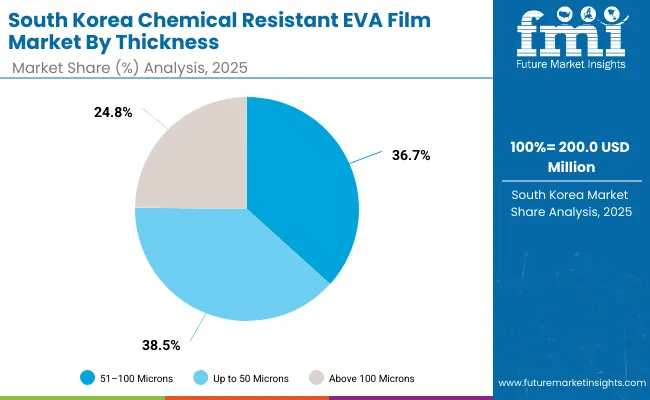
Japan Chemical Resistant Eva Film Market

Japan’s chemical resistant EVA film market, valued at USD 300 million in 2025, is led by cross-linked EVA films, which hold 42.4% share due to superior durability and performance in demanding applications. Standard EVA films follow with 36.7%, while modified EVA films account for 20.9%. Cross-linked films dominate in solar panels, automotive, and industrial packaging, where resistance to chemicals and heat is essential. Standard films remain cost-effective for general lamination needs. Modified EVA films, though smaller in share, are finding niche applications with customized formulations, reflecting Japan’s steady demand for specialized materials supporting innovation, sustainability, and advanced manufacturing.

Analysis of South Korea’s chemical resistant EVA film market by Thickness

South Korea’s chemical resistant EVA film market in 2025, worth USD 200 million, is almost evenly split between 51-100 microns (37.9%) and up to 50 microns (38.3%). Films above 100 microns account for 23.8%, representing specialized use cases. Thin films up to 50 microns are widely adopted in flexible electronics and laminates, while mid-range 51-100 micron films dominate for balance of strength, durability, and cost. Thicker films above 100 microns, though smaller in share, cater to applications needing high structural integrity and protection. This distribution highlights South Korea’s diversified adoption across packaging, electronics, and construction sectors requiring chemical resistance.
Competitive Landscape of Chemical Resistant EVA Film Market

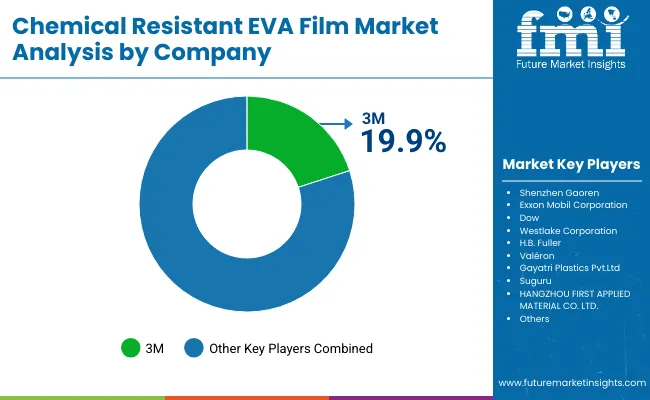
Chemical Resistant Eva Film Market By Company

The chemical resistant EVA film market is moderately fragmented, with polymer producers, specialty film manufacturers, and adhesive solution providers competing across automotive, construction, solar, and electronics sectors. Global leaders such as 3M, Exxon Mobil Corporation, and Dow hold notable market share, driven by advanced polymer formulations, high chemical resistance, and compliance with international safety and durability standards. Their strategies increasingly emphasize renewable energy integration, lightweight designs, and eco-friendly resin innovation.

Established mid-sized players including Westlake Corporation, H.B. Fuller, and Valéron are supporting adoption of EVA films featuring cross-linked structures, enhanced adhesion, and long-term stability under harsh environments. These companies are especially active in solar encapsulation, laminated safety glass, and industrial protection films, offering tailored performance, consistent supply, and innovations that improve end-use durability and cost efficiency.

Specialized regional manufacturers such as Gayatri Plastics Pvt. Ltd., Suguru, and Hangzhou First Applied Material Co., Ltd. focus on customized EVA film solutions for regional industries. Their strengths lie in cost-efficient production, rapid customization, and flexible thickness offerings, while also investing in chemical-resistant technologies for electronics, packaging, and construction markets to address evolving global demand.

Key Developments

  • In July 2025, 3M was recognized in the EVA Films Company Evaluation Report 2024-2025 as a global innovation leader in EVA films, particularly in advanced formulations with crosslinking and UV stabilization that contribute to chemical durability.
  • In 2024-2025, Valéron’s cross-laminated polyethylene films are explicitly highlighted for their chemical resistance, along with tear and puncture strength. These properties make them suitable for packaging chemicals, detergents, and industrial goods.

Key Companies

  • 3M
  • Shenzhen Gaoren
  • Exxon Mobil Corporation
  • Dow
  • Westlake Corporation
  • H.B. Fuller
  • Valéron
  • Gayatri Plastics Pvt.Ltd
  • Suguru
  • HANGZHOU FIRST APPLIED MATERIAL CO.,LTD.

Scope of the Report

Item Value
Quantitative Units USD 1.7 Billion
By Type Standard EVA Films, Cross-linked EVA Films, Modified EVA Films
By Thickness Up to 50 Microns, 51-100 Microns, Above 100 Microns
By Application Solar Panel Encapsulation, Safety and Security Glass Lamination, Automotive Windshields and Windows, Construction Glass and Facades, Electronics Protection Films, Industrial Packaging
By End-Use Industry Renewable Energy, Automotive, Building and Construction, Electronics and Electricals, Packaging and Industrial Goods
Key Companies Profiled 3M, Shenzhen Gaoren , Exxon Mobil Corporation, Dow, Westlake Corporation, H.B. Fuller, Valéron , Gayatri Plastics Pvt. Ltd, Suguru, Hangzhou First Applied Material Co., Ltd.
Additional Attributes Cross-linked EVA films are projected to dominate with a 44.2% share in 2025 due to superior chemical resistance and durability, rising demand from solar panel encapsulation driving renewable energy applications, increasing use in automotive windshields and construction glass laminations, growing electronics sector requiring protection films, and packaging industries adopting EVA films for industrial-grade safety and longevity.

Key Segmentation

By Type:

  • Cross-linked EVA Films
  • Standard EVA Films
  • Modified EVA Films

By Thickness:

  • 51-100 Microns
  • Up to 50 Microns
  • Above 100 Microns

By Application:

  • Solar Panel Encapsulation
  • Safety and Security Glass Lamination
  • Automotive Windshields and Windows
  • Construction Glass and Facades
  • Electronics Protection Films
  • Industrial Packaging

By End-Use Industry:

  • Renewable Energy
  • Automotive
  • Building and Construction
  • Electronics and Electricals
  • Packaging and Industrial Goods

By Region:

  • North America
  • Europe
  • Asia-Pacific
  • Latin America
  • Middle East & Africa

Table of Content

  1. Executive Summary
    • Global Market Outlook
    • Demand-side Trends
    • Supply-side Trends
    • Technology Roadmap Analysis
    • Analysis and Recommendations
  2. Market Overview
    • Market Coverage / Taxonomy
    • Market Definition / Scope / Limitations
  3. Market Background
    • Market Dynamics
      • Drivers
      • Restraints
      • Opportunity
      • Trends
    • Scenario Forecast
      • Demand in Optimistic Scenario
      • Demand in Likely Scenario
      • Demand in Conservative Scenario
    • Opportunity Map Analysis
    • Product Life Cycle Analysis
    • Supply Chain Analysis
      • Supply Side Participants and their Roles
        • Producers
        • Mid-Level Participants (Traders/ Agents/ Brokers)
        • Wholesalers and Distributors
      • Value Added and Value Created at Node in the Supply Chain
      • List of Raw Material Suppliers
      • List of Existing and Potential Buyer’s
    • Investment Feasibility Matrix
    • Value Chain Analysis
      • Profit Margin Analysis
      • Wholesalers and Distributors
      • Retailers
    • PESTLE and Porter’s Analysis
    • Regulatory Landscape
      • By Key Regions
      • By Key Countries
    • Regional Parent Market Outlook
    • Production and Consumption Statistics
    • Import and Export Statistics
  4. Global Market Analysis 2020 to 2024 and Forecast, 2025 to 2035
    • Historical Market Size Value (USD Billion) & Volume (Units) Analysis, 2020 to 2024
    • Current and Future Market Size Value (USD Billion) & Volume (Units) Projections, 2025 to 2035
      • Y-o-Y Growth Trend Analysis
      • Absolute $ Opportunity Analysis
  5. Global Market Analysis 2020 to 2024 and Forecast 2025 to 2035, By Type
    • Introduction / Key Findings
    • Historical Market Size Value (USD Billion) & Volume (Units) Analysis By Type, 2020 to 2024
    • Current and Future Market Size Value (USD Billion) & Volume (Units) Analysis and Forecast By Type, 2025 to 2035
      • Standard EVA Films
      • Cross-linked EVA Films
      • Modified EVA Films
    • Y-o-Y Growth Trend Analysis By Type, 2020 to 2024
    • Absolute $ Opportunity Analysis By Type, 2025 to 2035
  6. Global Market Analysis 2020 to 2024 and Forecast 2025 to 2035, By Thickness
    • Introduction / Key Findings
    • Historical Market Size Value (USD Billion) & Volume (Units) Analysis By Thickness, 2020 to 2024
    • Current and Future Market Size Value (USD Billion) & Volume (Units) Analysis and Forecast By Thickness, 2025 to 2035
      • Up to 50 Microns
      • 51–100 Microns
      • Above 100 Microns
    • Y-o-Y Growth Trend Analysis By Thickness, 2020 to 2024
    • Absolute $ Opportunity Analysis By Thickness, 2025 to 2035
  7. Global Market Analysis 2020 to 2024 and Forecast 2025 to 2035, By Application
    • Introduction / Key Findings
    • Historical Market Size Value (USD Billion) & Volume (Units) Analysis By Application, 2020 to 2024
    • Current and Future Market Size Value (USD Billion) & Volume (Units) Analysis and Forecast By Application, 2025 to 2035
      • Solar Panel Encapsulation
      • Safety and Security Glass Lamination
      • Automotive Windshields and Windows
      • Construction Glass and Facades
      • Electronics Protection Films
      • Industrial Packaging
    • Y-o-Y Growth Trend Analysis By Application, 2020 to 2024
    • Absolute $ Opportunity Analysis By Application, 2025 to 2035
  8. Global Market Analysis 2020 to 2024 and Forecast 2025 to 2035, By End-Use Industry
    • Introduction / Key Findings
    • Historical Market Size Value (USD Billion) & Volume (Units) Analysis By End-Use Industry, 2020 to 2024
    • Current and Future Market Size Value (USD Billion) & Volume (Units) Analysis and Forecast By End-Use Industry, 2025 to 2035
      • Renewable Energy
      • Automotive
      • Building and Construction
      • Electronics and Electricals
      • Packaging and Industrial Goods
    • Y-o-Y Growth Trend Analysis By End-Use Industry, 2020 to 2024
    • Absolute $ Opportunity Analysis By End-Use Industry, 2025 to 2035
  9. Global Market Analysis 2020 to 2024 and Forecast 2025 to 2035, By Region
    • Introduction
    • Historical Market Size Value (USD Billion) & Volume (Units) Analysis By Region, 2020 to 2024
    • Current Market Size Value (USD Billion) & Volume (Units) Analysis and Forecast By Region, 2025 to 2035
      • North America
      • Latin America
      • East Asia
      • South Asia & Pacific
      • Western Europe
      • Eastern Europe
      • Middle East & Africa
    • Market Attractiveness Analysis By Region
  10. North America Market Analysis 2020 to 2024 and Forecast 2025 to 2035, By Country
    • Historical Market Size Value (USD Billion) & Volume (Units) Trend Analysis By Market Taxonomy, 2020 to 2024
    • Market Size Value (USD Billion) & Volume (Units) Forecast By Market Taxonomy, 2025 to 2035
      • By Country
        • U.S.
        • Canada
        • Mexico
      • By Type
      • By Thickness
      • By Application
      • By End-Use Industry
    • Market Attractiveness Analysis
      • By Country
      • By Type
      • By Thickness
      • By Application
      • By End-Use Industry
    • Key Takeaways
  11. Latin America Market Analysis 2020 to 2024 and Forecast 2025 to 2035, By Country
    • Historical Market Size Value (USD Billion) & Volume (Units) Trend Analysis By Market Taxonomy, 2020 to 2024
    • Market Size Value (USD Billion) & Volume (Units) Forecast By Market Taxonomy, 2025 to 2035
      • By Country
        • Brazil
        • Argentina
        • Rest of Latin America
      • By Type
      • By Thickness
      • By Application
      • By End-Use Industry
    • Market Attractiveness Analysis
      • By Country
      • By Type
      • By Thickness
      • By Application
      • By End-Use Industry
    • Key Takeaways
  12. East Asia Market Analysis 2020 to 2024 and Forecast 2025 to 2035, By Country
    • Historical Market Size Value (USD Billion) & Volume (Units) Trend Analysis By Market Taxonomy, 2020 to 2024
    • Market Size Value (USD Billion) & Volume (Units) Forecast By Market Taxonomy, 2025 to 2035
      • By Country
        • China
        • Japan
        • South Korea
      • By Type
      • By Thickness
      • By Application
      • By End-Use Industry
    • Market Attractiveness Analysis
      • By Country
      • By Type
      • By Thickness
      • By Application
      • By End-Use Industry
    • Key Takeaways
  13. South Asia & Pacific Market Analysis 2020 to 2024 and Forecast 2025 to 2035, By Country
    • Historical Market Size Value (USD Billion) & Volume (Units) Trend Analysis By Market Taxonomy, 2020 to 2024
    • Market Size Value (USD Billion) & Volume (Units) Forecast By Market Taxonomy, 2025 to 2035
      • By Country
        • India
        • ASEAN Countries
        • Australia& New Zealand
        • Rest of South Asia
      • By Type
      • By Thickness
      • By Application
      • By End-Use Industry
    • Market Attractiveness Analysis
      • By Country
      • By Type
      • By Thickness
      • By Application
      • By End-Use Industry
    • Key Takeaways
  14. Western Europe Market Analysis 2020 to 2024 and Forecast 2025 to 2035, By Country
    • Historical Market Size Value (USD Billion) & Volume (Units) Trend Analysis By Market Taxonomy, 2020 to 2024
    • Market Size Value (USD Billion) & Volume (Units) Forecast By Market Taxonomy, 2025 to 2035
      • By Country
        • Germany
        • U.K.
        • France
        • Italy
        • Spain
        • BENELUX
        • Nordic Countries
        • Rest of Western Europe
      • By Type
      • By Thickness
      • By Application
      • By End-Use Industry
    • Market Attractiveness Analysis
      • By Country
      • By Type
      • By Thickness
      • By Application
      • By End-Use Industry
    • Key Takeaways
  15. Eastern Europe Market Analysis 2020 to 2024 and Forecast 2025 to 2035, By Country
    • Historical Market Size Value (USD Billion) & Volume (Units) Trend Analysis By Market Taxonomy, 2020 to 2024
    • Market Size Value (USD Billion) & Volume (Units) Forecast By Market Taxonomy, 2025 to 2035
      • By Country
        • Russia
        • Hungary
        • Poland
        • Rest of Eastern Europe
      • By Type
      • By Thickness
      • By Application
      • By End-Use Industry
    • Market Attractiveness Analysis
      • By Country
      • By Type
      • By Thickness
      • By Application
      • By End-Use Industry
    • Key Takeaways
  16. Middle East & Africa Market Analysis 2020 to 2024 and Forecast 2025 to 2035, By Country
    • Historical Market Size Value (USD Billion) & Volume (Units) Trend Analysis By Market Taxonomy, 2020 to 2024
    • Market Size Value (USD Billion) & Volume (Units) Forecast By Market Taxonomy, 2025 to 2035
      • By Country
        • Saudi Arabia
        • Türkiye
        • South Africa
        • Other African Union
        • Rest of Middle East & Africa
      • By Type
      • By Thickness
      • By Application
      • By End-Use Industry
    • Market Attractiveness Analysis
      • By Country
      • By Type
      • By Thickness
      • By Application
      • By End-Use Industry
    • Key Takeaways
  17. Key Countries Market Analysis
    • U.S.
      • Pricing Analysis
      • Market Share Analysis, 2024
        • By Type
        • By Thickness
        • By Application
        • By End-Use Industry
    • Brazil
      • Pricing Analysis
      • Market Share Analysis, 2024
        • By Type
        • By Thickness
        • By Application
        • By End-Use Industry
    • China
      • Pricing Analysis
      • Market Share Analysis, 2024
        • By Type
        • By Thickness
        • By Application
        • By End-Use Industry
    • India
      • Pricing Analysis
      • Market Share Analysis, 2024
        • By Type
        • By Thickness
        • By Application
        • By End-Use Industry
    • Europe
      • Pricing Analysis
      • Market Share Analysis, 2024
        • By Type
        • By Thickness
        • By Application
        • By End-Use Industry
    • Germany
      • Pricing Analysis
      • Market Share Analysis, 2024
        • By Type
        • By Thickness
        • By Application
        • By End-Use Industry
    • France
      • Pricing Analysis
      • Market Share Analysis, 2024
        • By Type
        • By Thickness
        • By Application
        • By End-Use Industry
    • U.K.
      • Pricing Analysis
      • Market Share Analysis, 2024
        • By Type
        • By Thickness
        • By Application
        • By End-Use Industry
  18. Market Structure Analysis
    • Competition Dashboard
    • Competition Benchmarking
    • Market Share Analysis of Top Players
      • By Regional
      • By Type
      • By Thickness
      • By Application
      • By End-Use Industry
  19. Competition Analysis
    • Competition Deep Dive
      • 3M
        • Overview
        • Product Portfolio
        • Profitability by Market Segments (Product/Age /Sales Channel/Region)
        • Sales Footprint
        • Strategy Overview
          • Marketing Strategy
          • Product Strategy
          • Channel Strategy
      • Shenzhen Gaoren
        • Overview
        • Product Portfolio
        • Profitability by Market Segments (Product/Age /Sales Channel/Region)
        • Sales Footprint
        • Strategy Overview
          • Marketing Strategy
          • Product Strategy
          • Channel Strategy
      • Exxon Mobil Corporation
        • Overview
        • Product Portfolio
        • Profitability by Market Segments (Product/Age /Sales Channel/Region)
        • Sales Footprint
        • Strategy Overview
          • Marketing Strategy
          • Product Strategy
          • Channel Strategy
      • Dow
        • Overview
        • Product Portfolio
        • Profitability by Market Segments (Product/Age /Sales Channel/Region)
        • Sales Footprint
        • Strategy Overview
          • Marketing Strategy
          • Product Strategy
          • Channel Strategy
      • Westlake Corporation
        • Overview
        • Product Portfolio
        • Profitability by Market Segments (Product/Age /Sales Channel/Region)
        • Sales Footprint
        • Strategy Overview
          • Marketing Strategy
          • Product Strategy
          • Channel Strategy
      • H.B. Fuller
        • Overview
        • Product Portfolio
        • Profitability by Market Segments (Product/Age /Sales Channel/Region)
        • Sales Footprint
        • Strategy Overview
          • Marketing Strategy
          • Product Strategy
          • Channel Strategy
      • Valéron
        • Overview
        • Product Portfolio
        • Profitability by Market Segments (Product/Age /Sales Channel/Region)
        • Sales Footprint
        • Strategy Overview
          • Marketing Strategy
          • Product Strategy
          • Channel Strategy
      • Gayatri Plastics Pvt.Ltd
        • Overview
        • Product Portfolio
        • Profitability by Market Segments (Product/Age /Sales Channel/Region)
        • Sales Footprint
        • Strategy Overview
          • Marketing Strategy
          • Product Strategy
          • Channel Strategy
      • Suguru
        • Overview
        • Product Portfolio
        • Profitability by Market Segments (Product/Age /Sales Channel/Region)
        • Sales Footprint
        • Strategy Overview
          • Marketing Strategy
          • Product Strategy
          • Channel Strategy
      • HANGZHOU FIRST APPLIED MATERIAL CO.,LTD.
        • Overview
        • Product Portfolio
        • Profitability by Market Segments (Product/Age /Sales Channel/Region)
        • Sales Footprint
        • Strategy Overview
          • Marketing Strategy
          • Product Strategy
          • Channel Strategy
  20. Assumptions & Acronyms Used
  21. Research Methodology

List of Tables

  • Table 1: Global Market Value (USD Billion) Forecast by Region, 2020-2035
  • Table 2: Global Market Volume (Units) Forecast by Region, 2020-2035
  • Table 3: Global Market Value (USD Billion) Forecast by Type, 2020-2035
  • Table 4: Global Market Volume (Units) Forecast by Type, 2020-2035
  • Table 5: Global Market Value (USD Billion) Forecast by Thickness, 2020-2035
  • Table 6: Global Market Volume (Units) Forecast by Thickness, 2020-2035
  • Table 7: Global Market Value (USD Billion) Forecast by Application, 2020-2035
  • Table 8: Global Market Volume (Units) Forecast by Application, 2020-2035
  • Table 9: Global Market Value (USD Billion) Forecast by End-Use Industry, 2020-2035
  • Table 10: Global Market Volume (Units) Forecast by End-Use Industry, 2020-2035
  • Table 11: North America Market Value (USD Billion) Forecast by Country, 2020-2035
  • Table 12: North America Market Volume (Units) Forecast by Country, 2020-2035
  • Table 13: North America Market Value (USD Billion) Forecast by Type, 2020-2035
  • Table 14: North America Market Volume (Units) Forecast by Type, 2020-2035
  • Table 15: North America Market Value (USD Billion) Forecast by Thickness, 2020-2035
  • Table 16: North America Market Volume (Units) Forecast by Thickness, 2020-2035
  • Table 17: North America Market Value (USD Billion) Forecast by Application, 2020-2035
  • Table 18: North America Market Volume (Units) Forecast by Application, 2020-2035
  • Table 19: North America Market Value (USD Billion) Forecast by End-Use Industry, 2020-2035
  • Table 20: North America Market Volume (Units) Forecast by End-Use Industry, 2020-2035
  • Table 21: Latin America Market Value (USD Billion) Forecast by Country, 2020-2035
  • Table 22: Latin America Market Volume (Units) Forecast by Country, 2020-2035
  • Table 23: Latin America Market Value (USD Billion) Forecast by Type, 2020-2035
  • Table 24: Latin America Market Volume (Units) Forecast by Type, 2020-2035
  • Table 25: Latin America Market Value (USD Billion) Forecast by Thickness, 2020-2035
  • Table 26: Latin America Market Volume (Units) Forecast by Thickness, 2020-2035
  • Table 27: Latin America Market Value (USD Billion) Forecast by Application, 2020-2035
  • Table 28: Latin America Market Volume (Units) Forecast by Application, 2020-2035
  • Table 29: Latin America Market Value (USD Billion) Forecast by End-Use Industry, 2020-2035
  • Table 30: Latin America Market Volume (Units) Forecast by End-Use Industry, 2020-2035
  • Table 31: East Asia Market Value (USD Billion) Forecast by Country, 2020-2035
  • Table 32: East Asia Market Volume (Units) Forecast by Country, 2020-2035
  • Table 33: East Asia Market Value (USD Billion) Forecast by Type, 2020-2035
  • Table 34: East Asia Market Volume (Units) Forecast by Type, 2020-2035
  • Table 35: East Asia Market Value (USD Billion) Forecast by Thickness, 2020-2035
  • Table 36: East Asia Market Volume (Units) Forecast by Thickness, 2020-2035
  • Table 37: East Asia Market Value (USD Billion) Forecast by Application, 2020-2035
  • Table 38: East Asia Market Volume (Units) Forecast by Application, 2020-2035
  • Table 39: East Asia Market Value (USD Billion) Forecast by End-Use Industry, 2020-2035
  • Table 40: East Asia Market Volume (Units) Forecast by End-Use Industry, 2020-2035
  • Table 41: South Asia & Pacific Market Value (USD Billion) Forecast by Country, 2020-2035
  • Table 42: South Asia & Pacific Market Volume (Units) Forecast by Country, 2020-2035
  • Table 43: South Asia & Pacific Market Value (USD Billion) Forecast by Type, 2020-2035
  • Table 44: South Asia & Pacific Market Volume (Units) Forecast by Type, 2020-2035
  • Table 45: South Asia & Pacific Market Value (USD Billion) Forecast by Thickness, 2020-2035
  • Table 46: South Asia & Pacific Market Volume (Units) Forecast by Thickness, 2020-2035
  • Table 47: South Asia & Pacific Market Value (USD Billion) Forecast by Application, 2020-2035
  • Table 48: South Asia & Pacific Market Volume (Units) Forecast by Application, 2020-2035
  • Table 49: South Asia & Pacific Market Value (USD Billion) Forecast by End-Use Industry, 2020-2035
  • Table 50: South Asia & Pacific Market Volume (Units) Forecast by End-Use Industry, 2020-2035
  • Table 51: Western Europe Market Value (USD Billion) Forecast by Country, 2020-2035
  • Table 52: Western Europe Market Volume (Units) Forecast by Country, 2020-2035
  • Table 53: Western Europe Market Value (USD Billion) Forecast by Type, 2020-2035
  • Table 54: Western Europe Market Volume (Units) Forecast by Type, 2020-2035
  • Table 55: Western Europe Market Value (USD Billion) Forecast by Thickness, 2020-2035
  • Table 56: Western Europe Market Volume (Units) Forecast by Thickness, 2020-2035
  • Table 57: Western Europe Market Value (USD Billion) Forecast by Application, 2020-2035
  • Table 58: Western Europe Market Volume (Units) Forecast by Application, 2020-2035
  • Table 59: Western Europe Market Value (USD Billion) Forecast by End-Use Industry, 2020-2035
  • Table 60: Western Europe Market Volume (Units) Forecast by End-Use Industry, 2020-2035
  • Table 61: Eastern Europe Market Value (USD Billion) Forecast by Country, 2020-2035
  • Table 62: Eastern Europe Market Volume (Units) Forecast by Country, 2020-2035
  • Table 63: Eastern Europe Market Value (USD Billion) Forecast by Type, 2020-2035
  • Table 64: Eastern Europe Market Volume (Units) Forecast by Type, 2020-2035
  • Table 65: Eastern Europe Market Value (USD Billion) Forecast by Thickness, 2020-2035
  • Table 66: Eastern Europe Market Volume (Units) Forecast by Thickness, 2020-2035
  • Table 67: Eastern Europe Market Value (USD Billion) Forecast by Application, 2020-2035
  • Table 68: Eastern Europe Market Volume (Units) Forecast by Application, 2020-2035
  • Table 69: Eastern Europe Market Value (USD Billion) Forecast by End-Use Industry, 2020-2035
  • Table 70: Eastern Europe Market Volume (Units) Forecast by End-Use Industry, 2020-2035
  • Table 71: Middle East & Africa Market Value (USD Billion) Forecast by Country, 2020-2035
  • Table 72: Middle East & Africa Market Volume (Units) Forecast by Country, 2020-2035
  • Table 73: Middle East & Africa Market Value (USD Billion) Forecast by Type, 2020-2035
  • Table 74: Middle East & Africa Market Volume (Units) Forecast by Type, 2020-2035
  • Table 75: Middle East & Africa Market Value (USD Billion) Forecast by Thickness, 2020-2035
  • Table 76: Middle East & Africa Market Volume (Units) Forecast by Thickness, 2020-2035
  • Table 77: Middle East & Africa Market Value (USD Billion) Forecast by Application, 2020-2035
  • Table 78: Middle East & Africa Market Volume (Units) Forecast by Application, 2020-2035
  • Table 79: Middle East & Africa Market Value (USD Billion) Forecast by End-Use Industry, 2020-2035
  • Table 80: Middle East & Africa Market Volume (Units) Forecast by End-Use Industry, 2020-2035

List of Figures

  • Figure 1: Global Market Value (USD Billion) by Type, 2025-2035
  • Figure 2: Global Market Value (USD Billion) by Thickness, 2025-2035
  • Figure 3: Global Market Value (USD Billion) by Application, 2025-2035
  • Figure 4: Global Market Value (USD Billion) by End-Use Industry, 2025-2035
  • Figure 5: Global Market Value (USD Billion) by Region, 2025-2035
  • Figure 6: Global Market Value (USD Billion) Analysis by Region, 2020-2035
  • Figure 7: Global Market Volume (Units) Analysis by Region, 2020-2035
  • Figure 8: Global Market Value Share (%) and BPS Analysis by Region, 2025-2035
  • Figure 9: Global Market Y-o-Y Growth (%) Projections by Region, 2025-2035
  • Figure 10: Global Market Value (USD Billion) Analysis by Type, 2020-2035
  • Figure 11: Global Market Volume (Units) Analysis by Type, 2020-2035
  • Figure 12: Global Market Value Share (%) and BPS Analysis by Type, 2025-2035
  • Figure 13: Global Market Y-o-Y Growth (%) Projections by Type, 2025-2035
  • Figure 14: Global Market Value (USD Billion) Analysis by Thickness, 2020-2035
  • Figure 15: Global Market Volume (Units) Analysis by Thickness, 2020-2035
  • Figure 16: Global Market Value Share (%) and BPS Analysis by Thickness, 2025-2035
  • Figure 17: Global Market Y-o-Y Growth (%) Projections by Thickness, 2025-2035
  • Figure 18: Global Market Value (USD Billion) Analysis by Application, 2020-2035
  • Figure 19: Global Market Volume (Units) Analysis by Application, 2020-2035
  • Figure 20: Global Market Value Share (%) and BPS Analysis by Application, 2025-2035
  • Figure 21: Global Market Y-o-Y Growth (%) Projections by Application, 2025-2035
  • Figure 22: Global Market Value (USD Billion) Analysis by End-Use Industry, 2020-2035
  • Figure 23: Global Market Volume (Units) Analysis by End-Use Industry, 2020-2035
  • Figure 24: Global Market Value Share (%) and BPS Analysis by End-Use Industry, 2025-2035
  • Figure 25: Global Market Y-o-Y Growth (%) Projections by End-Use Industry, 2025-2035
  • Figure 26: Global Market Attractiveness by Type, 2025-2035
  • Figure 27: Global Market Attractiveness by Thickness, 2025-2035
  • Figure 28: Global Market Attractiveness by Application, 2025-2035
  • Figure 29: Global Market Attractiveness by End-Use Industry, 2025-2035
  • Figure 30: Global Market Attractiveness by Region, 2025-2035
  • Figure 31: North America Market Value (USD Billion) by Type, 2025-2035
  • Figure 32: North America Market Value (USD Billion) by Thickness, 2025-2035
  • Figure 33: North America Market Value (USD Billion) by Application, 2025-2035
  • Figure 34: North America Market Value (USD Billion) by End-Use Industry, 2025-2035
  • Figure 35: North America Market Value (USD Billion) by Country, 2025-2035
  • Figure 36: North America Market Value (USD Billion) Analysis by Country, 2020-2035
  • Figure 37: North America Market Volume (Units) Analysis by Country, 2020-2035
  • Figure 38: North America Market Value Share (%) and BPS Analysis by Country, 2025-2035
  • Figure 39: North America Market Y-o-Y Growth (%) Projections by Country, 2025-2035
  • Figure 40: North America Market Value (USD Billion) Analysis by Type, 2020-2035
  • Figure 41: North America Market Volume (Units) Analysis by Type, 2020-2035
  • Figure 42: North America Market Value Share (%) and BPS Analysis by Type, 2025-2035
  • Figure 43: North America Market Y-o-Y Growth (%) Projections by Type, 2025-2035
  • Figure 44: North America Market Value (USD Billion) Analysis by Thickness, 2020-2035
  • Figure 45: North America Market Volume (Units) Analysis by Thickness, 2020-2035
  • Figure 46: North America Market Value Share (%) and BPS Analysis by Thickness, 2025-2035
  • Figure 47: North America Market Y-o-Y Growth (%) Projections by Thickness, 2025-2035
  • Figure 48: North America Market Value (USD Billion) Analysis by Application, 2020-2035
  • Figure 49: North America Market Volume (Units) Analysis by Application, 2020-2035
  • Figure 50: North America Market Value Share (%) and BPS Analysis by Application, 2025-2035
  • Figure 51: North America Market Y-o-Y Growth (%) Projections by Application, 2025-2035
  • Figure 52: North America Market Value (USD Billion) Analysis by End-Use Industry, 2020-2035
  • Figure 53: North America Market Volume (Units) Analysis by End-Use Industry, 2020-2035
  • Figure 54: North America Market Value Share (%) and BPS Analysis by End-Use Industry, 2025-2035
  • Figure 55: North America Market Y-o-Y Growth (%) Projections by End-Use Industry, 2025-2035
  • Figure 56: North America Market Attractiveness by Type, 2025-2035
  • Figure 57: North America Market Attractiveness by Thickness, 2025-2035
  • Figure 58: North America Market Attractiveness by Application, 2025-2035
  • Figure 59: North America Market Attractiveness by End-Use Industry, 2025-2035
  • Figure 60: North America Market Attractiveness by Country, 2025-2035
  • Figure 61: Latin America Market Value (USD Billion) by Type, 2025-2035
  • Figure 62: Latin America Market Value (USD Billion) by Thickness, 2025-2035
  • Figure 63: Latin America Market Value (USD Billion) by Application, 2025-2035
  • Figure 64: Latin America Market Value (USD Billion) by End-Use Industry, 2025-2035
  • Figure 65: Latin America Market Value (USD Billion) by Country, 2025-2035
  • Figure 66: Latin America Market Value (USD Billion) Analysis by Country, 2020-2035
  • Figure 67: Latin America Market Volume (Units) Analysis by Country, 2020-2035
  • Figure 68: Latin America Market Value Share (%) and BPS Analysis by Country, 2025-2035
  • Figure 69: Latin America Market Y-o-Y Growth (%) Projections by Country, 2025-2035
  • Figure 70: Latin America Market Value (USD Billion) Analysis by Type, 2020-2035
  • Figure 71: Latin America Market Volume (Units) Analysis by Type, 2020-2035
  • Figure 72: Latin America Market Value Share (%) and BPS Analysis by Type, 2025-2035
  • Figure 73: Latin America Market Y-o-Y Growth (%) Projections by Type, 2025-2035
  • Figure 74: Latin America Market Value (USD Billion) Analysis by Thickness, 2020-2035
  • Figure 75: Latin America Market Volume (Units) Analysis by Thickness, 2020-2035
  • Figure 76: Latin America Market Value Share (%) and BPS Analysis by Thickness, 2025-2035
  • Figure 77: Latin America Market Y-o-Y Growth (%) Projections by Thickness, 2025-2035
  • Figure 78: Latin America Market Value (USD Billion) Analysis by Application, 2020-2035
  • Figure 79: Latin America Market Volume (Units) Analysis by Application, 2020-2035
  • Figure 80: Latin America Market Value Share (%) and BPS Analysis by Application, 2025-2035
  • Figure 81: Latin America Market Y-o-Y Growth (%) Projections by Application, 2025-2035
  • Figure 82: Latin America Market Value (USD Billion) Analysis by End-Use Industry, 2020-2035
  • Figure 83: Latin America Market Volume (Units) Analysis by End-Use Industry, 2020-2035
  • Figure 84: Latin America Market Value Share (%) and BPS Analysis by End-Use Industry, 2025-2035
  • Figure 85: Latin America Market Y-o-Y Growth (%) Projections by End-Use Industry, 2025-2035
  • Figure 86: Latin America Market Attractiveness by Type, 2025-2035
  • Figure 87: Latin America Market Attractiveness by Thickness, 2025-2035
  • Figure 88: Latin America Market Attractiveness by Application, 2025-2035
  • Figure 89: Latin America Market Attractiveness by End-Use Industry, 2025-2035
  • Figure 90: Latin America Market Attractiveness by Country, 2025-2035
  • Figure 91: East Asia Market Value (USD Billion) by Type, 2025-2035
  • Figure 92: East Asia Market Value (USD Billion) by Thickness, 2025-2035
  • Figure 93: East Asia Market Value (USD Billion) by Application, 2025-2035
  • Figure 94: East Asia Market Value (USD Billion) by End-Use Industry, 2025-2035
  • Figure 95: East Asia Market Value (USD Billion) by Country, 2025-2035
  • Figure 96: East Asia Market Value (USD Billion) Analysis by Country, 2020-2035
  • Figure 97: East Asia Market Volume (Units) Analysis by Country, 2020-2035
  • Figure 98: East Asia Market Value Share (%) and BPS Analysis by Country, 2025-2035
  • Figure 99: East Asia Market Y-o-Y Growth (%) Projections by Country, 2025-2035
  • Figure 100: East Asia Market Value (USD Billion) Analysis by Type, 2020-2035
  • Figure 101: East Asia Market Volume (Units) Analysis by Type, 2020-2035
  • Figure 102: East Asia Market Value Share (%) and BPS Analysis by Type, 2025-2035
  • Figure 103: East Asia Market Y-o-Y Growth (%) Projections by Type, 2025-2035
  • Figure 104: East Asia Market Value (USD Billion) Analysis by Thickness, 2020-2035
  • Figure 105: East Asia Market Volume (Units) Analysis by Thickness, 2020-2035
  • Figure 106: East Asia Market Value Share (%) and BPS Analysis by Thickness, 2025-2035
  • Figure 107: East Asia Market Y-o-Y Growth (%) Projections by Thickness, 2025-2035
  • Figure 108: East Asia Market Value (USD Billion) Analysis by Application, 2020-2035
  • Figure 109: East Asia Market Volume (Units) Analysis by Application, 2020-2035
  • Figure 110: East Asia Market Value Share (%) and BPS Analysis by Application, 2025-2035
  • Figure 111: East Asia Market Y-o-Y Growth (%) Projections by Application, 2025-2035
  • Figure 112: East Asia Market Value (USD Billion) Analysis by End-Use Industry, 2020-2035
  • Figure 113: East Asia Market Volume (Units) Analysis by End-Use Industry, 2020-2035
  • Figure 114: East Asia Market Value Share (%) and BPS Analysis by End-Use Industry, 2025-2035
  • Figure 115: East Asia Market Y-o-Y Growth (%) Projections by End-Use Industry, 2025-2035
  • Figure 116: East Asia Market Attractiveness by Type, 2025-2035
  • Figure 117: East Asia Market Attractiveness by Thickness, 2025-2035
  • Figure 118: East Asia Market Attractiveness by Application, 2025-2035
  • Figure 119: East Asia Market Attractiveness by End-Use Industry, 2025-2035
  • Figure 120: East Asia Market Attractiveness by Country, 2025-2035
  • Figure 121: South Asia & Pacific Market Value (USD Billion) by Type, 2025-2035
  • Figure 122: South Asia & Pacific Market Value (USD Billion) by Thickness, 2025-2035
  • Figure 123: South Asia & Pacific Market Value (USD Billion) by Application, 2025-2035
  • Figure 124: South Asia & Pacific Market Value (USD Billion) by End-Use Industry, 2025-2035
  • Figure 125: South Asia & Pacific Market Value (USD Billion) by Country, 2025-2035
  • Figure 126: South Asia & Pacific Market Value (USD Billion) Analysis by Country, 2020-2035
  • Figure 127: South Asia & Pacific Market Volume (Units) Analysis by Country, 2020-2035
  • Figure 128: South Asia & Pacific Market Value Share (%) and BPS Analysis by Country, 2025-2035
  • Figure 129: South Asia & Pacific Market Y-o-Y Growth (%) Projections by Country, 2025-2035
  • Figure 130: South Asia & Pacific Market Value (USD Billion) Analysis by Type, 2020-2035
  • Figure 131: South Asia & Pacific Market Volume (Units) Analysis by Type, 2020-2035
  • Figure 132: South Asia & Pacific Market Value Share (%) and BPS Analysis by Type, 2025-2035
  • Figure 133: South Asia & Pacific Market Y-o-Y Growth (%) Projections by Type, 2025-2035
  • Figure 134: South Asia & Pacific Market Value (USD Billion) Analysis by Thickness, 2020-2035
  • Figure 135: South Asia & Pacific Market Volume (Units) Analysis by Thickness, 2020-2035
  • Figure 136: South Asia & Pacific Market Value Share (%) and BPS Analysis by Thickness, 2025-2035
  • Figure 137: South Asia & Pacific Market Y-o-Y Growth (%) Projections by Thickness, 2025-2035
  • Figure 138: South Asia & Pacific Market Value (USD Billion) Analysis by Application, 2020-2035
  • Figure 139: South Asia & Pacific Market Volume (Units) Analysis by Application, 2020-2035
  • Figure 140: South Asia & Pacific Market Value Share (%) and BPS Analysis by Application, 2025-2035
  • Figure 141: South Asia & Pacific Market Y-o-Y Growth (%) Projections by Application, 2025-2035
  • Figure 142: South Asia & Pacific Market Value (USD Billion) Analysis by End-Use Industry, 2020-2035
  • Figure 143: South Asia & Pacific Market Volume (Units) Analysis by End-Use Industry, 2020-2035
  • Figure 144: South Asia & Pacific Market Value Share (%) and BPS Analysis by End-Use Industry, 2025-2035
  • Figure 145: South Asia & Pacific Market Y-o-Y Growth (%) Projections by End-Use Industry, 2025-2035
  • Figure 146: South Asia & Pacific Market Attractiveness by Type, 2025-2035
  • Figure 147: South Asia & Pacific Market Attractiveness by Thickness, 2025-2035
  • Figure 148: South Asia & Pacific Market Attractiveness by Application, 2025-2035
  • Figure 149: South Asia & Pacific Market Attractiveness by End-Use Industry, 2025-2035
  • Figure 150: South Asia & Pacific Market Attractiveness by Country, 2025-2035
  • Figure 151: Western Europe Market Value (USD Billion) by Type, 2025-2035
  • Figure 152: Western Europe Market Value (USD Billion) by Thickness, 2025-2035
  • Figure 153: Western Europe Market Value (USD Billion) by Application, 2025-2035
  • Figure 154: Western Europe Market Value (USD Billion) by End-Use Industry, 2025-2035
  • Figure 155: Western Europe Market Value (USD Billion) by Country, 2025-2035
  • Figure 156: Western Europe Market Value (USD Billion) Analysis by Country, 2020-2035
  • Figure 157: Western Europe Market Volume (Units) Analysis by Country, 2020-2035
  • Figure 158: Western Europe Market Value Share (%) and BPS Analysis by Country, 2025-2035
  • Figure 159: Western Europe Market Y-o-Y Growth (%) Projections by Country, 2025-2035
  • Figure 160: Western Europe Market Value (USD Billion) Analysis by Type, 2020-2035
  • Figure 161: Western Europe Market Volume (Units) Analysis by Type, 2020-2035
  • Figure 162: Western Europe Market Value Share (%) and BPS Analysis by Type, 2025-2035
  • Figure 163: Western Europe Market Y-o-Y Growth (%) Projections by Type, 2025-2035
  • Figure 164: Western Europe Market Value (USD Billion) Analysis by Thickness, 2020-2035
  • Figure 165: Western Europe Market Volume (Units) Analysis by Thickness, 2020-2035
  • Figure 166: Western Europe Market Value Share (%) and BPS Analysis by Thickness, 2025-2035
  • Figure 167: Western Europe Market Y-o-Y Growth (%) Projections by Thickness, 2025-2035
  • Figure 168: Western Europe Market Value (USD Billion) Analysis by Application, 2020-2035
  • Figure 169: Western Europe Market Volume (Units) Analysis by Application, 2020-2035
  • Figure 170: Western Europe Market Value Share (%) and BPS Analysis by Application, 2025-2035
  • Figure 171: Western Europe Market Y-o-Y Growth (%) Projections by Application, 2025-2035
  • Figure 172: Western Europe Market Value (USD Billion) Analysis by End-Use Industry, 2020-2035
  • Figure 173: Western Europe Market Volume (Units) Analysis by End-Use Industry, 2020-2035
  • Figure 174: Western Europe Market Value Share (%) and BPS Analysis by End-Use Industry, 2025-2035
  • Figure 175: Western Europe Market Y-o-Y Growth (%) Projections by End-Use Industry, 2025-2035
  • Figure 176: Western Europe Market Attractiveness by Type, 2025-2035
  • Figure 177: Western Europe Market Attractiveness by Thickness, 2025-2035
  • Figure 178: Western Europe Market Attractiveness by Application, 2025-2035
  • Figure 179: Western Europe Market Attractiveness by End-Use Industry, 2025-2035
  • Figure 180: Western Europe Market Attractiveness by Country, 2025-2035
  • Figure 181: Eastern Europe Market Value (USD Billion) by Type, 2025-2035
  • Figure 182: Eastern Europe Market Value (USD Billion) by Thickness, 2025-2035
  • Figure 183: Eastern Europe Market Value (USD Billion) by Application, 2025-2035
  • Figure 184: Eastern Europe Market Value (USD Billion) by End-Use Industry, 2025-2035
  • Figure 185: Eastern Europe Market Value (USD Billion) by Country, 2025-2035
  • Figure 186: Eastern Europe Market Value (USD Billion) Analysis by Country, 2020-2035
  • Figure 187: Eastern Europe Market Volume (Units) Analysis by Country, 2020-2035
  • Figure 188: Eastern Europe Market Value Share (%) and BPS Analysis by Country, 2025-2035
  • Figure 189: Eastern Europe Market Y-o-Y Growth (%) Projections by Country, 2025-2035
  • Figure 190: Eastern Europe Market Value (USD Billion) Analysis by Type, 2020-2035
  • Figure 191: Eastern Europe Market Volume (Units) Analysis by Type, 2020-2035
  • Figure 192: Eastern Europe Market Value Share (%) and BPS Analysis by Type, 2025-2035
  • Figure 193: Eastern Europe Market Y-o-Y Growth (%) Projections by Type, 2025-2035
  • Figure 194: Eastern Europe Market Value (USD Billion) Analysis by Thickness, 2020-2035
  • Figure 195: Eastern Europe Market Volume (Units) Analysis by Thickness, 2020-2035
  • Figure 196: Eastern Europe Market Value Share (%) and BPS Analysis by Thickness, 2025-2035
  • Figure 197: Eastern Europe Market Y-o-Y Growth (%) Projections by Thickness, 2025-2035
  • Figure 198: Eastern Europe Market Value (USD Billion) Analysis by Application, 2020-2035
  • Figure 199: Eastern Europe Market Volume (Units) Analysis by Application, 2020-2035
  • Figure 200: Eastern Europe Market Value Share (%) and BPS Analysis by Application, 2025-2035
  • Figure 201: Eastern Europe Market Y-o-Y Growth (%) Projections by Application, 2025-2035
  • Figure 202: Eastern Europe Market Value (USD Billion) Analysis by End-Use Industry, 2020-2035
  • Figure 203: Eastern Europe Market Volume (Units) Analysis by End-Use Industry, 2020-2035
  • Figure 204: Eastern Europe Market Value Share (%) and BPS Analysis by End-Use Industry, 2025-2035
  • Figure 205: Eastern Europe Market Y-o-Y Growth (%) Projections by End-Use Industry, 2025-2035
  • Figure 206: Eastern Europe Market Attractiveness by Type, 2025-2035
  • Figure 207: Eastern Europe Market Attractiveness by Thickness, 2025-2035
  • Figure 208: Eastern Europe Market Attractiveness by Application, 2025-2035
  • Figure 209: Eastern Europe Market Attractiveness by End-Use Industry, 2025-2035
  • Figure 210: Eastern Europe Market Attractiveness by Country, 2025-2035
  • Figure 211: Middle East & Africa Market Value (USD Billion) by Type, 2025-2035
  • Figure 212: Middle East & Africa Market Value (USD Billion) by Thickness, 2025-2035
  • Figure 213: Middle East & Africa Market Value (USD Billion) by Application, 2025-2035
  • Figure 214: Middle East & Africa Market Value (USD Billion) by End-Use Industry, 2025-2035
  • Figure 215: Middle East & Africa Market Value (USD Billion) by Country, 2025-2035
  • Figure 216: Middle East & Africa Market Value (USD Billion) Analysis by Country, 2020-2035
  • Figure 217: Middle East & Africa Market Volume (Units) Analysis by Country, 2020-2035
  • Figure 218: Middle East & Africa Market Value Share (%) and BPS Analysis by Country, 2025-2035
  • Figure 219: Middle East & Africa Market Y-o-Y Growth (%) Projections by Country, 2025-2035
  • Figure 220: Middle East & Africa Market Value (USD Billion) Analysis by Type, 2020-2035
  • Figure 221: Middle East & Africa Market Volume (Units) Analysis by Type, 2020-2035
  • Figure 222: Middle East & Africa Market Value Share (%) and BPS Analysis by Type, 2025-2035
  • Figure 223: Middle East & Africa Market Y-o-Y Growth (%) Projections by Type, 2025-2035
  • Figure 224: Middle East & Africa Market Value (USD Billion) Analysis by Thickness, 2020-2035
  • Figure 225: Middle East & Africa Market Volume (Units) Analysis by Thickness, 2020-2035
  • Figure 226: Middle East & Africa Market Value Share (%) and BPS Analysis by Thickness, 2025-2035
  • Figure 227: Middle East & Africa Market Y-o-Y Growth (%) Projections by Thickness, 2025-2035
  • Figure 228: Middle East & Africa Market Value (USD Billion) Analysis by Application, 2020-2035
  • Figure 229: Middle East & Africa Market Volume (Units) Analysis by Application, 2020-2035
  • Figure 230: Middle East & Africa Market Value Share (%) and BPS Analysis by Application, 2025-2035
  • Figure 231: Middle East & Africa Market Y-o-Y Growth (%) Projections by Application, 2025-2035
  • Figure 232: Middle East & Africa Market Value (USD Billion) Analysis by End-Use Industry, 2020-2035
  • Figure 233: Middle East & Africa Market Volume (Units) Analysis by End-Use Industry, 2020-2035
  • Figure 234: Middle East & Africa Market Value Share (%) and BPS Analysis by End-Use Industry, 2025-2035
  • Figure 235: Middle East & Africa Market Y-o-Y Growth (%) Projections by End-Use Industry, 2025-2035
  • Figure 236: Middle East & Africa Market Attractiveness by Type, 2025-2035
  • Figure 237: Middle East & Africa Market Attractiveness by Thickness, 2025-2035
  • Figure 238: Middle East & Africa Market Attractiveness by Application, 2025-2035
  • Figure 239: Middle East & Africa Market Attractiveness by End-Use Industry, 2025-2035
  • Figure 240: Middle East & Africa Market Attractiveness by Country, 2025-2035

Frequently Asked Questions

How big is the chemical resistant EVA film market in 2025?

The global chemical resistant EVA film market is estimated to be valued at USD 1.7 billion in 2025.

What will be the size of the chemical resistant EVA film market in 2035?

The market size for the chemical resistant EVA film market is projected to reach USD 2.9 billion by 2035.

How much will be the chemical resistant EVA film market growth between 2025 and 2035?

The chemical resistant EVA film market is expected to grow at a CAGR of 5.5% between 2025 and 2035.

What are the key types in the chemical resistant EVA film market?

The key types in the chemical resistant EVA film market include standard EVA films, cross-linked EVA films, and modified EVA films.

Which type segment is expected to contribute significant share in the chemical resistant EVA film market in 2025?

The cross-linked EVA films segment is expected to account for the highest share of 44.2% in the chemical resistant EVA film market in 2025.

Explore Similar Insights

Future Market Insights

Chemical Resistant EVA Film Market