Chemical Indicator Inks Market Size and Share Forecast Outlook 2025 to 2035

The Chemical Indicator Inks Market is estimated to be valued at USD 84.8 billion in 2025 and is projected to reach USD 174.8 billion by 2035, registering a compound annual growth rate (CAGR) of 7.5% over the forecast period.
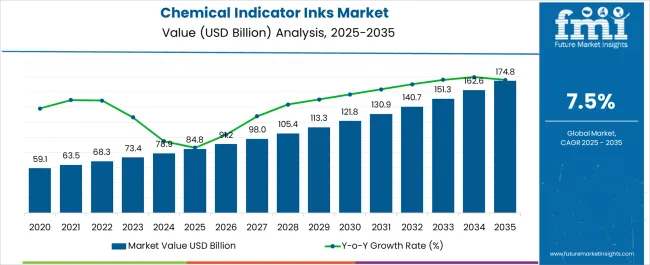
Quick Stats for Chemical Indicator Inks Market

  • Chemical Indicator Inks Market Value (2025): USD 84.8 billion
  • Chemical Indicator Inks Market Forecast Value (2035): USD 174.8 billion
  • Chemical Indicator Inks Market Forecast CAGR: 7.5%
  • Leading Segment in Chemical Indicator Inks Market in 2025: Steam (35.8%)
  • Key Growth Regions in Chemical Indicator Inks Market: North America, Asia-Pacific, Europe
  • Top Key Players in Chemical Indicator Inks Market: North American Science Associates Inc. (NAMSA), Riken Chemical Co Ltd., 3M, Tempil (LA-Co Industries), NiGK Corporation, SteriTec Products Inc., Propper Manufacturing Company, Inc., ETIGAM BV, Terragene SA, GKE GmbH, STERIS Corporation

Chemical Indicator Inks Market Market Value Analysis

Chemical Indicator Inks Market Key Takeaways

Metric Value
Chemical Indicator Inks Market Estimated Value in (2025 E) USD 84.8 billion
Chemical Indicator Inks Market Forecast Value in (2035 F) USD 174.8 billion
Forecast CAGR (2025 to 2035) 7.5%

Why is the Chemical Indicator Inks Market Growing?

The Chemical Indicator Inks market is witnessing steady growth due to rising global demand for sterilization monitoring solutions in healthcare, food packaging, and pharmaceutical sectors. As sterilization processes become more advanced and compliance-driven, the role of indicator inks in ensuring safety, reliability, and quality assurance has become indispensable. Chemical indicator inks are widely used on packaging materials, tapes, and labels to provide visual confirmation of sterilization, enhancing patient safety and regulatory adherence.

Increasing demand from hospitals and pharmaceutical manufacturers is creating new opportunities, particularly with the rising focus on infection prevention and sterile packaging. Technological advancements, such as improved ink formulations with greater sensitivity, durability, and compatibility across sterilization methods, are strengthening adoption. Stringent global regulatory standards and rising emphasis on product safety across supply chains further fuel market expansion.

Additionally, growing usage of single-use medical devices and expanding healthcare infrastructure in emerging economies contribute to rising consumption As sterilization standards tighten and end-user industries pursue robust quality assurance practices, the Chemical Indicator Inks market is projected to sustain significant long-term growth.

Segmental Analysis

The chemical indicator inks market is segmented by sterilization process, product type, printing process, application type, and geographic regions. By sterilization process, chemical indicator inks market is divided into Steam, Ethylene Oxide, Vaporized Hydrogen Peroxide And Plasma, Formaldehyde, and Others. In terms of product type, chemical indicator inks market is classified into Solvent-Based, Water-Based, and UV-Cured. Based on printing process, chemical indicator inks market is segmented into Flexographic Printing, Rotogravure Printing, and Screen Printing. By application type, chemical indicator inks market is segmented into Sterilizing Bags, Bottles, Pre-Fillable Syringes, IV & Blood Containers, Pouches, Thermoformed Trays, Tags And Labels, and Others (Such As Blister Packs). Regionally, the chemical indicator inks industry is classified into North America, Latin America, Western Europe, Eastern Europe, Balkan & Baltic Countries, Russia & Belarus, Central Asia, East Asia, South Asia & Pacific, and the Middle East & Africa.
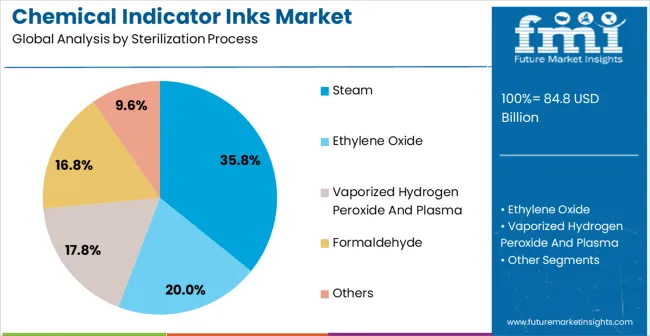
Insights into the Steam Sterilization Process Segment

Chemical Indicator Inks Market Analysis By Sterilization Process

The steam sterilization process segment is expected to account for 35.8% of the Chemical Indicator Inks market revenue in 2025, positioning it as the leading sterilization process type. Its dominance stems from the high adoption of steam sterilization across hospitals, laboratories, and pharmaceutical facilities, where it is recognized as one of the most reliable and cost-effective methods for ensuring sterilization.

Chemical indicator inks used in steam sterilization applications provide clear visual confirmation that adequate conditions of temperature and exposure have been achieved, thereby supporting strict compliance with global sterilization standards. The process is preferred due to its ability to penetrate wrapped instruments and packaging materials, making it ideal for medical device sterilization.

Continuous innovation in ink formulations to improve visibility, resistance, and accuracy under high-moisture conditions has further reinforced market adoption Growing demand for sterilization monitoring in healthcare settings, combined with the effectiveness and widespread availability of steam sterilization systems, is expected to sustain the strong position of this segment in the coming years.
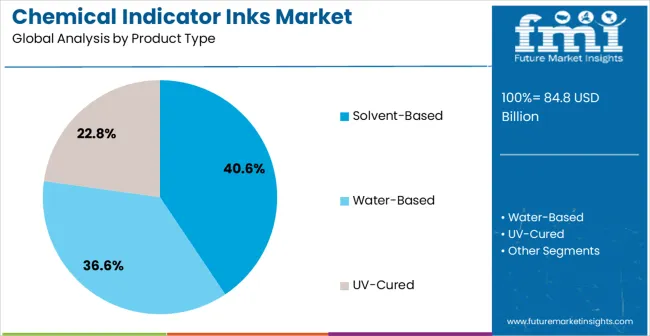
Insights into the Solvent-Based Product Type Segment

Chemical Indicator Inks Market Analysis By Product Type

The solvent-based product type segment is projected to hold 40.6% of the market revenue in 2025, making it the leading product category. This leadership is being driven by the superior stability, durability, and performance characteristics of solvent-based inks, which ensure consistent results across a wide range of sterilization processes. These inks are valued for their excellent adhesion to various packaging substrates, including plastics, papers, and foils, which enhances their versatility in medical and pharmaceutical applications.

Solvent-based formulations offer strong resistance to fading and maintain integrity under extreme conditions of heat, moisture, and pressure, ensuring reliable visibility of sterilization indicators. Their widespread availability and cost-effectiveness also make them highly preferred by healthcare and packaging industries.

Ongoing advancements in eco-friendly solvent-based formulations that minimize volatile organic compound emissions are further shaping market preferences As the need for durable, high-performance indicator inks continues to grow across critical end-use sectors, the solvent-based segment is anticipated to maintain its dominance in the global Chemical Indicator Inks market.
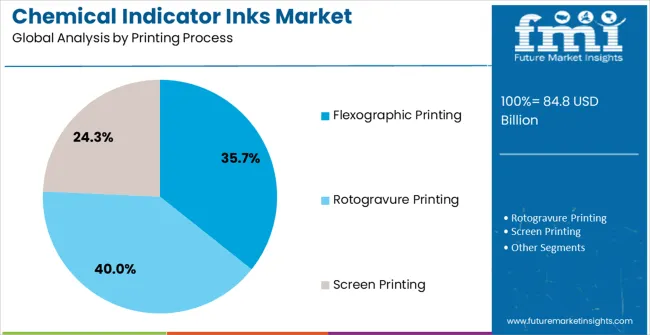
Insights into the Flexographic Printing Process Segment

Chemical Indicator Inks Market Analysis By Printing Process

The flexographic printing process segment is anticipated to capture 35.7% of the market revenue in 2025, positioning it as the leading printing process for chemical indicator inks. This dominance is largely attributed to the cost-effectiveness, high-speed production, and adaptability of flexographic printing, which make it highly suitable for large-scale packaging and labeling applications in the medical and pharmaceutical sectors. The process supports a wide variety of substrates, including films, paper, and foils, which are commonly used in sterilization packaging.

Chemical indicator inks applied via flexographic printing demonstrate excellent clarity, precision, and consistency, ensuring that visual indicators remain reliable throughout sterilization cycles. Additionally, the ability to accommodate both water-based and solvent-based inks enhances flexibility for manufacturers, enabling customized solutions.

Technological advancements in flexographic printing equipment, such as improved plate technology and automated systems, are further enhancing efficiency and print quality With rising demand for mass production of sterile medical packaging and labeling, flexographic printing is expected to remain the most widely adopted process, reinforcing its leadership position in the market.

Market Overview

Chemical Indicator Inks Market Overview

Chemical indicator inks are used for monitoring sterilization process, and form a key component of chemical indicators. They are of the type that change colour in order to indicate successful sterilization of surgical equipment/accessory. When exposed to a specific type of sterilant, at pre-defined temperature conditions, they experience a permanent colour change.

One of the most vital processes carried out in the healthcare industry is the sterilization process. It directly influences safety of the patient as apt sterilization of surgical instruments, equipment and supplies are applied in direct patient care and surgery.

Chemical indicators happen to be primary products that are used to confirm effectiveness of the sterilization process. This not only ensures the effective sterilization of surgical instruments and devices, but also helps assess the level of sterilization achieved.

The chemical indicator inks market is also expected to be driven by the application of chemical indicator inks in the growing food canning industry, where meat, fish and other perishable food items are processed. All these factors make the study of the chemical indicator inks market a vital need.
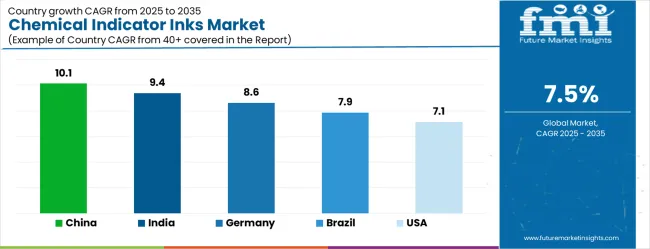
Analysis of Chemical Indicator Inks Market By Key Countries

Chemical Indicator Inks Market Cagr Analysis By Country

Country CAGR
China 10.1%
India 9.4%
Germany 8.6%
Brazil 7.9%
USA 7.1%
UK 6.4%
Japan 5.6%

Country-wise Analysis

The Chemical Indicator Inks Market is expected to register a CAGR of 7.5% during the forecast period, exhibiting varied country level momentum. China leads with the highest CAGR of 10.1%, followed by India at 9.4%. Developed markets such as Germany, France, and the UK continue to expand steadily, while the USA is likely to grow at consistent rates. Japan posts the lowest CAGR at 5.6%, yet still underscores a broadly positive trajectory for the global Chemical Indicator Inks Market. In 2024, Germany held a dominant revenue in the Western Europe market and is expected to grow with a CAGR of 8.6%. The USA Chemical Indicator Inks Market is estimated to be valued at USD 30.4 billion in 2025 and is anticipated to reach a valuation of USD 30.4 billion by 2035. Sales are projected to rise at a CAGR of 0.0% over the forecast period between 2025 and 2035. While Japan and South Korea markets are estimated to be valued at USD 4.0 billion and USD 2.5 billion respectively in 2025.
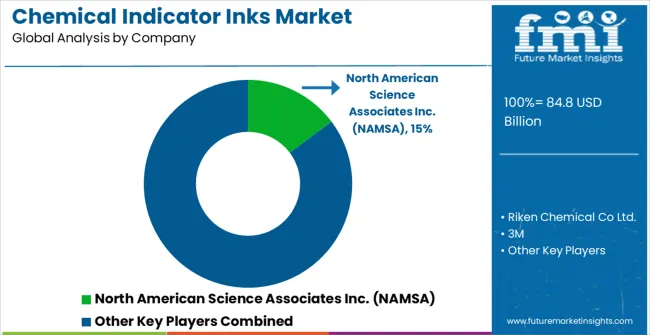
Key Players in the Chemical Indicator Inks Market

Chemical Indicator Inks Market Analysis By Company

  • North American Science Associates Inc. (NAMSA)
  • Riken Chemical Co Ltd.
  • 3M
  • Tempil (LA-Co Industries)
  • NiGK Corporation
  • SteriTec Products Inc.
  • Propper Manufacturing Company, Inc.
  • ETIGAM BV
  • Terragene SA
  • GKE GmbH
  • STERIS Corporation

Scope of the Report

Item Value
Quantitative Units USD 84.8 Billion
Sterilization Process Steam, Ethylene Oxide, Vaporized Hydrogen Peroxide And Plasma, Formaldehyde, and Others
Product Type Solvent-Based, Water-Based, and UV-Cured
Printing Process Flexographic Printing, Rotogravure Printing, and Screen Printing
Application Type Sterilizing Bags, Bottles, Pre-Fillable Syringes, IV & Blood Containers, Pouches, Thermoformed Trays, Tags And Labels, and Others (Such As Blister Packs)
Regions Covered North America, Europe, Asia-Pacific, Latin America, Middle East & Africa
Country Covered United States, Canada, Germany, France, United Kingdom, China, Japan, India, Brazil, South Africa
Key Companies Profiled North American Science Associates Inc. (NAMSA), Riken Chemical Co Ltd., 3M, Tempil (LA-Co Industries), NiGK Corporation, SteriTec Products Inc., Propper Manufacturing Company, Inc., ETIGAM BV, Terragene SA, GKE GmbH, and STERIS Corporation

Chemical Indicator Inks Market by Segments

Sterilization Process:

  • Steam
  • Ethylene Oxide
  • Vaporized Hydrogen Peroxide And Plasma
  • Formaldehyde
  • Others

Product Type:

  • Solvent-Based
  • Water-Based
  • UV-Cured

Printing Process:

  • Flexographic Printing
  • Rotogravure Printing
  • Screen Printing

Application Type:

  • Sterilizing Bags
  • Bottles
  • Pre-Fillable Syringes
  • IV & Blood Containers
  • Pouches
  • Thermoformed Trays
  • Tags And Labels
  • Others (Such As Blister Packs)

Region:

  • North America
    • USA
    • Canada
    • Mexico
  • Latin America
    • Brazil
    • Chile
    • Rest of Latin America
  • Western Europe
    • Germany
    • UK
    • Italy
    • Spain
    • France
    • Nordic
    • BENELUX
    • Rest of Western Europe
  • Eastern Europe
    • Russia
    • Poland
    • Hungary
    • Balkan & Baltic
    • Rest of Eastern Europe
  • East Asia
    • China
    • Japan
    • South Korea
  • South Asia and Pacific
    • India
    • ASEAN
    • Australia & New Zealand
    • Rest of South Asia and Pacific
  • Middle East & Africa
    • Kingdom of Saudi Arabia
    • Other GCC Countries
    • Turkiye
    • South Africa
    • Other African Union
    • Rest of Middle East & Africa

Table of Content

  1. Executive Summary
    • Global Market Outlook
    • Demand-side Trends
    • Supply-side Trends
    • Technology Roadmap Analysis
    • Analysis and Recommendations
  2. Market Overview
    • Market Coverage / Taxonomy
    • Market Definition / Scope / Limitations
  3. Market Background
    • Market Dynamics
      • Drivers
      • Restraints
      • Opportunity
      • Trends
    • Scenario Forecast
      • Demand in Optimistic Scenario
      • Demand in Likely Scenario
      • Demand in Conservative Scenario
    • Opportunity Map Analysis
    • Product Life Cycle Analysis
    • Supply Chain Analysis
    • Investment Feasibility Matrix
    • Value Chain Analysis
    • PESTLE and Porter’s Analysis
    • Regulatory Landscape
    • Regional Parent Market Outlook
    • Production and Consumption Statistics
    • Import and Export Statistics
  4. Global Market Analysis 2020 to 2024 and Forecast, 2025 to 2035
    • Historical Market Size Value (USD Million) Analysis, 2020 to 2024
    • Current and Future Market Size Value (USD Million) Projections, 2025 to 2035
      • Y-o-Y Growth Trend Analysis
      • Absolute $ Opportunity Analysis
  5. Global Market Pricing Analysis 2020 to 2024 and Forecast 2025 to 2035
  6. Global Market Analysis 2020 to 2024 and Forecast 2025 to 2035, By Sterilization Process
    • Introduction / Key Findings
    • Historical Market Size Value (USD Million) Analysis By Sterilization Process , 2020 to 2024
    • Current and Future Market Size Value (USD Million) Analysis and Forecast By Sterilization Process , 2025 to 2035
      • Steam
      • Ethylene Oxide
      • Vaporized Hydrogen Peroxide And Plasma
      • Formaldehyde
      • Others
    • Y-o-Y Growth Trend Analysis By Sterilization Process , 2020 to 2024
    • Absolute $ Opportunity Analysis By Sterilization Process , 2025 to 2035
  7. Global Market Analysis 2020 to 2024 and Forecast 2025 to 2035, By Product Type
    • Introduction / Key Findings
    • Historical Market Size Value (USD Million) Analysis By Product Type, 2020 to 2024
    • Current and Future Market Size Value (USD Million) Analysis and Forecast By Product Type, 2025 to 2035
      • Solvent-Based
      • Water-Based
      • UV-Cured
    • Y-o-Y Growth Trend Analysis By Product Type, 2020 to 2024
    • Absolute $ Opportunity Analysis By Product Type, 2025 to 2035
  8. Global Market Analysis 2020 to 2024 and Forecast 2025 to 2035, By Printing Process
    • Introduction / Key Findings
    • Historical Market Size Value (USD Million) Analysis By Printing Process, 2020 to 2024
    • Current and Future Market Size Value (USD Million) Analysis and Forecast By Printing Process, 2025 to 2035
      • Flexographic Printing
      • Rotogravure Printing
      • Screen Printing
    • Y-o-Y Growth Trend Analysis By Printing Process, 2020 to 2024
    • Absolute $ Opportunity Analysis By Printing Process, 2025 to 2035
  9. Global Market Analysis 2020 to 2024 and Forecast 2025 to 2035, By Application Type
    • Introduction / Key Findings
    • Historical Market Size Value (USD Million) Analysis By Application Type, 2020 to 2024
    • Current and Future Market Size Value (USD Million) Analysis and Forecast By Application Type, 2025 to 2035
      • Sterilizing Bags
      • Bottles
      • Pre-Fillable Syringes
      • IV & Blood Containers
      • Pouches
      • Thermoformed Trays
      • Tags And Labels
      • Others (Such As Blister Packs)
    • Y-o-Y Growth Trend Analysis By Application Type, 2020 to 2024
    • Absolute $ Opportunity Analysis By Application Type, 2025 to 2035
  10. Global Market Analysis 2020 to 2024 and Forecast 2025 to 2035, By Region
    • Introduction
    • Historical Market Size Value (USD Million) Analysis By Region, 2020 to 2024
    • Current Market Size Value (USD Million) Analysis and Forecast By Region, 2025 to 2035
      • North America
      • Latin America
      • Western Europe
      • Eastern Europe
      • East Asia
      • South Asia and Pacific
      • Middle East & Africa
    • Market Attractiveness Analysis By Region
  11. North America Market Analysis 2020 to 2024 and Forecast 2025 to 2035, By Country
    • Historical Market Size Value (USD Million) Trend Analysis By Market Taxonomy, 2020 to 2024
    • Market Size Value (USD Million) Forecast By Market Taxonomy, 2025 to 2035
      • By Country
        • USA
        • Canada
        • Mexico
      • By Sterilization Process
      • By Product Type
      • By Printing Process
      • By Application Type
    • Market Attractiveness Analysis
      • By Country
      • By Sterilization Process
      • By Product Type
      • By Printing Process
      • By Application Type
    • Key Takeaways
  12. Latin America Market Analysis 2020 to 2024 and Forecast 2025 to 2035, By Country
    • Historical Market Size Value (USD Million) Trend Analysis By Market Taxonomy, 2020 to 2024
    • Market Size Value (USD Million) Forecast By Market Taxonomy, 2025 to 2035
      • By Country
        • Brazil
        • Chile
        • Rest of Latin America
      • By Sterilization Process
      • By Product Type
      • By Printing Process
      • By Application Type
    • Market Attractiveness Analysis
      • By Country
      • By Sterilization Process
      • By Product Type
      • By Printing Process
      • By Application Type
    • Key Takeaways
  13. Western Europe Market Analysis 2020 to 2024 and Forecast 2025 to 2035, By Country
    • Historical Market Size Value (USD Million) Trend Analysis By Market Taxonomy, 2020 to 2024
    • Market Size Value (USD Million) Forecast By Market Taxonomy, 2025 to 2035
      • By Country
        • Germany
        • UK
        • Italy
        • Spain
        • France
        • Nordic
        • BENELUX
        • Rest of Western Europe
      • By Sterilization Process
      • By Product Type
      • By Printing Process
      • By Application Type
    • Market Attractiveness Analysis
      • By Country
      • By Sterilization Process
      • By Product Type
      • By Printing Process
      • By Application Type
    • Key Takeaways
  14. Eastern Europe Market Analysis 2020 to 2024 and Forecast 2025 to 2035, By Country
    • Historical Market Size Value (USD Million) Trend Analysis By Market Taxonomy, 2020 to 2024
    • Market Size Value (USD Million) Forecast By Market Taxonomy, 2025 to 2035
      • By Country
        • Russia
        • Poland
        • Hungary
        • Balkan & Baltic
        • Rest of Eastern Europe
      • By Sterilization Process
      • By Product Type
      • By Printing Process
      • By Application Type
    • Market Attractiveness Analysis
      • By Country
      • By Sterilization Process
      • By Product Type
      • By Printing Process
      • By Application Type
    • Key Takeaways
  15. East Asia Market Analysis 2020 to 2024 and Forecast 2025 to 2035, By Country
    • Historical Market Size Value (USD Million) Trend Analysis By Market Taxonomy, 2020 to 2024
    • Market Size Value (USD Million) Forecast By Market Taxonomy, 2025 to 2035
      • By Country
        • China
        • Japan
        • South Korea
      • By Sterilization Process
      • By Product Type
      • By Printing Process
      • By Application Type
    • Market Attractiveness Analysis
      • By Country
      • By Sterilization Process
      • By Product Type
      • By Printing Process
      • By Application Type
    • Key Takeaways
  16. South Asia and Pacific Market Analysis 2020 to 2024 and Forecast 2025 to 2035, By Country
    • Historical Market Size Value (USD Million) Trend Analysis By Market Taxonomy, 2020 to 2024
    • Market Size Value (USD Million) Forecast By Market Taxonomy, 2025 to 2035
      • By Country
        • India
        • ASEAN
        • Australia & New Zealand
        • Rest of South Asia and Pacific
      • By Sterilization Process
      • By Product Type
      • By Printing Process
      • By Application Type
    • Market Attractiveness Analysis
      • By Country
      • By Sterilization Process
      • By Product Type
      • By Printing Process
      • By Application Type
    • Key Takeaways
  17. Middle East & Africa Market Analysis 2020 to 2024 and Forecast 2025 to 2035, By Country
    • Historical Market Size Value (USD Million) Trend Analysis By Market Taxonomy, 2020 to 2024
    • Market Size Value (USD Million) Forecast By Market Taxonomy, 2025 to 2035
      • By Country
        • Kingdom of Saudi Arabia
        • Other GCC Countries
        • Turkiye
        • South Africa
        • Other African Union
        • Rest of Middle East & Africa
      • By Sterilization Process
      • By Product Type
      • By Printing Process
      • By Application Type
    • Market Attractiveness Analysis
      • By Country
      • By Sterilization Process
      • By Product Type
      • By Printing Process
      • By Application Type
    • Key Takeaways
  18. Key Countries Market Analysis
    • USA
      • Pricing Analysis
      • Market Share Analysis, 2024
        • By Sterilization Process
        • By Product Type
        • By Printing Process
        • By Application Type
    • Canada
      • Pricing Analysis
      • Market Share Analysis, 2024
        • By Sterilization Process
        • By Product Type
        • By Printing Process
        • By Application Type
    • Mexico
      • Pricing Analysis
      • Market Share Analysis, 2024
        • By Sterilization Process
        • By Product Type
        • By Printing Process
        • By Application Type
    • Brazil
      • Pricing Analysis
      • Market Share Analysis, 2024
        • By Sterilization Process
        • By Product Type
        • By Printing Process
        • By Application Type
    • Chile
      • Pricing Analysis
      • Market Share Analysis, 2024
        • By Sterilization Process
        • By Product Type
        • By Printing Process
        • By Application Type
    • Germany
      • Pricing Analysis
      • Market Share Analysis, 2024
        • By Sterilization Process
        • By Product Type
        • By Printing Process
        • By Application Type
    • UK
      • Pricing Analysis
      • Market Share Analysis, 2024
        • By Sterilization Process
        • By Product Type
        • By Printing Process
        • By Application Type
    • Italy
      • Pricing Analysis
      • Market Share Analysis, 2024
        • By Sterilization Process
        • By Product Type
        • By Printing Process
        • By Application Type
    • Spain
      • Pricing Analysis
      • Market Share Analysis, 2024
        • By Sterilization Process
        • By Product Type
        • By Printing Process
        • By Application Type
    • France
      • Pricing Analysis
      • Market Share Analysis, 2024
        • By Sterilization Process
        • By Product Type
        • By Printing Process
        • By Application Type
    • India
      • Pricing Analysis
      • Market Share Analysis, 2024
        • By Sterilization Process
        • By Product Type
        • By Printing Process
        • By Application Type
    • ASEAN
      • Pricing Analysis
      • Market Share Analysis, 2024
        • By Sterilization Process
        • By Product Type
        • By Printing Process
        • By Application Type
    • Australia & New Zealand
      • Pricing Analysis
      • Market Share Analysis, 2024
        • By Sterilization Process
        • By Product Type
        • By Printing Process
        • By Application Type
    • China
      • Pricing Analysis
      • Market Share Analysis, 2024
        • By Sterilization Process
        • By Product Type
        • By Printing Process
        • By Application Type
    • Japan
      • Pricing Analysis
      • Market Share Analysis, 2024
        • By Sterilization Process
        • By Product Type
        • By Printing Process
        • By Application Type
    • South Korea
      • Pricing Analysis
      • Market Share Analysis, 2024
        • By Sterilization Process
        • By Product Type
        • By Printing Process
        • By Application Type
    • Russia
      • Pricing Analysis
      • Market Share Analysis, 2024
        • By Sterilization Process
        • By Product Type
        • By Printing Process
        • By Application Type
    • Poland
      • Pricing Analysis
      • Market Share Analysis, 2024
        • By Sterilization Process
        • By Product Type
        • By Printing Process
        • By Application Type
    • Hungary
      • Pricing Analysis
      • Market Share Analysis, 2024
        • By Sterilization Process
        • By Product Type
        • By Printing Process
        • By Application Type
    • Kingdom of Saudi Arabia
      • Pricing Analysis
      • Market Share Analysis, 2024
        • By Sterilization Process
        • By Product Type
        • By Printing Process
        • By Application Type
    • Turkiye
      • Pricing Analysis
      • Market Share Analysis, 2024
        • By Sterilization Process
        • By Product Type
        • By Printing Process
        • By Application Type
    • South Africa
      • Pricing Analysis
      • Market Share Analysis, 2024
        • By Sterilization Process
        • By Product Type
        • By Printing Process
        • By Application Type
  19. Market Structure Analysis
    • Competition Dashboard
    • Competition Benchmarking
    • Market Share Analysis of Top Players
      • By Regional
      • By Sterilization Process
      • By Product Type
      • By Printing Process
      • By Application Type
  20. Competition Analysis
    • Competition Deep Dive
      • North American Science Associates Inc. (NAMSA)
        • Overview
        • Product Portfolio
        • Profitability by Market Segments (Product/Age /Sales Channel/Region)
        • Sales Footprint
        • Strategy Overview
          • Marketing Strategy
          • Product Strategy
          • Channel Strategy
      • Riken Chemical Co Ltd.
      • 3M
      • Tempil (LA-Co Industries)
      • NiGK Corporation
      • SteriTec Products Inc.
      • Propper Manufacturing Company, Inc.
      • ETIGAM BV
      • Terragene SA
      • GKE GmbH
      • STERIS Corporation
  21. Assumptions & Acronyms Used
  22. Research Methodology

List of Tables

  • Table 1: Global Market Value (USD Million) Forecast by Region, 2020 to 2035
  • Table 2: Global Market Value (USD Million) Forecast by Sterilization Process , 2020 to 2035
  • Table 3: Global Market Value (USD Million) Forecast by Product Type, 2020 to 2035
  • Table 4: Global Market Value (USD Million) Forecast by Printing Process, 2020 to 2035
  • Table 5: Global Market Value (USD Million) Forecast by Application Type, 2020 to 2035
  • Table 6: North America Market Value (USD Million) Forecast by Country, 2020 to 2035
  • Table 7: North America Market Value (USD Million) Forecast by Sterilization Process , 2020 to 2035
  • Table 8: North America Market Value (USD Million) Forecast by Product Type, 2020 to 2035
  • Table 9: North America Market Value (USD Million) Forecast by Printing Process, 2020 to 2035
  • Table 10: North America Market Value (USD Million) Forecast by Application Type, 2020 to 2035
  • Table 11: Latin America Market Value (USD Million) Forecast by Country, 2020 to 2035
  • Table 12: Latin America Market Value (USD Million) Forecast by Sterilization Process , 2020 to 2035
  • Table 13: Latin America Market Value (USD Million) Forecast by Product Type, 2020 to 2035
  • Table 14: Latin America Market Value (USD Million) Forecast by Printing Process, 2020 to 2035
  • Table 15: Latin America Market Value (USD Million) Forecast by Application Type, 2020 to 2035
  • Table 16: Western Europe Market Value (USD Million) Forecast by Country, 2020 to 2035
  • Table 17: Western Europe Market Value (USD Million) Forecast by Sterilization Process , 2020 to 2035
  • Table 18: Western Europe Market Value (USD Million) Forecast by Product Type, 2020 to 2035
  • Table 19: Western Europe Market Value (USD Million) Forecast by Printing Process, 2020 to 2035
  • Table 20: Western Europe Market Value (USD Million) Forecast by Application Type, 2020 to 2035
  • Table 21: Eastern Europe Market Value (USD Million) Forecast by Country, 2020 to 2035
  • Table 22: Eastern Europe Market Value (USD Million) Forecast by Sterilization Process , 2020 to 2035
  • Table 23: Eastern Europe Market Value (USD Million) Forecast by Product Type, 2020 to 2035
  • Table 24: Eastern Europe Market Value (USD Million) Forecast by Printing Process, 2020 to 2035
  • Table 25: Eastern Europe Market Value (USD Million) Forecast by Application Type, 2020 to 2035
  • Table 26: East Asia Market Value (USD Million) Forecast by Country, 2020 to 2035
  • Table 27: East Asia Market Value (USD Million) Forecast by Sterilization Process , 2020 to 2035
  • Table 28: East Asia Market Value (USD Million) Forecast by Product Type, 2020 to 2035
  • Table 29: East Asia Market Value (USD Million) Forecast by Printing Process, 2020 to 2035
  • Table 30: East Asia Market Value (USD Million) Forecast by Application Type, 2020 to 2035
  • Table 31: South Asia and Pacific Market Value (USD Million) Forecast by Country, 2020 to 2035
  • Table 32: South Asia and Pacific Market Value (USD Million) Forecast by Sterilization Process , 2020 to 2035
  • Table 33: South Asia and Pacific Market Value (USD Million) Forecast by Product Type, 2020 to 2035
  • Table 34: South Asia and Pacific Market Value (USD Million) Forecast by Printing Process, 2020 to 2035
  • Table 35: South Asia and Pacific Market Value (USD Million) Forecast by Application Type, 2020 to 2035
  • Table 36: Middle East & Africa Market Value (USD Million) Forecast by Country, 2020 to 2035
  • Table 37: Middle East & Africa Market Value (USD Million) Forecast by Sterilization Process , 2020 to 2035
  • Table 38: Middle East & Africa Market Value (USD Million) Forecast by Product Type, 2020 to 2035
  • Table 39: Middle East & Africa Market Value (USD Million) Forecast by Printing Process, 2020 to 2035
  • Table 40: Middle East & Africa Market Value (USD Million) Forecast by Application Type, 2020 to 2035

List of Figures

  • Figure 1: Global Market Pricing Analysis
  • Figure 2: Global Market Value (USD Million) Forecast 2020 to 2035
  • Figure 3: Global Market Value Share and BPS Analysis by Sterilization Process , 2025 and 2035
  • Figure 4: Global Market Y-o-Y Growth Comparison by Sterilization Process , 2025 to 2035
  • Figure 5: Global Market Attractiveness Analysis by Sterilization Process
  • Figure 6: Global Market Value Share and BPS Analysis by Product Type, 2025 and 2035
  • Figure 7: Global Market Y-o-Y Growth Comparison by Product Type, 2025 to 2035
  • Figure 8: Global Market Attractiveness Analysis by Product Type
  • Figure 9: Global Market Value Share and BPS Analysis by Printing Process, 2025 and 2035
  • Figure 10: Global Market Y-o-Y Growth Comparison by Printing Process, 2025 to 2035
  • Figure 11: Global Market Attractiveness Analysis by Printing Process
  • Figure 12: Global Market Value Share and BPS Analysis by Application Type, 2025 and 2035
  • Figure 13: Global Market Y-o-Y Growth Comparison by Application Type, 2025 to 2035
  • Figure 14: Global Market Attractiveness Analysis by Application Type
  • Figure 15: Global Market Value (USD Million) Share and BPS Analysis by Region, 2025 and 2035
  • Figure 16: Global Market Y-o-Y Growth Comparison by Region, 2025 to 2035
  • Figure 17: Global Market Attractiveness Analysis by Region
  • Figure 18: North America Market Incremental Dollar Opportunity, 2025 to 2035
  • Figure 19: Latin America Market Incremental Dollar Opportunity, 2025 to 2035
  • Figure 20: Western Europe Market Incremental Dollar Opportunity, 2025 to 2035
  • Figure 21: Eastern Europe Market Incremental Dollar Opportunity, 2025 to 2035
  • Figure 22: East Asia Market Incremental Dollar Opportunity, 2025 to 2035
  • Figure 23: South Asia and Pacific Market Incremental Dollar Opportunity, 2025 to 2035
  • Figure 24: Middle East & Africa Market Incremental Dollar Opportunity, 2025 to 2035
  • Figure 25: North America Market Value Share and BPS Analysis by Country, 2025 and 2035
  • Figure 26: North America Market Value Share and BPS Analysis by Sterilization Process , 2025 and 2035
  • Figure 27: North America Market Y-o-Y Growth Comparison by Sterilization Process , 2025 to 2035
  • Figure 28: North America Market Attractiveness Analysis by Sterilization Process
  • Figure 29: North America Market Value Share and BPS Analysis by Product Type, 2025 and 2035
  • Figure 30: North America Market Y-o-Y Growth Comparison by Product Type, 2025 to 2035
  • Figure 31: North America Market Attractiveness Analysis by Product Type
  • Figure 32: North America Market Value Share and BPS Analysis by Printing Process, 2025 and 2035
  • Figure 33: North America Market Y-o-Y Growth Comparison by Printing Process, 2025 to 2035
  • Figure 34: North America Market Attractiveness Analysis by Printing Process
  • Figure 35: North America Market Value Share and BPS Analysis by Application Type, 2025 and 2035
  • Figure 36: North America Market Y-o-Y Growth Comparison by Application Type, 2025 to 2035
  • Figure 37: North America Market Attractiveness Analysis by Application Type
  • Figure 38: Latin America Market Value Share and BPS Analysis by Country, 2025 and 2035
  • Figure 39: Latin America Market Value Share and BPS Analysis by Sterilization Process , 2025 and 2035
  • Figure 40: Latin America Market Y-o-Y Growth Comparison by Sterilization Process , 2025 to 2035
  • Figure 41: Latin America Market Attractiveness Analysis by Sterilization Process
  • Figure 42: Latin America Market Value Share and BPS Analysis by Product Type, 2025 and 2035
  • Figure 43: Latin America Market Y-o-Y Growth Comparison by Product Type, 2025 to 2035
  • Figure 44: Latin America Market Attractiveness Analysis by Product Type
  • Figure 45: Latin America Market Value Share and BPS Analysis by Printing Process, 2025 and 2035
  • Figure 46: Latin America Market Y-o-Y Growth Comparison by Printing Process, 2025 to 2035
  • Figure 47: Latin America Market Attractiveness Analysis by Printing Process
  • Figure 48: Latin America Market Value Share and BPS Analysis by Application Type, 2025 and 2035
  • Figure 49: Latin America Market Y-o-Y Growth Comparison by Application Type, 2025 to 2035
  • Figure 50: Latin America Market Attractiveness Analysis by Application Type
  • Figure 51: Western Europe Market Value Share and BPS Analysis by Country, 2025 and 2035
  • Figure 52: Western Europe Market Value Share and BPS Analysis by Sterilization Process , 2025 and 2035
  • Figure 53: Western Europe Market Y-o-Y Growth Comparison by Sterilization Process , 2025 to 2035
  • Figure 54: Western Europe Market Attractiveness Analysis by Sterilization Process
  • Figure 55: Western Europe Market Value Share and BPS Analysis by Product Type, 2025 and 2035
  • Figure 56: Western Europe Market Y-o-Y Growth Comparison by Product Type, 2025 to 2035
  • Figure 57: Western Europe Market Attractiveness Analysis by Product Type
  • Figure 58: Western Europe Market Value Share and BPS Analysis by Printing Process, 2025 and 2035
  • Figure 59: Western Europe Market Y-o-Y Growth Comparison by Printing Process, 2025 to 2035
  • Figure 60: Western Europe Market Attractiveness Analysis by Printing Process
  • Figure 61: Western Europe Market Value Share and BPS Analysis by Application Type, 2025 and 2035
  • Figure 62: Western Europe Market Y-o-Y Growth Comparison by Application Type, 2025 to 2035
  • Figure 63: Western Europe Market Attractiveness Analysis by Application Type
  • Figure 64: Eastern Europe Market Value Share and BPS Analysis by Country, 2025 and 2035
  • Figure 65: Eastern Europe Market Value Share and BPS Analysis by Sterilization Process , 2025 and 2035
  • Figure 66: Eastern Europe Market Y-o-Y Growth Comparison by Sterilization Process , 2025 to 2035
  • Figure 67: Eastern Europe Market Attractiveness Analysis by Sterilization Process
  • Figure 68: Eastern Europe Market Value Share and BPS Analysis by Product Type, 2025 and 2035
  • Figure 69: Eastern Europe Market Y-o-Y Growth Comparison by Product Type, 2025 to 2035
  • Figure 70: Eastern Europe Market Attractiveness Analysis by Product Type
  • Figure 71: Eastern Europe Market Value Share and BPS Analysis by Printing Process, 2025 and 2035
  • Figure 72: Eastern Europe Market Y-o-Y Growth Comparison by Printing Process, 2025 to 2035
  • Figure 73: Eastern Europe Market Attractiveness Analysis by Printing Process
  • Figure 74: Eastern Europe Market Value Share and BPS Analysis by Application Type, 2025 and 2035
  • Figure 75: Eastern Europe Market Y-o-Y Growth Comparison by Application Type, 2025 to 2035
  • Figure 76: Eastern Europe Market Attractiveness Analysis by Application Type
  • Figure 77: East Asia Market Value Share and BPS Analysis by Country, 2025 and 2035
  • Figure 78: East Asia Market Value Share and BPS Analysis by Sterilization Process , 2025 and 2035
  • Figure 79: East Asia Market Y-o-Y Growth Comparison by Sterilization Process , 2025 to 2035
  • Figure 80: East Asia Market Attractiveness Analysis by Sterilization Process
  • Figure 81: East Asia Market Value Share and BPS Analysis by Product Type, 2025 and 2035
  • Figure 82: East Asia Market Y-o-Y Growth Comparison by Product Type, 2025 to 2035
  • Figure 83: East Asia Market Attractiveness Analysis by Product Type
  • Figure 84: East Asia Market Value Share and BPS Analysis by Printing Process, 2025 and 2035
  • Figure 85: East Asia Market Y-o-Y Growth Comparison by Printing Process, 2025 to 2035
  • Figure 86: East Asia Market Attractiveness Analysis by Printing Process
  • Figure 87: East Asia Market Value Share and BPS Analysis by Application Type, 2025 and 2035
  • Figure 88: East Asia Market Y-o-Y Growth Comparison by Application Type, 2025 to 2035
  • Figure 89: East Asia Market Attractiveness Analysis by Application Type
  • Figure 90: South Asia and Pacific Market Value Share and BPS Analysis by Country, 2025 and 2035
  • Figure 91: South Asia and Pacific Market Value Share and BPS Analysis by Sterilization Process , 2025 and 2035
  • Figure 92: South Asia and Pacific Market Y-o-Y Growth Comparison by Sterilization Process , 2025 to 2035
  • Figure 93: South Asia and Pacific Market Attractiveness Analysis by Sterilization Process
  • Figure 94: South Asia and Pacific Market Value Share and BPS Analysis by Product Type, 2025 and 2035
  • Figure 95: South Asia and Pacific Market Y-o-Y Growth Comparison by Product Type, 2025 to 2035
  • Figure 96: South Asia and Pacific Market Attractiveness Analysis by Product Type
  • Figure 97: South Asia and Pacific Market Value Share and BPS Analysis by Printing Process, 2025 and 2035
  • Figure 98: South Asia and Pacific Market Y-o-Y Growth Comparison by Printing Process, 2025 to 2035
  • Figure 99: South Asia and Pacific Market Attractiveness Analysis by Printing Process
  • Figure 100: South Asia and Pacific Market Value Share and BPS Analysis by Application Type, 2025 and 2035
  • Figure 101: South Asia and Pacific Market Y-o-Y Growth Comparison by Application Type, 2025 to 2035
  • Figure 102: South Asia and Pacific Market Attractiveness Analysis by Application Type
  • Figure 103: Middle East & Africa Market Value Share and BPS Analysis by Country, 2025 and 2035
  • Figure 104: Middle East & Africa Market Value Share and BPS Analysis by Sterilization Process , 2025 and 2035
  • Figure 105: Middle East & Africa Market Y-o-Y Growth Comparison by Sterilization Process , 2025 to 2035
  • Figure 106: Middle East & Africa Market Attractiveness Analysis by Sterilization Process
  • Figure 107: Middle East & Africa Market Value Share and BPS Analysis by Product Type, 2025 and 2035
  • Figure 108: Middle East & Africa Market Y-o-Y Growth Comparison by Product Type, 2025 to 2035
  • Figure 109: Middle East & Africa Market Attractiveness Analysis by Product Type
  • Figure 110: Middle East & Africa Market Value Share and BPS Analysis by Printing Process, 2025 and 2035
  • Figure 111: Middle East & Africa Market Y-o-Y Growth Comparison by Printing Process, 2025 to 2035
  • Figure 112: Middle East & Africa Market Attractiveness Analysis by Printing Process
  • Figure 113: Middle East & Africa Market Value Share and BPS Analysis by Application Type, 2025 and 2035
  • Figure 114: Middle East & Africa Market Y-o-Y Growth Comparison by Application Type, 2025 to 2035
  • Figure 115: Middle East & Africa Market Attractiveness Analysis by Application Type
  • Figure 116: Global Market – Tier Structure Analysis
  • Figure 117: Global Market – Company Share Analysis

Frequently Asked Questions

How big is the chemical indicator inks market in 2025?

The global chemical indicator inks market is estimated to be valued at USD 84.8 billion in 2025.

What will be the size of chemical indicator inks market in 2035?

The market size for the chemical indicator inks market is projected to reach USD 174.8 billion by 2035.

How much will be the chemical indicator inks market growth between 2025 and 2035?

The chemical indicator inks market is expected to grow at a 7.5% CAGR between 2025 and 2035.

What are the key product types in the chemical indicator inks market?

The key product types in chemical indicator inks market are steam, ethylene oxide, vaporized hydrogen peroxide and plasma, formaldehyde and others.

Which product type segment to contribute significant share in the chemical indicator inks market in 2025?

In terms of product type, solvent-based segment to command 40.6% share in the chemical indicator inks market in 2025.

Explore Similar Insights

Future Market Insights

Chemical Indicator Inks Market

Chat With MaRIA

Chat With

MaRIA

Hi There, I am MaRIA, Your Market Research Intelligence Assistant. How may I help you?