The Photo Printing and Merchandise Industry Analysis in Western Europe is estimated to be valued at USD 5.4 billion in 2025 and is projected to reach USD 7.0 billion by 2035, registering a compound annual growth rate (CAGR) of 2.7% over the forecast period.
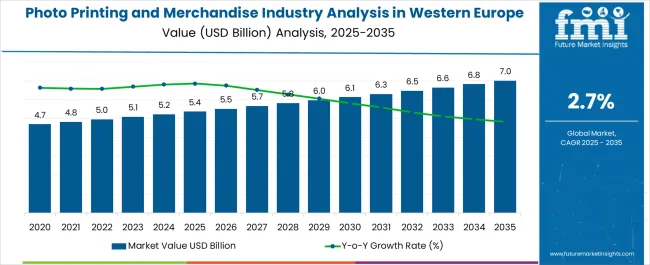
| Metric | Value |
|---|---|
| Photo Printing and Merchandise Industry Analysis in Western Europe Estimated Value in (2025 E) | USD 5.4 billion |
| Photo Printing and Merchandise Industry Analysis in Western Europe Forecast Value in (2035 F) | USD 7.0 billion |
| Forecast CAGR (2025 to 2035) | 2.7% |
The photo printing and merchandise industry in Western Europe is experiencing robust growth. Rising consumer inclination toward personalized products, combined with the convenience of digital platforms, is driving adoption. The industry is being supported by increasing smartphone penetration, greater internet accessibility, and the shift toward mobile-based ordering channels.
Current dynamics reflect steady demand for high-quality prints and merchandise across both individual and commercial applications. Advances in printing technologies are improving output efficiency, color accuracy, and customization flexibility, further strengthening consumer confidence. The future outlook is defined by the integration of digital printing innovations, the adoption of sustainable printing practices, and the expansion of online distribution networks that enhance market accessibility.
Growth rationale is reinforced by evolving gifting trends, the demand for personalized photo products, and the availability of seamless mobile-to-print solutions As a result, the industry is projected to maintain a stable expansion trajectory supported by technological enhancements, consumer-driven innovation, and strong e-commerce channels across Western Europe.
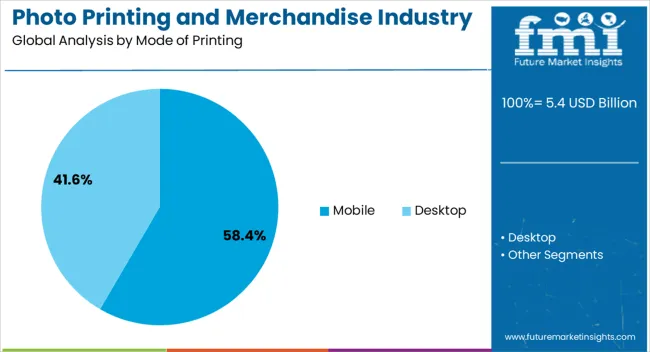
The mobile segment, accounting for 58.40% of the mode of printing category, has emerged as the dominant channel due to the rapid expansion of smartphone usage and app-based ordering systems. Adoption has been fueled by the convenience of mobile platforms that enable quick uploads, editing, and purchases directly from devices.
High engagement levels on social media platforms have further supported demand, as consumers increasingly convert digital memories into tangible formats. The segment’s share has been reinforced by ease of access, integration with cloud storage, and improved payment gateways, which collectively enhance user experience.
Continuous development of mobile applications by printing service providers, coupled with promotional offers and loyalty programs, is expected to sustain growth The mobile channel is positioned to maintain leadership as the preferred choice for consumers seeking personalization, immediacy, and convenience in photo printing services.
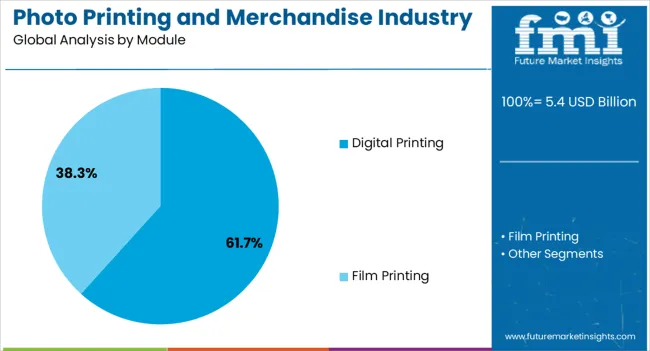
The digital printing module, representing 61.70% of the module category, has maintained its lead owing to its superior efficiency, flexibility, and cost-effectiveness in short-run and customized printing tasks. Market demand has been reinforced by the technology’s ability to deliver high-resolution outputs with faster turnaround times compared to traditional methods.
The segment’s dominance is attributed to advancements in inkjet and laser printing technologies, which enable superior image reproduction and broader material compatibility. Adoption has also been supported by reduced setup costs and scalability in handling diverse product categories.
Continuous innovations in eco-friendly inks and sustainable substrates have enhanced alignment with regional environmental standards As consumer preference for personalized and high-quality prints expands, digital printing remains the preferred choice for service providers, ensuring its continued leadership in the industry.
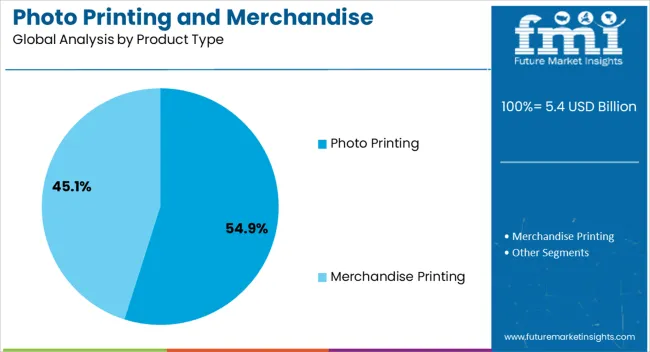
The photo printing segment, holding 54.90% of the product type category, has sustained leadership due to the enduring appeal of tangible photographs as keepsakes and gifts. Growth has been supported by strong consumer demand for printed memories across occasions, holidays, and special events. The segment has benefited from integration with online platforms and mobile applications that simplify ordering processes and expand accessibility.
High-quality printing technologies have elevated consumer satisfaction, reinforcing repeat purchases and customer loyalty. The durability, affordability, and personalization offered by photo printing have strengthened its positioning against alternative digital-only formats.
Strategic investments in premium-quality prints and value-added services such as same-day delivery are enhancing competitiveness As personalization continues to influence purchasing behavior, the photo printing category is expected to remain a dominant contributor to industry revenue in Western Europe.
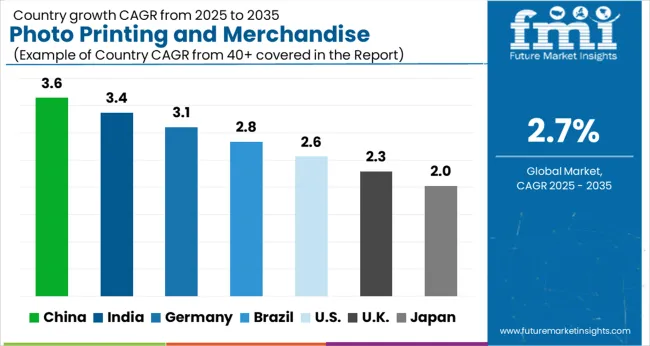
| Photo Printing and Merchandise in Western Europe based on Country | CAGR % (2025 to 2035) |
|---|---|
| The United Kingdom | 2.1% |
| Germany | 2.6% |
| Italy | 2.6% |
A growing preference for online photo printing services characterizes the photo printing and merchandise industry in the United Kingdom. Consumers in the United Kingdom frequently utilize photo merchandise for special occasions and gifting. The widespread availability of smartphones with high-quality cameras has resulted in a surge of digital photography in the country.
There is a strong demand for innovative and creative photo products. Sustainability is a key concern, and consumers are seeking eco-friendly options. Consumers in the country are increasingly requesting high-quality materials and designs. The industry in the United Kingdom is projected to expand at a CAGR of 2.1% through 2035.
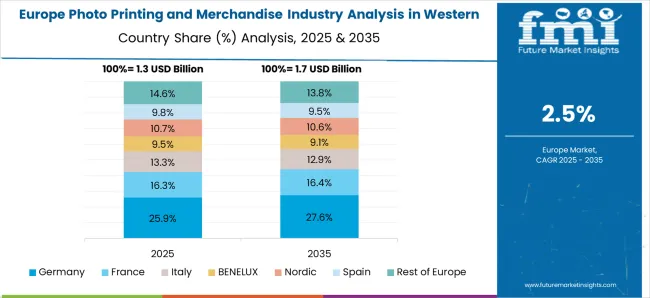
Germany has a strong demand for photo printing with a focus on high-quality products and customization options. Germany has a well-established eCommerce infrastructure, making it convenient for consumers to order personalized photo products online. The ease of online ordering and home delivery has boosted photo printing and merchandise demand.
Personalized photo merchandise is a popular choice for gift-giving and commemorating special occasions such as birthdays, weddings, anniversaries, and holidays in Germany. This, in turn, drives the growth of the photo printing and merchandise industry in the country.
Sustainability is a significant trend, with a strong emphasis on eco-friendly printing options. Corporate demand for promotional merchandise is robust and caters to businesses' branding needs. The industry in Germany therefore is projected to experience an expansion at a CAGR of 2.6% through 2035.
A strong culture of art and design influences Italy's photo printing industry. The industry in Italy is anticipated to expand at a CAGR of 2.6% through 2035.
Consumers in this country prioritize high-quality prints and creative customization options. Photo merchandise is often used for commemorating special occasions. The industry reflects Italian aesthetics and preferences for premium products.
Personalized photo merchandise is gaining popularity in Italy for gifting and commemorating special occasions, including birthdays, weddings, anniversaries, and holidays.
Environmental concerns and sustainability are growing trends in Italy. Consumers favor eco-friendly printing options and companies that adopt sustainable practices, reflecting a commitment to responsible consumption.
The digital printing type segment is expected to be the top revenue-generating category, accounting for a share of 75.1% in 2025. Digital printing is highly cost-effective for small to medium print runs, and it doesn't require initial setup costs. This makes producing limited quantities of personalized photo merchandise and prints an economical choice.
| Category | Digital Printing |
|---|---|
| Industry Share in 2025 | 75.1% |
Digital printing excels at variable data printing, allowing each print to be customized with unique text, images, or graphics. This capability is essential in the photo printing and merchandise industry, where personalization and customization are highly valued.
The desktop segment is expected to dominate the industry since desktops are compatible with all kinds of printers, and large quantities of prints can be processed on desktops. The desktop application segment accounts for a share of 87.4% in 2025.
| Category | Desktop Application |
|---|---|
| Industry Share | 87.4% |
Desktop printers provide immediate access to printed photos. Users can print their favorite images on-demand, eliminating the need to wait for an external printing service to process and deliver the prints. Desktop printers are versatile and can handle various printing tasks, not limited to photos. Owing to these qualities, the desktop printer remains the preferred segment.
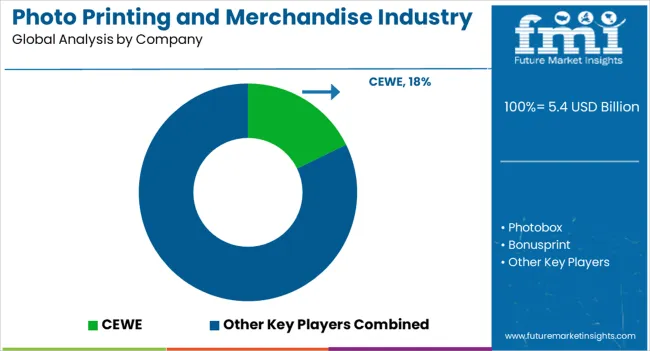
Acquisitions and mergers are the predominant expansion strategies employed by players in the photo printing and merchandise industry in Western Europe. Industry players are utilizing innovative printers that incorporate cutting-edge technology and eco-friendly features.
Certain companies in Western Europe are embracing eco-friendly practices by using sustainable materials and offering options for carbon-neutral printing. These practices are designed to minimize environmental impact and align with the growing consumer demand for eco-friendly options.
Recent Developments Observed in Western European Photo Printing and Merchandise Industry
| Attribute | Details |
|---|---|
| Estimated Industry Size in 2025 | USD 5.4 billion |
| Projected Industry Size in 2035 | USD 7.0 billion |
| Anticipated CAGR between 2025 to 2035 | 2.7% CAGR |
| Historical Analysis of Demand for photo printing and merchandise in Western Europe | 2020 to 2025 |
| Demand Forecast for photo printing and merchandise in Western Europe | 2025 to 2035 |
| Report Coverage | Industry Size, Industry Trends, Analysis of key factors influencing photo printing and merchandise adoption in Western Europe, Insights on Global Players and their Industry Strategy in Western Europe, Ecosystem Analysis of Local and Regional Western Europe Providers |
| Key Countries Analyzed while Studying Opportunities in photo printing and merchandise in Western Europe | Germany, Italy, France, Spain, The United Kingdom, BENELUX, Rest of Western Europe |
| Key Companies Profiled | Photobox; CEWE; Bonusprint; Vistaprint; Saal Digital; WhiteWall; Smartphoto Group |
The global photo printing and merchandise industry analysis in western europe is estimated to be valued at USD 5.4 billion in 2025.
The market size for the photo printing and merchandise industry analysis in western europe is projected to reach USD 7.0 billion by 2035.
The photo printing and merchandise industry analysis in western europe is expected to grow at a 2.7% CAGR between 2025 and 2035.
The key product types in photo printing and merchandise industry analysis in western europe are mobile and desktop.
In terms of module, digital printing segment to command 61.7% share in the photo printing and merchandise industry analysis in western europe in 2025.


Full Research Suite comprises of:
Market outlook & trends analysis
Interviews & case studies
Strategic recommendations
Vendor profiles & capabilities analysis
5-year forecasts
8 regions and 60+ country-level data splits
Market segment data splits
12 months of continuous data updates
DELIVERED AS:
PDF EXCEL ONLINE
Photoresist Chemical Market Forecast and Outlook 2025 to 2035
Photostability Chamber Market Size and Share Forecast Outlook 2025 to 2035
Photo-Label Verifiers Market Analysis - Size and Share Forecast Outlook 2025 to 2035
Photographic Paper Market Size and Share Forecast Outlook 2025 to 2035
Photosensitive Alignment Film Market Size and Share Forecast Outlook 2025 to 2035
Photomultiplier Tube Accessories Market Size and Share Forecast Outlook 2025 to 2035
Phototherapy Equipment Market Size and Share Forecast Outlook 2025 to 2035
Phototherapy Treatment Market Size and Share Forecast Outlook 2025 to 2035
Photosensitive Semiconductor Market Size and Share Forecast Outlook 2025 to 2035
Photoacoustic Tomography Market Size and Share Forecast Outlook 2025 to 2035
Photonic Crystal Displays Market Size and Share Forecast Outlook 2025 to 2035
Photoresist Electronic Chemical Market Size and Share Forecast Outlook 2025 to 2035
Photorejuvenation Equipment Market Size and Share Forecast Outlook 2025 to 2035
Photonics Market Analysis - Size, Share, and Forecast Outlook 2025 to 2035
Photoresist Stripper Market Analysis - Size, Share, and Forecast 2025 to 2035
Photon Counters Market Size, Growth, and Forecast 2025 to 2035
Phototherapy Lamps Market Growth - Trends & Forecast 2025 to 2035
Photonic Sensor Market - Trends & Forecast 2025 to 2035
Photo Booth Market Growth & Trends 2025-2035
Photonic Sensors & Detectors Market Insights - Growth & Forecast 2024 to 2034

Thank you!
You will receive an email from our Business Development Manager. Please be sure to check your SPAM/JUNK folder too.
Chat With
MaRIA