Between 2025 and 2035, the photomultiplier tube accessories market is projected to increase from USD 567.8 million to USD 916.2 million, growing at a CAGR of 4.9% The photomultiplier tube accessories market is positioned for a compelling growth trajectory that reflects the scientific instrument industry's evolution toward precision measurement and advanced detection capabilities.
The first half of the decade will witness market expansion from USD 568 million in 2025 to USD 721.3 million by 2030, establishing a foundation worth USD 153.5 million in additional market value that represents 44% of the total ten-year growth story. This initial phase creates the groundwork for widespread adoption of advanced accessories across medical research, environmental monitoring, and industrial quality control applications where precise optical detection drives operational success.
The latter half will witness accelerated momentum as the market advances from USD 721.3 million in 2030 to USD 916.2 million by 2035, adding USD 194.9 million in value that constitutes 56% of the decade's expansion. This period reflects technological maturation with sophisticated power management systems, digital signal processing integration, and calibration equipment that enables next-generation photomultiplier applications in emerging fields including quantum research and advanced medical diagnostics.
The complete transformation delivers a 61.4% growth trajectory, creating a market 1.61 times larger by 2035 than today's baseline. This steady but substantial expansion trajectory means that companies establishing strong technical positions and customer relationships during the foundational phase will benefit from cumulative growth effects as the market matures into higher-value applications and advanced technology implementations.
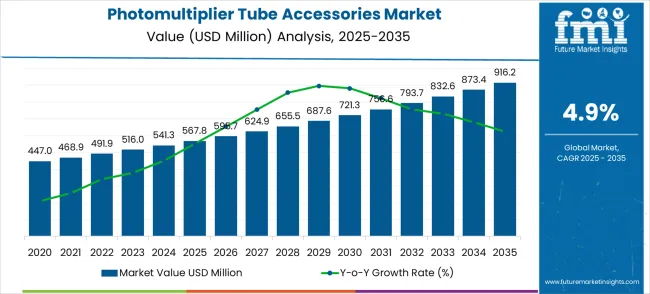
The decade growth phasing analysis reveals two distinct market evolution periods characterized by different technological advancement patterns and application expansion rates. The foundation period, from 2025 to 2030, represents market consolidation around established applications, with USD 153.5 million in expansion driven by the growth of healthcare research, the deployment of environmental monitoring systems, and industrial quality control automation. This period establishes competitive advantages through the development of technical expertise, building customer relationships, and optimizing manufacturing processes, which support cost-effective accessory production.
The acceleration period from 2030 to 2035 demonstrates mature market characteristics with USD 194.9 million expansion reflecting broader technology adoption, premium product segment development, and emerging application penetration across quantum research and advanced medical imaging systems. Market maturation factors include standardized interface protocols, consolidated supply chains, and competitive differentiation through specialized technical capabilities rather than basic functionality provision.
The competitive landscape evolves from initial fragmentation to technical specialization as successful companies consolidate their market share through superior engineering capabilities, application-specific expertise, and comprehensive customer support programs. Phase transition logic suggests that companies that master technical challenges and establish customer trust during the foundation period gain compound advantages in the acceleration phase through reputation effects, technical partnership development, and operational efficiency improvements, which enable premium pricing strategies.
| Metric | Value |
|---|---|
| Market Value (2025) → | USD 568 million |
| Market Forecast (2035) ↑ | USD 916.2 million |
| Growth Rate ★ | 5% CAGR |
| Growth Multiplier | 1.61X expansion |
| Leading Accessory Type → | Power and Signal Processing |
| Primary Application → | Medical and Life Sciences |
Market expansion rests on three fundamental shifts transforming the scientific instrumentation landscape:
1. Research Infrastructure Expansion: Growing government and private investment in life sciences research, environmental monitoring systems, and industrial quality control programs creates sustained demand for precise optical detection capabilities that require sophisticated accessory systems for optimal performance and measurement accuracy.
2. Technology Integration Advancement: Digital signal processing evolution and automated measurement system development enable photomultiplier accessories to deliver enhanced performance characteristics, including improved noise reduction, automated calibration, and real-time data processing that justify premium pricing for research-critical applications.
3. Application Diversification: Traditional nuclear physics and astronomy applications expand into medical imaging, drug discovery, environmental analysis, and industrial process monitoring, where photomultiplier systems provide unique detection capabilities for phenomena requiring ultra-sensitive optical measurement.
Growth faces headwinds from budget constraints affecting research institution capital equipment purchases, technical complexity limiting adoption among smaller laboratories lacking specialized expertise, and alternative detection technologies, including semiconductor-based sensors that compete for specific measurement applications where photomultiplier advantages are less pronounced.
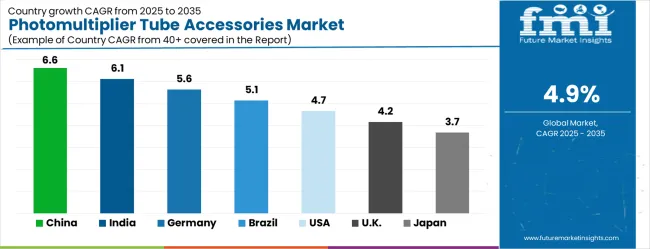
The photomultiplier tube accessories market (USD 567.8M → 916.2M by 2035, CAGR ~5%) is driven by demand in medical & life sciences (nuclear medicine, fluorescence imaging, PET scanners, and spectroscopy) and industrial & environmental monitoring (radiation detection, emissions tracking, and water quality analysis). Segmentation spans power & signal processing accessories, testing & calibration accessories, and other specialized modules. Growth leadership comes from China (6.6% CAGR), India (6.1%), and Germany (5.6%), while the USA, UK, and Japan sustain adoption across research and industrial monitoring labs. Together, these drivers unlock ~USD 348.4M incremental opportunities by 2035.
Pathway A – Power & Signal Processing for Med/Life Sciences. Low-noise amplifiers, high-voltage bases, photon-counting modules, and analog front-end electronics for imaging, PET, and nuclear medicine. Win themes: FDA/CE packs, EMI shielding, low dark current, biocompatible housings, traceable components.
Pathway B – Testing & Calibration for Industrial/Environmental Monitoring Calibration light sources, reference detectors, and portable test rigs for spectroscopy, nuclear safety, and emissions monitoring. Win themes: NIST-traceable kits, rugged IP-rated designs, field-swappable modules, automated certification logs.
Pathway C – Integrated “Accessory Bundles” for OEM Instruments. Pre-engineered stacks (power + signal + calibration) co-developed with spectrometer, imaging, and radiation equipment OEMs to accelerate validation.Win themes: Design-in SKUs, API/driver libraries, documented latency/noise specs, revenue-share spares.
Pathway D – Smart/Connected Accessories. Digitally enabled PMT bases and calibration modules with embedded diagnostics, telemetry, and OTA firmware updates. Win themes: Predictive failure alerts, secure OTA, dashboard analytics, pay-per-use upgrades.
Pathway E – Regulated & Harsh-Environment Specials. Accessories engineered for MRI/OR facilities, nuclear sites, offshore labs, and corrosive industrial environments. Win themes: Stainless/low-outgassing builds, ATEX/UL/IEC marks, radiation-hardened coatings, saline/humidity endurance.
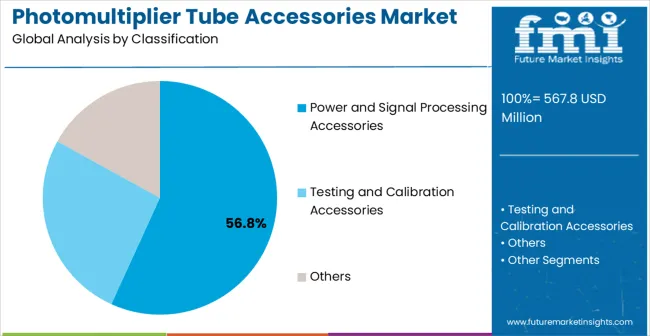
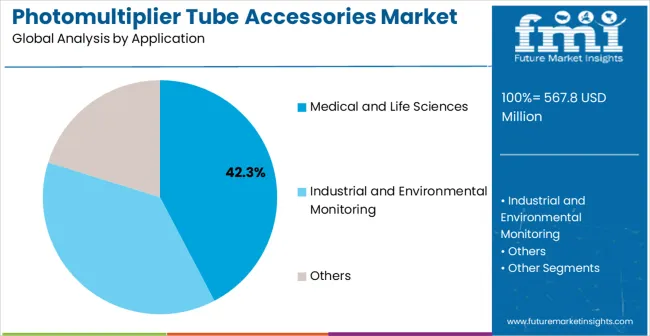
The photomultiplier tube accessories market is classified by accessory type into power and signal processing components, testing and calibration tools, and other supplementary products. Power and signal processing units form the backbone of system integration by ensuring precise amplification and signal management, while testing and calibration tools safeguard performance accuracy and reliability. Additional accessory types provide operational flexibility across applications. From an end-use perspective, medical and life sciences dominate demand, driven by advanced diagnostics and research instruments that rely on high-sensitivity detection. Industrial and environmental monitoring follows, where PMT accessories play a central role in safety, quality control, and analytical processes. Other uses capture emerging or niche applications, showcasing the adaptability of PMT accessories across scientific and industrial sectors.
Market Position
Power and signal processing accessories command market dominance through their essential role in optimizing photomultiplier tube performance and enabling precise measurement capabilities across diverse scientific applications. This leadership position reflects the critical importance of signal conditioning, amplification, and noise reduction in achieving measurement accuracy that justifies photomultiplier system investments.
Value Drivers
The segment delivers measurable performance improvements through advanced amplification circuits, noise reduction technologies, and signal conditioning systems that enable detection of extremely low light levels with high precision. These accessories provide the interface between photomultiplier tubes and measurement systems, ensuring optimal signal quality and measurement reliability.
Competitive Advantages
Power and signal processing accessories offer technical differentiation through proprietary circuit designs, specialized component selection, and application-specific optimization that competitors cannot easily replicate. The segment benefits from established customer relationships and technical expertise requirements that create switching barriers.
Market Challenge
Increasing complexity of digital signal processing integration requires continuous investment in advanced electronic design capabilities and software development expertise that smaller manufacturers may struggle to maintain competitively.
Strategic Market Importance
The medical and life sciences segment accounts for 42.3% of the photomultiplier tube (PMT) accessories market, representing a major growth avenue driven by continuous advancements in research, diagnostics, and healthcare technology. This segment’s strategic importance lies in its critical role in providing ultra-sensitive detection and high-precision measurements, which are essential in complex medical applications such as drug discovery, advanced imaging systems, and diagnostic equipment development. The demand for reliable and precise photomultiplier systems in medical research ensures a steady requirement for sophisticated accessory systems that enhance performance, optimize signal accuracy, and maintain data fidelity in highly regulated environments.
Internal Market Analysis
Why dominant? Medical research and healthcare applications require detection capabilities that few other technologies can provide. Photomultiplier systems meet these requirements, enabling precise measurements in scenarios where alternative devices fail to deliver the necessary sensitivity, accuracy, or low-noise performance.
What drives adoption? Expansion of research funding, increasing pharmaceutical and biotech investments, and the development of high-precision medical devices create sustained demand for premium PMT accessories. These systems improve measurement accuracy, enhance workflow efficiency, and support critical medical research outcomes.
Where is growth? Key growth opportunities lie in academic medical centers, pharmaceutical research facilities, and medical device manufacturers, where advanced detection systems offer competitive research advantages and regulatory compliance benefits.
Key Market Drivers and Trends:
Growth Accelerators Scientific research funding expansion drives demand as government agencies and private institutions increase investment in advanced measurement capabilities for medical research, environmental monitoring, and fundamental physics investigations that require ultra-sensitive optical detection. Digital technology integration enables automated measurement systems where photomultiplier accessories provide enhanced performance through advanced signal processing, automated calibration, and real-time data analysis capabilities that improve research productivity. Application diversification expands market opportunities as photomultiplier systems find new uses in medical diagnostics, industrial quality control, and environmental assessment where unique detection capabilities provide measurement solutions unavailable through alternative technologies.
Growth Inhibitors Budget constraints limit capital equipment purchases across research institutions and industrial facilities during economic uncertainty, forcing customers to defer accessory upgrades and maintenance programs that support optimal photomultiplier system performance. Technical complexity barriers prevent adoption among smaller laboratories lacking specialized expertise required for proper installation, calibration, and maintenance of sophisticated accessory systems. Alternative detection technologies including semiconductor-based sensors and digital imaging systems compete for specific applications where photomultiplier advantages may not justify higher costs and complexity requirements.
Market Evolution Patterns Technology convergence accelerates as manufacturers integrate artificial intelligence algorithms, automated optimization systems, and predictive maintenance capabilities that transform basic accessories into comprehensive measurement solutions providing ongoing value through performance optimization. Geographic expansion patterns show developed markets focusing on premium performance applications while emerging economies begin adoption cycles driven by research infrastructure development and industrial modernization programs. Product category evolution shifts from standalone accessories toward integrated measurement platforms where accessories combine with software systems and automated calibration equipment to provide comprehensive measurement solutions.
| Country | CAGR (2025 to 2035) |
|---|---|
| China | 6.6% |
| India | 6.1% |
| Germany | 5.6% |
| Brazil | 5.1% |
| USA | 4.7% |
| UK | 4.2% |
| Japan | 3.7% |
The photomultiplier tube accessories market demonstrates geographic diversity with growth leaders emerging from both developed research economies and emerging scientific infrastructure markets. Growth leaders include China and India, capitalizing on research infrastructure expansion and manufacturing cost advantages in specialized electronic components.
Steady performers encompass Germany, Brazil, and the United States, where established research institutions and industrial applications provide consistent demand growth. Emerging markets show potential in regions where scientific infrastructure development supports expanding measurement capability requirements.
Regional synthesis reveals Asia-Pacific markets leading through research infrastructure development and manufacturing capability expansion, while North American and European markets provide stability through established scientific institutions and advanced research programs. The global growth story combines emerging market infrastructure development with developed market technology advancement, creating opportunities across performance levels and application categories.
The report covers an in-depth analysis of 40+ countries top-performing countries are highlighted below.
China demonstrates exceptional market leadership potential through comprehensive research infrastructure development and advanced manufacturing capabilities supporting both domestic research needs and global supply chain integration.
Market expansion advances at 6.6% CAGR through 2035, supported by government investment in scientific research programs, expanding pharmaceutical and biotechnology industries, and growing environmental monitoring requirements across major industrial regions. Chinese research institutions and manufacturing facilities are investing in advanced measurement capabilities that require sophisticated photomultiplier accessories for precision detection applications in medical research, environmental analysis, and industrial quality control programs.
Government science and technology development initiatives create substantial demand for advanced measurement systems where photomultiplier accessories provide critical performance capabilities for research programs spanning life sciences, materials science, and environmental studies. The country's leadership in advanced manufacturing enables cost-effective production of specialized electronic components while maintaining quality standards required for scientific instrumentation applications.
India is emerging as a significant market for photomultiplier tube (PMT) accessories, driven by the rapid development of advanced research infrastructure in metropolitan hubs such as Bangalore and Mumbai. These facilities are establishing sophisticated analytical capabilities, where PMT accessories enable ultra-precise measurements for pharmaceutical research, environmental monitoring, and industrial quality control applications. Market growth is projected at a CAGR of 6.1%, fueled by expanding government research programs, private sector investment in high-precision analytical systems, and adoption of international measurement standards.
Indian research institutions increasingly require advanced accessory systems to optimize photomultiplier performance in demanding scientific applications. Additionally, technology transfer programs and international collaborations are broadening access to advanced measurement technologies previously unavailable in traditional Indian research environments, allowing domestic laboratories to conduct research at globally competitive standards.
The adoption of PMT accessories not only enhances measurement accuracy but also supports productivity, reliability, and data consistency, which are critical for drug development, environmental assessments, and industrial monitoring. With ongoing investments in scientific infrastructure, India is positioned for sustained growth in both academic and industrial research markets.
Key Market Drivers and Trends:
Germany remains a highly attractive market for PMT accessories, underpinned by the country’s longstanding reputation for engineering excellence. Major urban regions, including Munich, Hamburg, and Berlin, host advanced manufacturing and research facilities that require precision measurement systems for both scientific and industrial applications. Market growth proceeds at a CAGR of 5.6% through 2035, supported by technical partnerships between German research institutions and manufacturers such as Hamamatsu and Photek.
These collaborations enable the development of specialized accessories tailored to demanding measurement requirements while maintaining the high quality and reliability that German engineering is known for. Industrial applications, such as quality control and environmental monitoring, increasingly rely on photomultiplier systems, while research institutions adopt these accessories for application-specific solutions.
German manufacturers also benefit from export market leadership, supplying premium PMT accessories globally, and technology innovation programs continue to advance next-generation signal processing and automated calibration capabilities. Precision manufacturing ensures consistent quality standards, long-term reliability, and comprehensive technical support for critical research and industrial tasks.
Key Market Drivers and Trends:
Brazil demonstrates steady growth in the PMT accessories market through investments in research capabilities and industrial measurement infrastructure in São Paulo, Rio de Janeiro, and Brasília. Market development is driven by academic research institutions and industrial facilities that require environmental monitoring and quality control solutions.
Growth reflects broader scientific infrastructure modernization; as traditional measurement techniques are gradually replaced or supplemented by advanced optical detection systems. Market adoption is supported by government research funding, technology transfer programs, and collaborative scientific initiatives with international partners, providing access to sophisticated measurement technologies and training programs for personnel. However, challenges remain in developing technical expertise for installation, calibration, and maintenance of complex accessory systems, requiring ongoing training and support.
Overall, steady growth is projected as Brazil’s academic and industrial sectors increasingly integrate PMT accessories into their research and quality assurance workflows, enabling improved measurement accuracy, compliance with international standards, and industrial productivity gains.
Strategic Market Considerations:
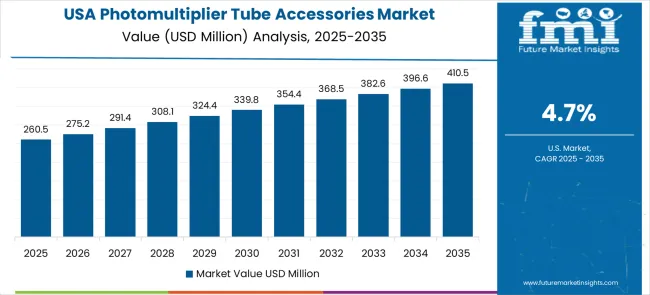
The United States maintains a leading position in the PMT accessories market, driven by innovation, research excellence, and a focus on cost-per-outcome optimization under stringent compliance and reliability requirements. Market growth proceeds at a CAGR of 4.7% through 2035, with adoption led by research institutions engaged in medical research, environmental monitoring, and industrial quality control.
USA institutions prioritize systems that integrate seamlessly with laboratory information management platforms, ensuring data reliability, regulatory compliance, and long-term system performance. Scientific equipment distributors and specialty manufacturers support this ecosystem through extensive technical assistance, enabling optimal performance and maintenance of sophisticated photomultiplier accessory systems.
The market is also influenced by stable research funding, which provides predictable demand for premium-performance measurement tools essential for competitive research outcomes and regulatory adherence. Advanced digital processing, automated calibration, and next-generation accessory development further support innovation, positioning the United States as a global benchmark for PMT accessory adoption.
Performance Metrics:
The United Kingdom represents a medium-growth market for PMT accessories, characterized by consistent adoption across academic and industrial research sectors. Market growth is projected at a CAGR of 4.2%, driven by demand for precise measurement capabilities in competitive research programs. Photomultiplier accessories are critical for applications requiring high detection sensitivity, data accuracy, and integration with existing research infrastructure.
Advanced measurement requirements complement the country’s established research ecosystem, providing measurable performance improvements in laboratory workflows and industrial monitoring. UK institutions leverage these technologies to enhance scientific outputs, ensure data reliability, and maintain compliance with international standards, driving continued investment in high-performance PMT accessories.
Key Market Drivers and Trends:
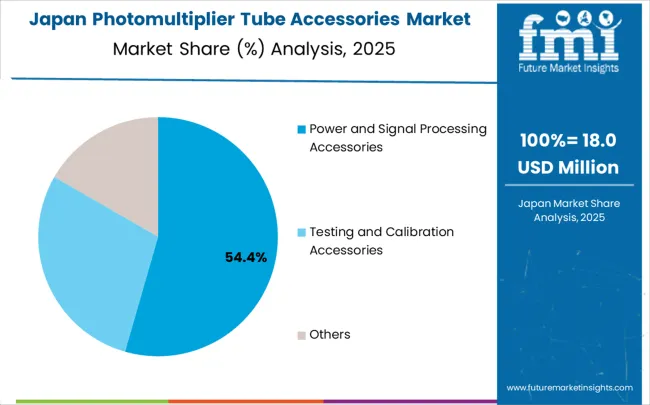
Japan represents a mature market scenario for PMT accessories, with sophisticated technical requirements and high expectations among research institutions and industrial facilities. Market growth is projected at a CAGR of 3.7%, driven by a focus on quality, reliability, and technical innovation. Japanese facilities prioritize photomultiplier accessories that demonstrate engineering precision, validated performance, and long-term reliability, justifying premium investments for critical measurement tasks.
The country’s technological leadership supports development of advanced accessories with superior performance, while international collaborations and technology transfer initiatives expand research capabilities. Japanese manufacturers also maintain export market leadership, providing global access to precision measurement systems and technical support, reinforcing the country’s role as a benchmark in PMT accessory innovation.
Current Market Observations:
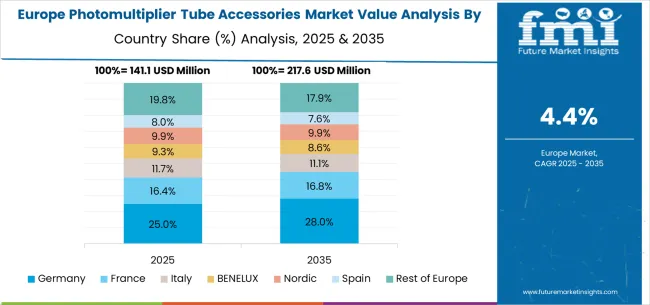
The European photomultiplier tube accessories market represents a sophisticated regional ecosystem where advanced research institutions and precision manufacturing capabilities create integrated demand for high-performance measurement systems. Northern European countries including Germany and the United Kingdom provide technical leadership through engineering excellence and established research programs that set performance standards influencing product development across the broader European scientific instrumentation market.
Central European markets demonstrate growing investment in research infrastructure and advanced manufacturing capabilities that require precision measurement systems for quality control and environmental monitoring applications. Mediterranean markets show increasing adoption of advanced analytical capabilities as research institutions expand international collaboration programs and industrial facilities implement sophisticated quality control systems. The regional integration enables technology sharing, collaborative research programs, and standardized performance requirements that accelerate market development while maintaining high technical standards across diverse research and industrial applications.
In Japan, the photomultiplier tube accessories market is largely driven by the power and signal processing accessories segment, which accounts for 61.4% of total market revenues in 2025. The high penetration of precision measurement systems in Japanese research institutions and the established preference for superior signal conditioning and noise reduction capabilities are key contributing factors.
Testing and calibration accessories follow with a 28.9% share, primarily in industrial quality control applications that require systematic performance verification and documentation for regulatory compliance programs. Mechanical mounting and environmental control systems contribute 9.7% as their adoption in specialized research applications continues developing across diverse institutional and industrial measurement requirements.
Market Characteristics
Power and Signal Processing Accessories Drive Photomultiplier System Demand in South Korea In South Korea, the photomultiplier tube (PMT) accessories market is largely driven by the power and signal processing accessories segment, which dominates due to the growing adoption of high-performance measurement systems in research institutions and industrial applications.
These accessories are valued for their superior signal conditioning and noise reduction capabilities, which are critical in medical imaging, nuclear physics, and advanced industrial automation. Testing and calibration accessories follow, primarily in quality control and research verification applications that require accurate performance documentation to meet regulatory standards. Mechanical mounting and environmental control systems have a smaller but growing presence, supporting specialized research setups where precise positioning and controlled conditions are essential.
The photomultiplier tube accessories market demonstrates moderate concentration with approximately 15-20 meaningful players competing globally, where market concentration shows the top five companies controlling roughly 50-55% of total market value through technical expertise, established customer relationships, and comprehensive product portfolios. Competition style emphasizes technical differentiation, application-specific expertise, and customer support capabilities rather than price competition, as customers prioritize performance and reliability when investing in critical measurement system components.
Market Leaders: Hamamatsu, PerkinElmer, and Excelitas Technologies maintain competitive advantages through comprehensive product portfolios, established research institution relationships, and advanced manufacturing capabilities that enable global market leadership. These companies leverage superior technical expertise, extensive patent portfolios, and integrated research and development programs to develop cutting-edge accessories that meet demanding performance requirements across diverse scientific applications. Their market positions benefit from decades of experience in photomultiplier technology and established trust relationships with research institutions worldwide.
Technology Specialists: Photek, Teledyne e2v, and Titan Electro-Optics compete through specialized expertise in specific application areas, innovative technology development, and targeted customer segments that value technical excellence over broad product availability. These companies often lead in particular performance categories or application niches, providing advanced solutions for demanding measurement requirements that established leaders may not address comprehensively.
Component Suppliers: ON Semiconductor, Advanced Photonix, Bruker, Roper Scientific, PicoQuant, and Horiba serve the market through specialized component expertise, cost-effective manufacturing, and focused product development that addresses specific technical requirements within the broader accessory ecosystem. These companies contribute essential components and subsystems that integrate into complete measurement solutions while maintaining competitive advantages through specialized technical capabilities.
Competitive dynamics between tiers show technology leaders maintaining market share through continuous innovation and comprehensive customer support, while specialists gain ground through superior performance in targeted applications and emerging market penetration. Component suppliers create value through technical expertise and manufacturing efficiency that enables cost-effective solutions for price-sensitive applications without compromising essential performance characteristics.
| Item | Value |
|---|---|
| Quantitative Units (2025) | USD 568 million |
| Accessory Type | Power and Signal Processing Accessories, Testing and Calibration Accessories, Others |
| End-Use | Medical and Life Sciences, Industrial and Environmental Monitoring, Others |
| Regions Covered | North America, Latin America, Europe, East Asia, South Asia & Pacific, Middle East & Africa |
| Countries Covered | United States, Canada, United Kingdom, Germany, France, China, Japan, South Korea, India, Brazil, Australia and 40+ countries |
| Key Companies Profiled | Hamamatsu, Photek, Excelitas Technologies, PerkinElmer, Titan Electro-Optics Co., Ltd., ON Semiconductor, Advanced Photonix, Teledyne e2v, Bruker, Roper Scientific, PicoQuant, Horiba |
| Additional Attributes | Dollar sales by accessory type and end-use applications, regional research infrastructure trends across North America, Europe, and Asia-Pacific, competitive landscape with established instrumentation manufacturers and specialized component suppliers, adoption patterns for analog versus digital signal processing systems, integration with laboratory automation and information management platforms, innovations in automated calibration and predictive maintenance systems, and development of application-specific accessories with enhanced performance optimization for specialized measurement requirements. |
The global photomultiplier tube accessories market is estimated to be valued at USD 567.8 million in 2025.
The market size for the photomultiplier tube accessories market is projected to reach USD 916.2 million by 2035.
The photomultiplier tube accessories market is expected to grow at a 4.9% CAGR between 2025 and 2035.
The key product types in photomultiplier tube accessories market are power and signal processing accessories, testing and calibration accessories and others.
In terms of application, medical and life sciences segment to command 42.3% share in the photomultiplier tube accessories market in 2025.


Our Research Products

The "Full Research Suite" delivers actionable market intel, deep dives on markets or technologies, so clients act faster, cut risk, and unlock growth.

The Leaderboard benchmarks and ranks top vendors, classifying them as Established Leaders, Leading Challengers, or Disruptors & Challengers.

Locates where complements amplify value and substitutes erode it, forecasting net impact by horizon

We deliver granular, decision-grade intel: market sizing, 5-year forecasts, pricing, adoption, usage, revenue, and operational KPIs—plus competitor tracking, regulation, and value chains—across 60 countries broadly.

Spot the shifts before they hit your P&L. We track inflection points, adoption curves, pricing moves, and ecosystem plays to show where demand is heading, why it is changing, and what to do next across high-growth markets and disruptive tech

Real-time reads of user behavior. We track shifting priorities, perceptions of today’s and next-gen services, and provider experience, then pace how fast tech moves from trial to adoption, blending buyer, consumer, and channel inputs with social signals (#WhySwitch, #UX).

Partner with our analyst team to build a custom report designed around your business priorities. From analysing market trends to assessing competitors or crafting bespoke datasets, we tailor insights to your needs.
Supplier Intelligence
Discovery & Profiling
Capacity & Footprint
Performance & Risk
Compliance & Governance
Commercial Readiness
Who Supplies Whom
Scorecards & Shortlists
Playbooks & Docs
Category Intelligence
Definition & Scope
Demand & Use Cases
Cost Drivers
Market Structure
Supply Chain Map
Trade & Policy
Operating Norms
Deliverables
Buyer Intelligence
Account Basics
Spend & Scope
Procurement Model
Vendor Requirements
Terms & Policies
Entry Strategy
Pain Points & Triggers
Outputs
Pricing Analysis
Benchmarks
Trends
Should-Cost
Indexation
Landed Cost
Commercial Terms
Deliverables
Brand Analysis
Positioning & Value Prop
Share & Presence
Customer Evidence
Go-to-Market
Digital & Reputation
Compliance & Trust
KPIs & Gaps
Outputs
Full Research Suite comprises of:
Market outlook & trends analysis
Interviews & case studies
Strategic recommendations
Vendor profiles & capabilities analysis
5-year forecasts
8 regions and 60+ country-level data splits
Market segment data splits
12 months of continuous data updates
DELIVERED AS:
PDF EXCEL ONLINE
Silicon Photomultiplier Market Size and Share Forecast Outlook 2025 to 2035
Tube and Core Market Size and Share Forecast Outlook 2025 to 2035
Tube Tester Market Size and Share Forecast Outlook 2025 to 2035
Tube Rotator Market Size and Share Forecast Outlook 2025 to 2035
Tuberculosis Therapeutics Market Size and Share Forecast Outlook 2025 to 2035
Tube Laminating Films Market Size and Share Forecast Outlook 2025 to 2035
Tube Filling Machine Market Size and Share Forecast Outlook 2025 to 2035
Tube Ice Machine Market Size and Share Forecast Outlook 2025 to 2035
Tube Closures Market Size and Share Forecast Outlook 2025 to 2035
Tube Sealing Machines Market Analysis by Tube type, Technology type, End User, and Region through 2025 to 2035
Tuberculous Meningitis Treatment Market - Demand & Innovations 2025 to 2035
Tube Feeding Formula Market Analysis by Product Type, Form, End User, Primary Condition and Distribution Channel Through 2035
Market Share Distribution Among Tube Filling Machine Manufacturers
Competitive Breakdown of Tube Sealing Machines Providers
Breaking Down Market Share in Tube Laminating Films
Competitive Overview of Tube and Core Market Share
Tube and Dressing Securement Products Market
Tuberculosis Diagnostics Market
Tubes, Bottles and Tottles Market
U-Tube Viscometer Market Size and Share Forecast Outlook 2025 to 2035

Thank you!
You will receive an email from our Business Development Manager. Please be sure to check your SPAM/JUNK folder too.
Chat With
MaRIA