The global photosensitive alignment film market is likely to reach USD 992.6 million by 2035, recording an absolute increase of USD 569.4 million over the forecast period. The market is valued at USD 423.2 million in 2025 and is set to rise at a CAGR of 9% during the assessment period.
The overall market size is expected to grow by nearly 2.35X during the same period, supported by increasing demand for advanced display technologies and growing adoption of OLED and quantum dot displays. However, market growth faces constraints from high manufacturing costs and technical challenges in developing next-generation alignment materials.
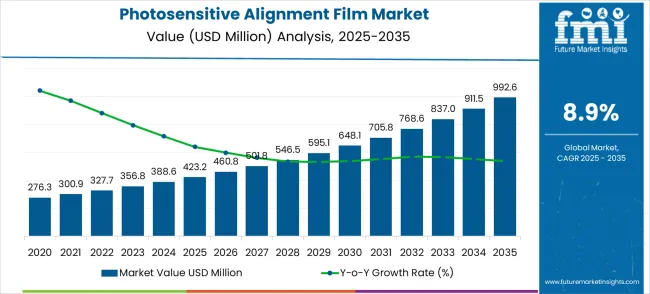
Between 2025 and 2030, the photosensitive alignment film market is projected to expand from USD 423.2 million to USD 648.1 million, resulting in a value increase of USD 224.9 million, which represents 39.5% of the total forecast growth for the decade.
This phase of growth will be shaped by rising demand for high-resolution displays, product innovation in OLED manufacturing processes and quantum dot technologies, and expanding smartphone and television manufacturing capabilities. Companies are establishing competitive positions through investment in advanced material synthesis, proprietary manufacturing processes, and strategic market expansion across consumer electronics, automotive displays, and emerging augmented reality applications.
From 2030 to 2035, the market is forecast to grow from USD 648.1 million to USD 992.6 million, adding another USD 344.5 million, which constitutes 60.5% of the overall ten-year expansion. This period is expected to be characterized by expansion of next-generation display technologies including micro-LED and flexible displays tailored for specific wearable devices and foldable applications, strategic collaborations between material suppliers and display manufacturers, and premium positioning with enhanced optical performance and environmental stability. The growing emphasis on energy efficiency and display quality optimization will drive demand for advanced photosensitive alignment films across diverse consumer electronics and professional display applications.
| Metric | Value |
|---|---|
| Market Value (2025) | USD 423.2 million |
| Market Forecast Value (2035) | USD 992.6 million |
| Forecast CAGR (2025 to 2035) | 9% |
The photosensitive alignment film market is growing because these materials enable precise liquid crystal alignment that improves display contrast ratios and viewing angles while reducing manufacturing defects. Key demand drivers include the expansion of OLED display production, which requires advanced alignment materials; the increasing demand for smartphone and television screen sizes, necessitating superior optical performance; the growing adoption of flexible display technologies for wearable devices and automotive applications; and rising consumer expectations for display quality across premium electronics segments.
Display manufacturing facilities represent the priority segment, while East Asia emerges as the leading region due to concentrated electronics manufacturing and technological advancement. Market growth faces realistic constraints from the high switching costs associated with changing established manufacturing processes and potential supply chain disruptions affecting specialized chemical precursors.
The photosensitive alignment film market (USD 423.2M → 992.6M by 2035, CAGR ~9%) is fueled by surging demand across display manufacturing, consumer electronics, and medical display equipment. UV light alignment films dominate LCD/OLED production, while polarized light alignment films support higher-contrast, high-resolution, and flexible displays. Growth is led by China (12.0% CAGR) and India (11.1%), with strong contributions from Germany (10.2%) and Brazil (9.3%). Together, these factors unlock ~USD 569.4M incremental opportunities by 2035.
Pathway A - UV Light Alignment Films for Display Manufacturing. Films optimized for LCD, OLED, and large-panel production, where precise alignment and thermal resistance are critical. Win themes: High UV sensitivity, low defect density, scalable coat/etch uniformity, eco-friendly solvent systems.
Pathway B - Polarized Light Alignment Films for Consumer Electronics. Materials for smartphones, tablets, AR/VR devices, and flexible displays requiring enhanced optical contrast and durability. Win themes: Polarization stability, high-resolution patterning (<1 µm), bend resistance, compatibility with foldable substrates.
Pathway C - Medical Display & Imaging Films. Specialized alignment films for diagnostic imaging systems, surgical displays, and precision optics in life sciences. Win themes: ISO 13485 compliance, biocompatibility, low blue-light degradation, high brightness/contrast retention.
Pathway D - Hybrid/Eco-Friendly Film Chemistries. Next-generation formulations that replace toxic solvents and improve recyclability in line with sustainability mandates. Win themes: Water-based coating systems, solvent-free formulations, RoHS/REACH compliance, low VOC emissions.
Pathway E - Smart/Functional Alignment Films. Emerging films with added properties for premium devices (self-healing, anti-glare, or sensor integration). Win themes: Embedded conductive/functional layers, self-repair chemistries, anti-reflective coatings, sensor-ready film stacks.
The market is segmented by film type, end-use industry, and region. By film type, the market is divided into UV light alignment films, polarized light alignment films, and others. By end-use industry, the market is categorized into display manufacturing industry, consumer electronics industry, medical display equipment industry, and others. Regionally, the market is divided into North America, Latin America, Europe, East Asia, South Asia & Pacific, and Middle East & Africa.
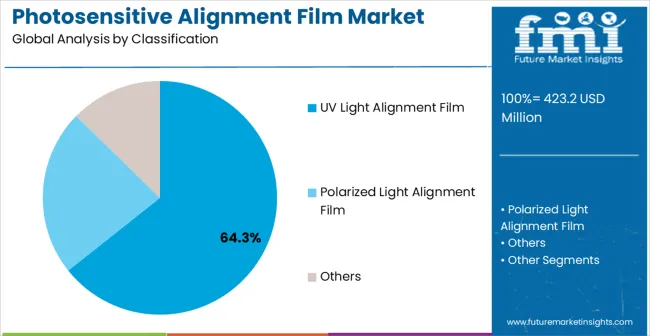
UV light alignment films are projected to account for 64.3% of the photosensitive alignment film market in 2025, positioning the segment as a key driver of market growth. The dominance of UV light films is supported by their superior processing efficiency and highly precise molecular alignment capabilities, which are critical for high-performance display manufacturing.
UV light alignment films ensure consistent alignment across large panels, reducing defects and improving optical uniformity, which directly enhances contrast, color accuracy, and viewing angles. The flexibility of UV exposure systems allows manufacturers to adjust exposure parameters and optimize processing cycles, facilitating rapid production without compromising quality.
Moreover, compatibility with existing photolithography equipment ensures cost-effective integration into established production lines, minimizing the need for extensive process modifications. As display technologies advance toward higher resolutions and emerging architectures like OLED and micro-LED, the demand for UV light alignment films grows, given their ability to meet increasingly stringent optical performance requirements. These films also reduce energy consumption and processing time compared to alternative alignment methods, contributing to operational efficiency and cost savings.
Key Features and Market Drivers:
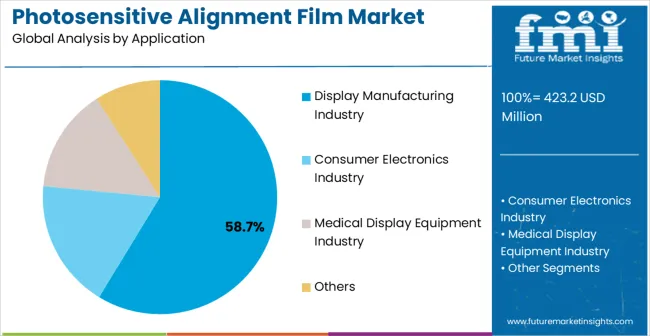
The display manufacturing industry segment is projected to account for 58.7% of photosensitive alignment film demand in 2025, reflecting its central role in modern display production. Alignment films are critical for achieving precise liquid crystal orientation in LCDs, OLEDs, and emerging micro-LED displays, directly impacting contrast ratio, color reproduction, and viewing angles.
Manufacturers rely on high-quality alignment films to maintain consistent production yields, reduce defect rates, and ensure superior optical performance across various panel sizes. The growing demand for large-format displays, high-resolution smartphones, tablets, and wearable electronics further drives the adoption of specialized alignment films.
Additionally, technological advancements in alignment materials facilitate compatibility with next-generation display architectures, supporting innovation in display performance and efficiency. Adoption of these films enables manufacturers to optimize production workflows, improve overall yield, and enhance the consistency of finished products. As global demand for advanced consumer electronics continues to rise, display manufacturers increasingly prioritize alignment films that provide both operational efficiency and reliable optical outcomes.
Key Drivers and Trends:
The photosensitive alignment film market is driven by three concrete demand drivers tied to manufacturing outcomes. Advanced display technology adoption requires alignment films that enable OLED and micro-LED manufacturing while achieving target optical performance specifications and production yield rates that justify capital investment. Consumer electronics demand for larger screens and higher resolutions drives adoption of alignment materials that provide superior uniformity across extended display areas while maintaining manufacturing cost effectiveness. Automotive display integration creates demand for alignment films that operate reliably across temperature variations and provide consistent optical performance throughout vehicle operational lifespans.
Market growth faces real frictions including high material development costs that require extensive R&D investment before achieving commercial viability, manufacturing process integration challenges that demand significant validation time and capital expenditure for equipment modifications, and supply chain concentration risks where specialized chemical precursors are available from limited suppliers. Alternative display technologies including e-paper and emerging holographic displays may reduce demand for traditional liquid crystal alignment solutions.
Key trends show adoption accelerating in flexible display manufacturing and automotive applications where specialized alignment requirements create differentiation opportunities through customized material solutions. Design shifts toward thinner films, improved environmental stability, and enhanced processing efficiency enable broader application adoption while reducing manufacturing complexity. Market expansion would face disruption if solid-state display technologies achieve commercial viability or if manufacturing costs for advanced alignment films remain prohibitively high for mainstream applications.
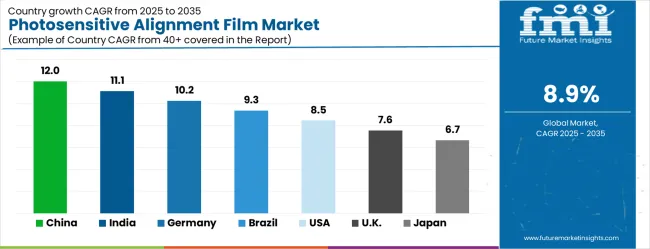
| Country | CAGR (2025 to 2035) |
|---|---|
| China | 12% |
| India | 11.1% |
| Germany | 10.2% |
| Brazil | 9.3% |
| USA | 8.5% |
| UK | 7.6% |
| Japan | 6.7% |
The photosensitive alignment film market is gathering pace worldwide, with China taking the lead thanks to massive display manufacturing capacity and comprehensive electronics supply chain integration. Close behind, India benefits from growing consumer electronics production and increasing investment in display manufacturing infrastructure, positioning itself as a strategic growth hub.
Germany shows steady advancement, where precision chemical manufacturing capabilities strengthen its role in the regional supply chain. Brazil is sharpening focus on consumer electronics assembly and display integration technologies, signaling an ambition to capture niche opportunities.
Meanwhile, the United States stands out for its technological innovation leadership, and the United Kingdom and Japan continue to record consistent progress. Together, China and India anchor the global expansion story, while the rest build stability and diversity into the market's growth path.
The report covers an in-depth analysis of 40+ countries top-performing countries are highlighted below.
China demonstrates the strongest growth potential in the photosensitive alignment film market, owing to its comprehensive display manufacturing infrastructure and advanced material processing capabilities across major electronics hubs. The country’s market is projected to expand at a CAGR of 12% through 2035, driven by the rapid expansion of OLED production in Shenzhen, Shanghai, and Beijing, as well as increasing volumes of smartphone and television manufacturing.
Chinese display manufacturers are increasingly adopting photosensitive alignment films as essential processing materials, enabling high-yield production of advanced displays while meeting international quality standards. Domestic chemical companies are developing specialized alignment film formulations, which reduce reliance on imports and lower overall manufacturing costs.
Additionally, integrated electronics manufacturing clusters provide end-to-end supply chain support, facilitating the rapid adoption of next-generation alignment technologies. Government-backed programs further bolster domestic capabilities by promoting innovation in high-performance films, supporting research and development initiatives, and ensuring China maintains its leadership position in global display production. The combination of manufacturing scale, technological innovation, and supply chain integration establishes China as the primary growth engine for the photosensitive alignment film market.
Key Drivers and Trends:
Photosensitive alignment film market in India is witnessing strong growth, particularly in electronics manufacturing hubs such as Bangalore and Chennai, where companies are expanding display assembly capabilities for domestic consumption and exports. The market is projected to grow at a CAGR of 11.1% through 2035, underpinned by government initiatives aimed at promoting electronics manufacturing and investments in display production infrastructure.
Indian manufacturers are increasingly implementing international quality standards, which necessitate advanced alignment materials to achieve competitive performance in smartphones, televisions, and other display devices. Technology transfer programs and foreign direct investment facilitate access to specialized chemical manufacturing capabilities, enabling domestic firms to produce high-quality films previously unavailable in traditional industrial sectors.
This growth reflects India’s strategic focus on positioning itself as a global electronics manufacturing hub by combining policy support, industrial expansion, and technological adoption. Additionally, the rising middle class and increasing consumer demand for high-quality displays further reinforce market expansion.
Domestic manufacturers are increasingly partnering with international technology providers to ensure that products meet stringent optical performance and reliability standards, supporting long-term competitiveness in both domestic and export markets.
Key Drivers and Trends:
Photosensitive alignment film market in Germany benefits from the country’s longstanding expertise in chemical manufacturing and precision engineering, supporting premium positioning for specialized formulations used in both automotive and industrial display applications.
The market is projected to grow at a CAGR of 10.2% through 2035, driven by advanced research and development capabilities concentrated in Munich, Frankfurt, and Hamburg. German chemical companies collaborate closely with display technology developers to create next-generation alignment materials optimized for high-performance and demanding applications.
The country’s reputation for reliability, precision, and quality assurance ensures that alignment films meet stringent optical and environmental standards, supporting both domestic usage and exports to global display manufacturers.
Specialized applications, such as automotive displays, require films capable of consistent operation across extended temperature ranges and variable environmental conditions, further reinforcing market demand. The integration of chemical innovation, manufacturing precision, and international collaboration positions Germany as a key supplier of high-quality alignment films in Europe, ensuring sustained growth through technical excellence and specialized product offerings.
Key Drivers and Trends:
Photosensitive alignment film market in Brazil demonstrates consistent development due to the expansion of consumer electronics manufacturing and the increasing adoption of advanced display technologies in industrial regions such as São Paulo, Rio de Janeiro, and Manaus. The market is projected to expand steadily as manufacturers adopt alignment films to improve the quality of smartphones, televisions, and other display devices.
Growth is closely linked to modernization of the electronics assembly industry, where traditional operations are gradually incorporating advanced materials and processing technologies to meet global quality standards. A significant challenge in Brazil involves developing technical expertise for handling specialized chemical materials and processes, requiring ongoing training programs and technical support from material suppliers.
Additionally, industrial development initiatives and technology transfer programs provide access to international display manufacturing expertise, enabling local manufacturers to implement best practices and achieve high-performance outputs. These factors collectively support Brazil’s steady market growth and enable the country to enhance its competitiveness in domestic production and export markets, while contributing to broader industrial modernization efforts.
Key Drivers and Trends:
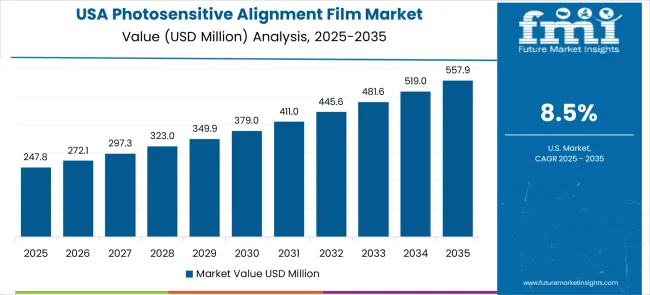
The United States maintains leadership in the photosensitive alignment film market through technological innovation, focusing on high-performance materials for aerospace, defense, medical, and premium consumer electronics displays. The market is projected to grow at a CAGR of 8.5% through 2035, underpinned by research institutions and specialty chemical manufacturers developing next-generation films with exceptional reliability, optical performance, and environmental stability.
USA adoption is influenced by stringent regulatory compliance requirements, ensuring that alignment films meet safety and performance standards across critical applications. Collaborative initiatives between research institutions, specialty chemical manufacturers, and electronics companies accelerate the development of customized alignment film solutions for high-performance applications.
Additionally, American companies prioritize integration of alignment films into advanced display architectures, including micro-LED and OLED panels, for aerospace, defense, and medical devices, where precision and reliability are critical. This combination of innovation, regulatory compliance, and technical expertise ensures that the USA remains a global leader in high-performance alignment film technology, while enabling manufacturers to maintain both domestic and international market competitiveness.
Key Drivers and Trends:
The United Kingdom’s photosensitive alignment film market exhibits medium growth characteristics, driven by established chemical manufacturing capabilities and advanced research institutions supporting specialty applications in medical, scientific, and industrial equipment. The market is projected to grow at a CAGR of 7.6%, reflecting consistent adoption in applications where material performance requirements justify premium costs.
UK manufacturers focus on developing alignment films with enhanced optical performance, environmental stability, and reliability to meet rigorous specifications for critical scientific and medical displays. Collaboration between research institutions and chemical companies fosters innovation, enabling the creation of materials tailored to high-performance applications.
Government programs supporting research and development, along with private sector investment in specialty equipment manufacturing, further reinforce the adoption of advanced alignment materials. This combination of technical innovation, specialized application focus, and research collaboration ensures steady growth for the UK market while establishing it as a hub for high-performance, niche alignment film technologies that support both domestic and export opportunities.
Key Drivers and Trends:
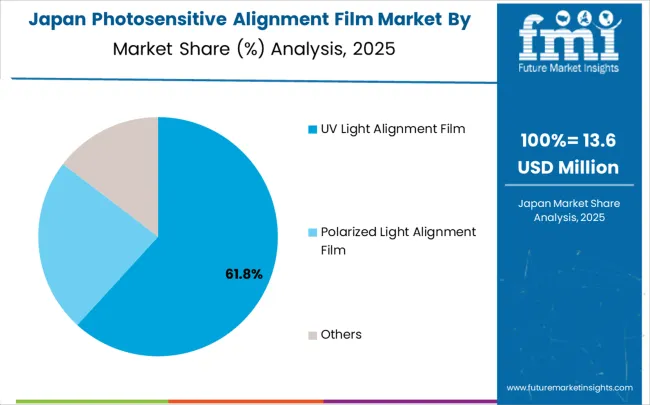
Japan represents a mature and technologically sophisticated market for photosensitive alignment films, characterized by high expectations among display manufacturers and electronics companies. The market is projected to grow at a CAGR of 6.7% through 2035, with material quality, reliability, and technical innovation determining purchasing decisions over cost considerations.
Japanese display facilities prioritize alignment films that provide superior engineering precision, validated performance, and long-term manufacturing consistency, supporting high-end LCD, OLED, and micro-LED production. Advanced manufacturing processes, coupled with rigorous quality standards, ensure consistent optical performance and long-term reliability.
Collaboration between industry and academic institutions fosters research into next-generation materials, enabling Japan to maintain a leadership position in precision alignment technologies. Export opportunities further strengthen the country’s global influence while sustaining domestic competitiveness. Japanese manufacturers emphasize both technological sophistication and stringent performance validation, making the country a benchmark for high-quality, precision-engineered alignment films that serve critical display applications worldwide.
Key Drivers and Trends:
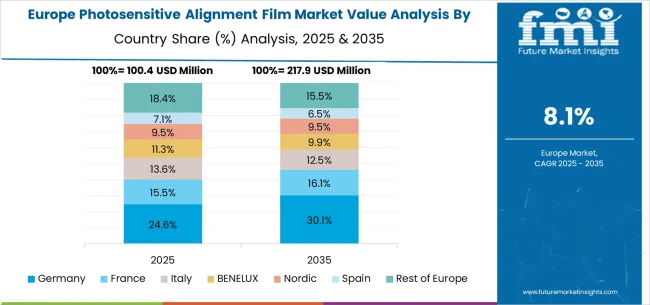
The European photosensitive alignment film market represents a sophisticated regional ecosystem where advanced chemical manufacturing capabilities and precision electronics production create integrated demand for high-performance display materials. Northern European countries including Germany and the United Kingdom provide technology leadership through chemical engineering excellence and specialized material development that influences product advancement across the broader European electronics manufacturing sector.
Central European markets demonstrate growing investment in electronics manufacturing and display assembly capabilities that require advanced alignment materials for achieving competitive product quality. Mediterranean markets show increasing adoption of display technologies as consumer electronics companies establish regional manufacturing operations and industrial facilities implement advanced display systems for automation and control applications.
The regional integration enables technology sharing, collaborative research programs, and standardized material specifications that accelerate market development while maintaining high technical standards across diverse electronics and display manufacturing applications.
The photosensitive alignment film market demonstrates moderate concentration with approximately 12-15 meaningful players competing globally, where market concentration shows the top five companies controlling roughly 60-65% of total market value through technological expertise, established customer relationships, and comprehensive material development capabilities. Competition style emphasizes technical differentiation, application-specific expertise, and manufacturing integration support rather than price competition, as customers prioritize performance and reliability when investing in critical display manufacturing materials.
Market Leaders: JSR Corporation, Nissan Chemical Corporation, and Merck Group maintain competitive advantages through comprehensive material portfolios, established display manufacturer relationships, and advanced research and development capabilities that enable continuous technology advancement. These companies leverage superior chemical synthesis expertise, extensive patent portfolios, and integrated technical support programs to develop cutting-edge alignment films that meet demanding performance requirements across diverse display applications. Their market positions benefit from decades of experience in specialty chemical manufacturing and established trust relationships with major display manufacturers worldwide.
Technology Challengers: Dongjin Semichem Co., Ltd., DuPont de Nemours, Inc., and Mitsubishi Chemical Corporation compete through specialized expertise in specific application areas, innovative material development, and competitive pricing strategies that challenge established leaders in targeted market segments or geographic regions. These companies often lead in particular performance categories or application niches, providing advanced solutions for demanding alignment requirements that established leaders may not address comprehensively.
Regional Specialists: Sumitomo Chemical Co.,Ltd., Daxin Materials Co.,Ltd., and Winscene Technology Co.,Ltd.serve specific markets through focused product development, regional manufacturing capabilities, and localized technical support that addresses unique customer requirements and regulatory specifications within their geographic focus areas. These companies contribute market diversity through alternative technology approaches and specialized application focus that serves previously underaddressed market segments.
| Item | Value |
|---|---|
| Quantitative Units | USD 423.2 million |
| Film Type | UV Light Alignment Film, Polarized Light Alignment Film, Others |
| End-Use Industry | Display Manufacturing Industry, Consumer Electronics Industry, Medical Display Equipment Industry, Others |
| Regions Covered | North America, Latin America, Europe, East Asia, South Asia & Pacific, Middle East & Africa |
| Country Covered | United States, Canada, United Kingdom, Germany, France, China, Japan, South Korea, India, Brazil, Australia and 40+ countries |
| Key Companies Profiled | JSR Corporation, Nissan Chemical Corporation, Dongjin Semichem Co., Ltd., Merck Group, DuPont de Nemours, Inc., Mitsubishi Chemical Corporation, Sumitomo Chemical Co., Ltd., Daxin Materials Co., Ltd., Winscene Technology Co., Ltd. |
| Additional Attributes | Dollar sales by film type and end-use applications, regional display manufacturing trends across North America, Europe, and Asia-Pacific, competitive landscape with established chemical manufacturers and specialized material suppliers, adoption patterns for UV versus polarized light alignment technologies, integration with display manufacturing processes and quality control systems, innovations in material formulations and processing techniques, and development of next-generation alignment films with enhanced optical performance and environmental stability for demanding display applications. |
The global photosensitive alignment film market is estimated to be valued at USD 423.2 million in 2025.
The market size for the photosensitive alignment film market is projected to reach USD 992.6 million by 2035.
The photosensitive alignment film market is expected to grow at a 8.9% CAGR between 2025 and 2035.
The key product types in photosensitive alignment film market are uv light alignment film, polarized light alignment film and others.
In terms of application, display manufacturing industry segment to command 58.7% share in the photosensitive alignment film market in 2025.


Our Research Products

The "Full Research Suite" delivers actionable market intel, deep dives on markets or technologies, so clients act faster, cut risk, and unlock growth.

The Leaderboard benchmarks and ranks top vendors, classifying them as Established Leaders, Leading Challengers, or Disruptors & Challengers.

Locates where complements amplify value and substitutes erode it, forecasting net impact by horizon

We deliver granular, decision-grade intel: market sizing, 5-year forecasts, pricing, adoption, usage, revenue, and operational KPIs—plus competitor tracking, regulation, and value chains—across 60 countries broadly.

Spot the shifts before they hit your P&L. We track inflection points, adoption curves, pricing moves, and ecosystem plays to show where demand is heading, why it is changing, and what to do next across high-growth markets and disruptive tech

Real-time reads of user behavior. We track shifting priorities, perceptions of today’s and next-gen services, and provider experience, then pace how fast tech moves from trial to adoption, blending buyer, consumer, and channel inputs with social signals (#WhySwitch, #UX).

Partner with our analyst team to build a custom report designed around your business priorities. From analysing market trends to assessing competitors or crafting bespoke datasets, we tailor insights to your needs.
Supplier Intelligence
Discovery & Profiling
Capacity & Footprint
Performance & Risk
Compliance & Governance
Commercial Readiness
Who Supplies Whom
Scorecards & Shortlists
Playbooks & Docs
Category Intelligence
Definition & Scope
Demand & Use Cases
Cost Drivers
Market Structure
Supply Chain Map
Trade & Policy
Operating Norms
Deliverables
Buyer Intelligence
Account Basics
Spend & Scope
Procurement Model
Vendor Requirements
Terms & Policies
Entry Strategy
Pain Points & Triggers
Outputs
Pricing Analysis
Benchmarks
Trends
Should-Cost
Indexation
Landed Cost
Commercial Terms
Deliverables
Brand Analysis
Positioning & Value Prop
Share & Presence
Customer Evidence
Go-to-Market
Digital & Reputation
Compliance & Trust
KPIs & Gaps
Outputs
Full Research Suite comprises of:
Market outlook & trends analysis
Interviews & case studies
Strategic recommendations
Vendor profiles & capabilities analysis
5-year forecasts
8 regions and 60+ country-level data splits
Market segment data splits
12 months of continuous data updates
DELIVERED AS:
PDF EXCEL ONLINE
Photosensitive Semiconductor Market Size and Share Forecast Outlook 2025 to 2035
Frame Alignment Systems Market Size and Share Forecast Outlook 2025 to 2035
Film Wrapped Wire Market Size and Share Forecast Outlook 2025 to 2035
Film-Insulated Wire Market Size and Share Forecast Outlook 2025 to 2035
Film Forming Starches Market Size and Share Forecast Outlook 2025 to 2035
Film Formers Market Size and Share Forecast Outlook 2025 to 2035
Film Capacitors Market Analysis & Forecast by Material, Application, End Use, and Region Through 2035
Film Tourism Industry Analysis by Type, by End User, by Tourist Type, by Booking Channel, and by Region - Forecast for 2025 to 2035
Filmic Tapes Market
PC Film for Face Shield Market Size and Share Forecast Outlook 2025 to 2035
PE Film Market Insights – Growth & Forecast 2024-2034
PET Film for Face Shield Market Size and Share Forecast Outlook 2025 to 2035
VCI Film Market Forecast and Outlook 2025 to 2035
TPE Films and Sheets Market Size and Share Forecast Outlook 2025 to 2035
PET Film Coated Steel Coil Market Size and Share Forecast Outlook 2025 to 2035
PSA Film Market Analysis - Size, Share, and Forecast Outlook 2025 to 2035
Breaking Down PCR Films Market Share & Industry Positioning
PCR Films Market Analysis by PET, PS, PVC Through 2035
PBS Film Market Trends & Industry Growth Forecast 2024-2034
Microfilm Reader Market Size and Share Forecast Outlook 2025 to 2035

Thank you!
You will receive an email from our Business Development Manager. Please be sure to check your SPAM/JUNK folder too.
Chat With
MaRIA