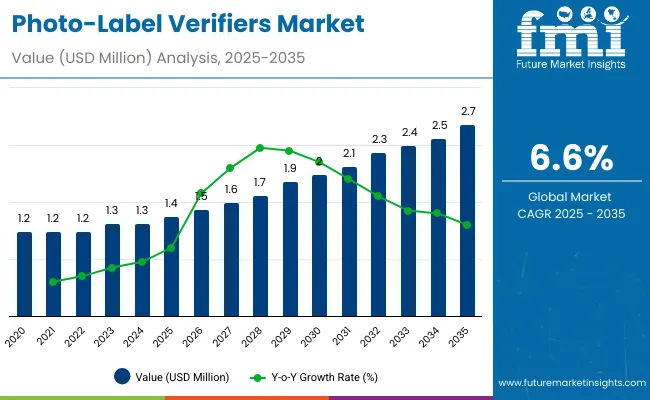
The photo-label verifiers market will expand from USD 1.4 billion in 2025 to USD 2.7 billion by 2035, registering a CAGR of 6.6%. Growth is fueled by automation in packaging lines and rising emphasis on product authenticity. AI-powered label recognition and optical vision systems enhance label verification precision across FMCG, food, and healthcare sectors. Between 2025 and 2030, USD 0.6 billion growth will come from automated inspection systems. By 2035, smart vision integration and real-time traceability adoption will accelerate expansion, ensuring high-speed label accuracy and compliance.
| Metric | Value |
|---|---|
| Industry Size (2025E) | USD 1.4 billion |
| Industry Value (2035F) | USD 2.7 billion |
| CAGR (2025 to 2035) | 6.6% |
Between 2020 and 2024, demand for label verification surged with traceability mandates and packaging automation in FMCG and pharma industries. Integration of AI and vision-based tools improved error detection. By 2035, the market will reach USD 2.7 billion, powered by deep learning algorithms, smart sensor fusion, and cloud-based verification analytics. Asia-Pacific and North America will lead, driven by manufacturing upgrades and compliance with evolving labeling regulations.
Growth in the market is driven by digital transformation in labeling automation and the enforcement of global packaging accuracy standards. The rise of counterfeiting, e-commerce logistics, and pharmaceutical safety has accelerated the deployment of AI-powered verifiers. Manufacturers are adopting multi-angle inspection systems for instant barcode and print validation, ensuring efficiency, accuracy, and traceability throughout packaging lines.
The market is segmented by technology, label type, application, end-use industry, and region. Technology includes AI-powered label recognition, machine vision systems, optical verification, and UV light scanning. Label types include plastic, paper, foil, and transparent labels. Major applications include barcode and QR verification, color inspection, and tamper-proof validation.
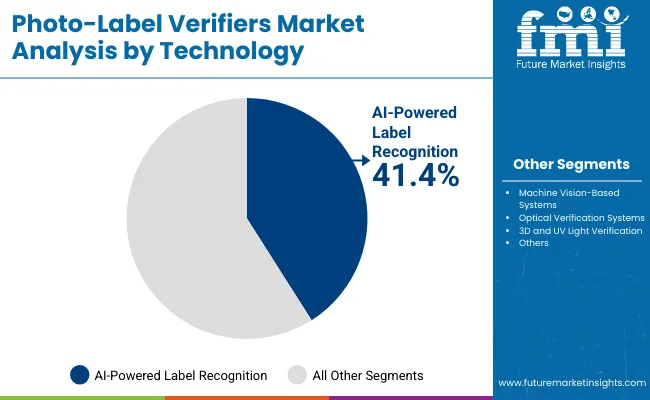
AI-powered label recognition will account for 41.4% share in 2025, driven by machine learning-based image processing. These systems enable automatic defect detection at high line speeds. By 2035, deep neural networks and 3D camera modules will dominate for real-time verification across pharmaceuticals and beverage packaging, enhancing speed, accuracy, and sustainability compliance.
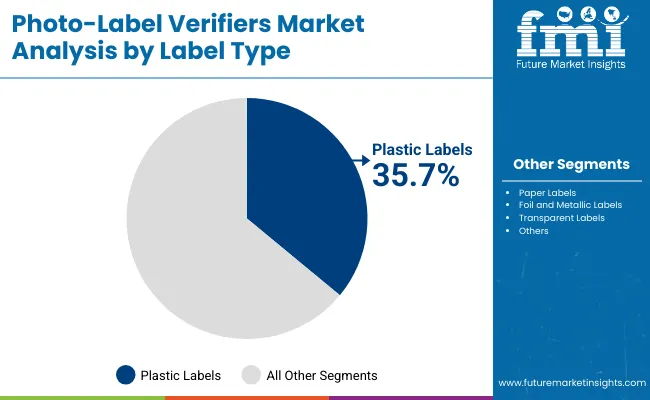
Plastic labels will capture 35.7% share in 2025 due to widespread use in beverages and consumer goods. These labels offer durability, moisture resistance, and optical clarity. By 2035, recyclable polymer-based labels will expand their adoption, paired with transparent UV-verification compatibility to ensure traceable labeling and waste minimization.
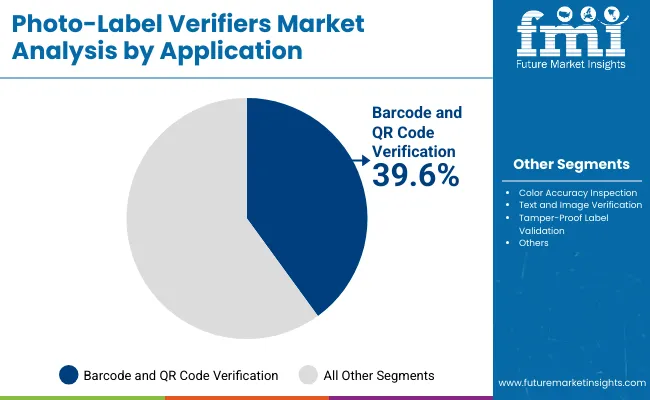
Barcode and QR code verification will command 39.6% share in 2025 due to expanding traceability and logistics requirements. Integration of smart sensors ensures label consistency and printing precision. By 2035, AI-driven verification lines with integrated serialization will help prevent mislabeling in fast-paced packaging environments.
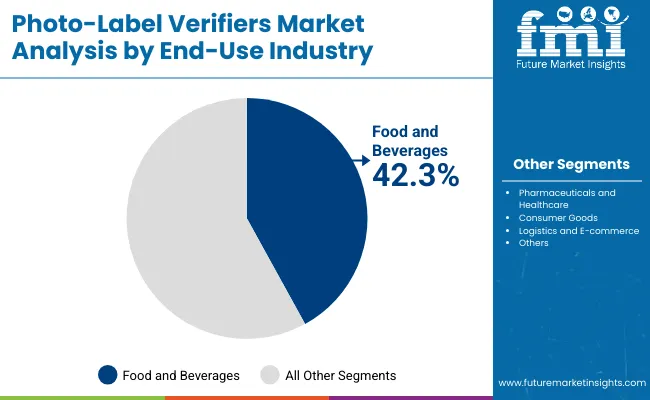
The food and beverages segment will account for 42.3% share in 2025, propelled by demand for accurate expiry and origin labeling. Automated verification ensures traceability and compliance with food safety standards. By 2035, digitized inspection systems equipped with cloud analytics will enhance real-time monitoring and traceable packaging certification.
Rising automation in packaging and stringent labeling standards drive market growth. The deployment of machine vision verifiers ensures labeling accuracy and anti-counterfeiting protection across industries.
High installation costs and integration complexity limit adoption among SMEs, while environmental variability affects system reliability.
Expansion in smart factories and Industry 4.0 initiatives enables AI-driven verification systems with predictive defect analytics and data connectivity.
Key trends include 3D label verification, machine learning for defect classification, integration of IoT-enabled label monitoring, and energy-efficient camera modules optimizing production in food and pharma packaging.
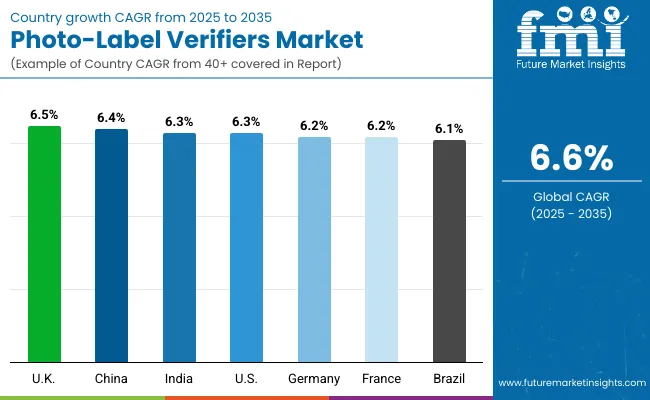
The global photo-label verifiers market is expanding rapidly as AI and machine vision redefine labeling accuracy and traceability across packaging industries. Asia-Pacific leads growth through large-scale automation and investment in smart packaging infrastructure, while Europe focuses on regulatory compliance, serialization, and precision inspection systems. North America’s adoption is driven by Industry 4.0 transformation and logistics optimization. The integration of AI-driven inspection, cloud-based verification, and 3D imaging continues to enhance product authentication and packaging quality worldwide.
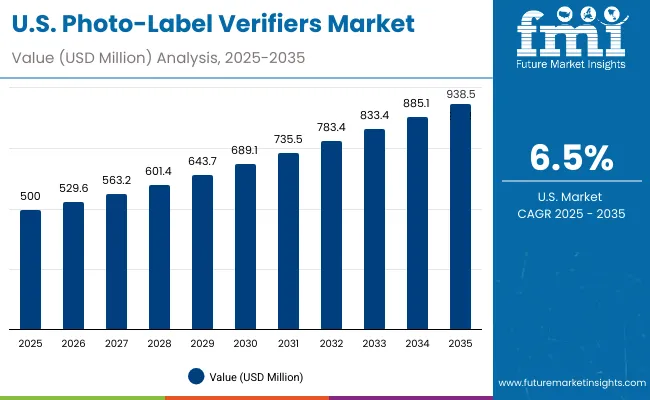
The USA will grow at 6.5% CAGR, driven by Industry 4.0 automation and increasing use of smart packaging solutions. AI-enabled inspection systems are improving label accuracy and reducing downtime in high-speed packaging lines. Regulatory alignment with FDA serialization and traceability rules is strengthening adoption in pharmaceuticals and food sectors. The integration of IoT-driven traceability tools across logistics networks is further enhancing supply chain transparency and efficiency.
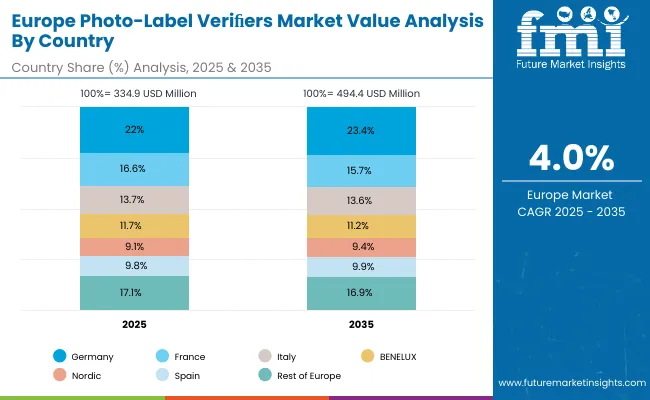
Germany will expand at 6.2% CAGR, emphasizing automated label verification under EU packaging and traceability directives. Smart label analytics systems ensure compliance with serialization and product safety standards. Robotics integration is driving R&D in precision labeling and camera calibration technologies. Growing demand from food, beverage, and pharmaceutical industries continues to fuel adoption of AI-based visual verification systems.
The UK will grow at 6.3% CAGR, supported by the rise of digital inspection systems in FMCG manufacturing. AI vision platforms are enhancing barcode and data matrix code consistency across production lines. Cloud-based error tracking tools are improving accuracy and reducing product recalls. Growing exports of smart labeling solutions and compliance-driven automation are reinforcing the UK’s foothold in packaging verification technology.
China will grow at 6.4% CAGR, propelled by its investments in smart packaging and serialization compliance. Vision system deployment across large-scale factories supports efficient mass production and quality control. OEMs are expanding AI verification systems to meet the demands of both domestic and export packaging standards. Continuous upgrades in traceability infrastructure are driving stronger international competitiveness for Chinese manufacturers.
India will grow at 6.3% CAGR, driven by automation acceleration in packaging, labeling, and FMCG sectors. Stricter labeling and serialization standards are increasing the need for verification systems. Local machine manufacturers are developing cost-effective vision-based verifiers for mid-scale production facilities. The government’s digital manufacturing initiatives are further enabling widespread adoption across industrial and retail packaging lines.
Japan will grow at 6.9% CAGR, supported by advancements in precision manufacturing and AI-based inspection systems. Compact photo-label verifiers are increasingly used in food and beverage lines for high-speed accuracy. Robotics integration enhances visual analytics and enables seamless camera calibration. Continued investment in local R&D and sensor innovation is improving system reliability and inspection accuracy in industrial environments.
South Korea will lead with 7.0% CAGR, driven by AI imaging and smart packaging innovation. Advanced 3D scanning technologies ensure optical precision for pharmaceutical and electronics labeling. Regulatory pressure on serialization compliance is expanding the adoption of automated label verification. Growing export activity in labeling equipment and industrial robotics is positioning South Korea as a leading supplier of next-generation photo-verification systems.
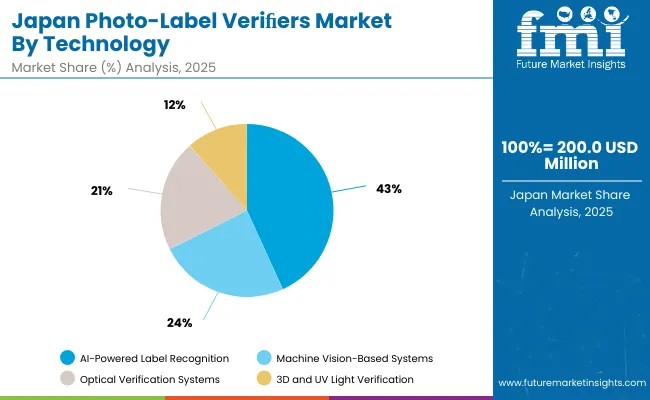
Japan’s photo-label verifiers market, valued at USD 200.0 million in 2025, is dominated by AI-powered label recognition systems due to their unmatched accuracy and automation compatibility. Machine vision-based systems continue to grow in demand, enabling real-time defect detection on high-speed production lines. Optical verification systems remain essential in pharmaceutical and food labeling compliance, while 3D and UV light verification ensures security against counterfeit packaging. Japan’s advanced industrial base drives integration of intelligent, data-driven label inspection solutions.
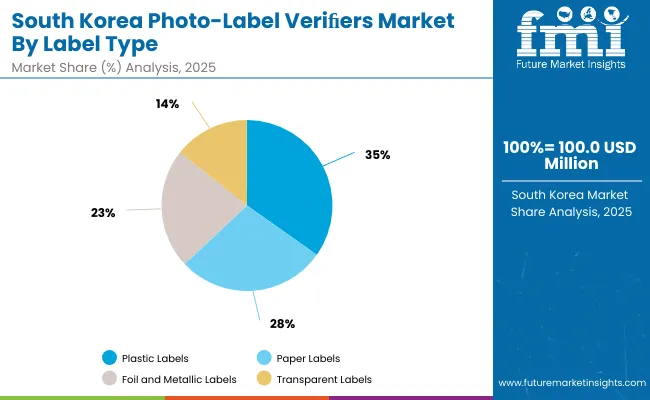
South Korea’s photo-label verifiers market, valued at USD 100.0 million in 2025, is led by plastic labels owing to their durability and clarity across consumer goods and electronics packaging. Paper labels maintain a strong foothold due to cost efficiency and eco-friendly attributes. Foil and metallic labels serve premium and tamper-evident applications, while transparent labels enhance design flexibility and brand aesthetics. South Korea’s manufacturing precision and packaging innovation continue to foster label diversification in automated inspection systems.
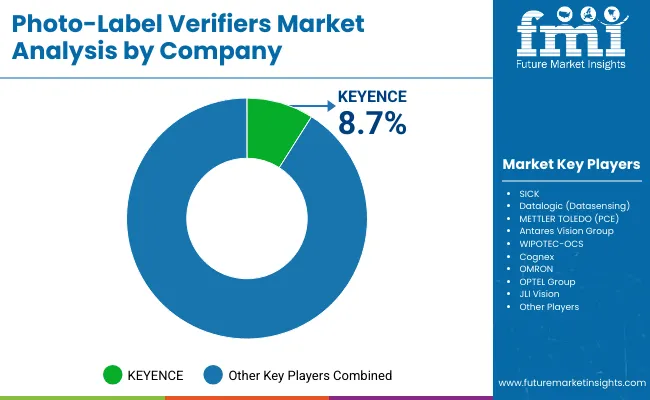
The market is moderately consolidated with KEYENCE, SICK, Datalogic (Datasensing), METTLER TOLEDO (PCE), Antares Vision Group, WIPOTEC-OCS, Cognex, OMRON, OPTEL Group, and JLI Vision leading global operations. KEYENCE and Cognex dominate with deep-learning camera systems, while Antares Vision and WIPOTEC lead in pharmaceutical serialization. Emerging players in Asia-Pacific focus on modular, low-cost AI verifiers integrated with cloud analytics for small manufacturers.
Key Developments of Photo-Label Verifiers Market
| Item | Value |
|---|---|
| Quantitative Units | USD 1.4 Billion |
| By Technology | AI Recognition, Vision-Based, Optical, UV Verification |
| By Label Type | Plastic, Paper, Foil, Transparent |
| By Application | Barcode/QR Verification, Color Inspection, Tamper-Proof Validation |
| By End-Use Industry | Food & Beverages, Pharma, Consumer Goods, Logistics |
| Key Companies Profiled | KEYENCE, SICK, Datalogic (Datasensing), METTLER TOLEDO (PCE), Antares Vision Group, WIPOTEC-OCS, Cognex, OMRON, OPTEL Group, JLI Vision |
| Additional Attributes | Driven by automation, regulatory compliance, and smart packaging technology. |
The Photo-Label Verifiers Market is valued at USD 1.4 billion in 2025.
The market is projected to reach USD 2.7 billion by 2035.
The Photo-Label Verifiers Market will expand at a CAGR of 6.6%.
AI-powered label recognition systems lead with 41.4% share in 2025.
The food and beverages industry leads with 42.3% market share in 2025.


Our Research Products

The "Full Research Suite" delivers actionable market intel, deep dives on markets or technologies, so clients act faster, cut risk, and unlock growth.

The Leaderboard benchmarks and ranks top vendors, classifying them as Established Leaders, Leading Challengers, or Disruptors & Challengers.

Locates where complements amplify value and substitutes erode it, forecasting net impact by horizon

We deliver granular, decision-grade intel: market sizing, 5-year forecasts, pricing, adoption, usage, revenue, and operational KPIs—plus competitor tracking, regulation, and value chains—across 60 countries broadly.

Spot the shifts before they hit your P&L. We track inflection points, adoption curves, pricing moves, and ecosystem plays to show where demand is heading, why it is changing, and what to do next across high-growth markets and disruptive tech

Real-time reads of user behavior. We track shifting priorities, perceptions of today’s and next-gen services, and provider experience, then pace how fast tech moves from trial to adoption, blending buyer, consumer, and channel inputs with social signals (#WhySwitch, #UX).

Partner with our analyst team to build a custom report designed around your business priorities. From analysing market trends to assessing competitors or crafting bespoke datasets, we tailor insights to your needs.
Supplier Intelligence
Discovery & Profiling
Capacity & Footprint
Performance & Risk
Compliance & Governance
Commercial Readiness
Who Supplies Whom
Scorecards & Shortlists
Playbooks & Docs
Category Intelligence
Definition & Scope
Demand & Use Cases
Cost Drivers
Market Structure
Supply Chain Map
Trade & Policy
Operating Norms
Deliverables
Buyer Intelligence
Account Basics
Spend & Scope
Procurement Model
Vendor Requirements
Terms & Policies
Entry Strategy
Pain Points & Triggers
Outputs
Pricing Analysis
Benchmarks
Trends
Should-Cost
Indexation
Landed Cost
Commercial Terms
Deliverables
Brand Analysis
Positioning & Value Prop
Share & Presence
Customer Evidence
Go-to-Market
Digital & Reputation
Compliance & Trust
KPIs & Gaps
Outputs
Full Research Suite comprises of:
Market outlook & trends analysis
Interviews & case studies
Strategic recommendations
Vendor profiles & capabilities analysis
5-year forecasts
8 regions and 60+ country-level data splits
Market segment data splits
12 months of continuous data updates
DELIVERED AS:
PDF EXCEL ONLINE

Thank you!
You will receive an email from our Business Development Manager. Please be sure to check your SPAM/JUNK folder too.
Chat With
MaRIA