Methodology

Photostability Chamber Market Size and Share Forecast Outlook 2025 to 2035

The Photostability Chamber Market is estimated to be valued at USD 1.5 billion in 2025 and is projected to reach USD 2.6 billion by 2035, registering a compound annual growth rate (CAGR) of 5.2% over the forecast period.
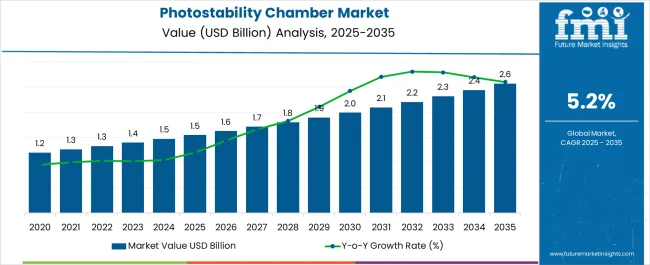
Quick Stats for Photostability Chamber Market

  • Photostability Chamber Market Value (2025): USD 1.5 billion
  • Photostability Chamber Market Forecast Value (2035): USD 2.6 billion
  • Photostability Chamber Market Forecast CAGR: 5.2%
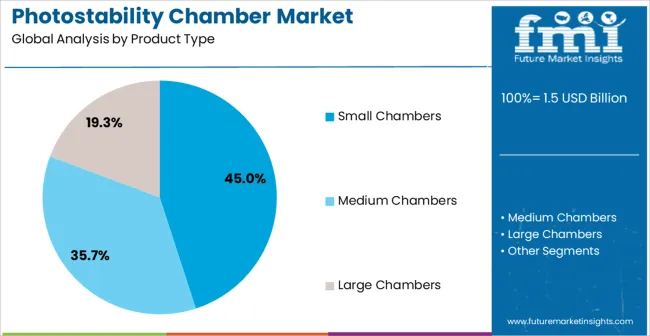
  • Leading Segment in Photostability Chamber Market in 2025: Small Chambers (45.0%)
  • Key Growth Regions in Photostability Chamber Market: North America, Asia-Pacific, Europe
  • Top Key Players in Photostability Chamber Market: Labrep Co, Labonce, Espec Corp., Caron

Photostability Chamber Market Market Value Analysis

Photostability Chamber Market Key Takeaways

Metric Value
Photostability Chamber Market Estimated Value in (2025 E) USD 1.5 billion
Photostability Chamber Market Forecast Value in (2035 F) USD 2.6 billion
Forecast CAGR (2025 to 2035) 5.2%

Why is the Photostability Chamber Market Growing?

Market Overview:

The Photostability Chamber market is being driven by growing demand from pharmaceutical, biotechnology, and chemical industries that require stability testing under controlled light and temperature conditions. The current market environment reflects increasing regulatory requirements for product validation, shelf life determination, and quality assurance, particularly in regions with stringent drug approval protocols. Rising investments in research and development facilities, as well as expansions in contract research organizations, are contributing to the broader adoption of advanced stability chambers.

The growing emphasis on regulatory compliance for product packaging, formulations, and manufacturing processes is expected to propel the market forward. Moreover, the trend toward miniaturization and modular laboratory equipment is creating new opportunities for customized chambers that meet specific testing requirements.

Looking ahead, technological enhancements such as improved light uniformity, energy efficiency, and integrated monitoring systems are anticipated to create further growth prospects The market is expected to benefit from increased global clinical trials and faster time-to-market initiatives, with demand being supported by both established players and new entrants seeking precise testing solutions.

Segmental Analysis

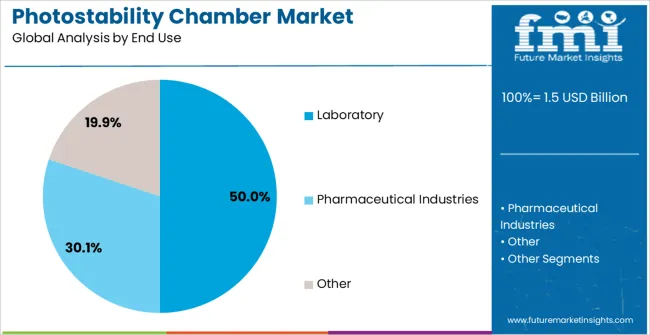
The photostability chamber market is segmented by product type, end use, and geographic regions. By product type, photostability chamber market is divided into Small Chambers, Medium Chambers, and Large Chambers. In terms of end use, photostability chamber market is classified into Laboratory, Pharmaceutical Industries, and Other. Regionally, the photostability chamber industry is classified into North America, Latin America, Western Europe, Eastern Europe, Balkan & Baltic Countries, Russia & Belarus, Central Asia, East Asia, South Asia & Pacific, and the Middle East & Africa.
Insights into the Small Chambers Segment

Photostability Chamber Market Analysis By Product Type

The small chambers segment is projected to hold 45.00% of the Photostability Chamber market revenue share in 2025, establishing it as the leading product type. This position is being attributed to its compact size, ease of installation, and cost efficiency, which align with the needs of laboratories and research facilities operating under space and budget constraints. The portability of small chambers has allowed them to be deployed across various environments, including academic research centers, contract research laboratories, and small to medium pharmaceutical units.

Additionally, the reduced energy consumption and simplified maintenance protocols associated with these chambers have increased their preference over larger units. Their capability to perform standardized stability testing without the need for extensive infrastructure has made them suitable for early-stage research and formulation trials.

The rising adoption of single or multiple batch testing workflows further supports their integration into laboratory setups The segment’s growth is also being fostered by rising demand for fast and reliable stability testing in emerging markets where cost and space are significant factors in equipment procurement decisions.
Insights into the Laboratory Segment

Photostability Chamber Market Analysis By End Use

The laboratory end use segment is expected to account for 50.00% of the Photostability Chamber market revenue share in 2025, making it the largest consumer among all applications. This dominant position is being driven by laboratories’ critical role in conducting stability studies required for product development, regulatory filings, and quality control processes. The preference for laboratory use has been supported by strict guidelines for accelerated and long-term testing, requiring chambers that offer uniform lighting, temperature control, and monitoring systems.

Laboratories engaged in pharmaceutical research, nutraceutical testing, and material evaluation have increasingly incorporated photostability chambers as part of their standard equipment portfolio. The segment’s growth has been further enhanced by rising clinical trials and expanded research facilities across key regions.

With the growing need to validate formulations under various stress conditions and meet global regulatory requirements, laboratory-based testing is being prioritized as a fundamental component of product development pipelines The demand for chambers that offer reproducibility, efficiency, and compliance has ensured that laboratory deployments continue to expand, supporting overall market growth.

Market Overview

Photostability Chamber Market: Overview

Photostability chamber is specially designed to operate near ultraviolet and visual light examination with fluorescent lamps. The Photostability chamber also regulates light and temperature conditions through simple to use touch tablet interface.

The primary principle on which photostability chamber works as it caters uniform distribution of light and allows high-intensity levels to the pharmaceutical products. The photostability chamber allows confirmatory studies and degradation testing to check any physical changes in the dosage. Furthermore, increasing use of plastics in various sectors such as automotive, electronic & electrical industries, industrial applications, medical areas, and others.

The global market for photostability chamber is estimated to grow in the forecast period as the demand for plastics and polymeric materials is continuously increasing.
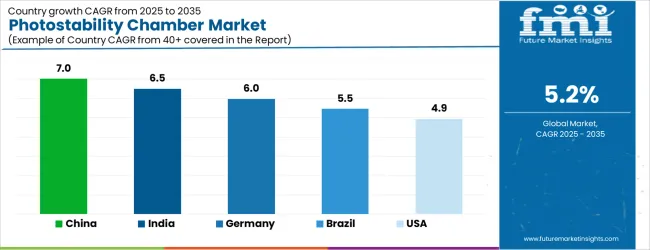
Analysis of Photostability Chamber Market By Key Countries

Photostability Chamber Market Cagr Analysis By Country

Country CAGR
China 7.0%
India 6.5%
Germany 6.0%
Brazil 5.5%
USA 4.9%
U.K. 4.4%
Japan 3.9%

Country-wise Analysis

The Photostability Chamber Market is expected to register a CAGR of 5.2% during the forecast period, exhibiting varied country level momentum. China leads with the highest CAGR of 7.0%, followed by India at 6.5%. Developed markets such as Germany, France, and the U.K. continue to expand steadily, while the U.S. is likely to grow at consistent rates. Japan posts the lowest CAGR at 3.4%, yet still underscores a broadly positive trajectory for the global Photostability Chamber Market. In 2024, Germany held a dominant revenue in the Western Europe market and is expected to grow with a CAGR of 6.0%. The U.S. Photostability Chamber Market is estimated to be valued at USD 582.1 million in 2025 and is anticipated to reach a valuation of USD 582.1 million by 2035. Sales are projected to rise at a CAGR of 0.0% over the forecast period between 2025 and 2035. While Japan and South Korea markets are estimated to be valued at USD 80.9 million and USD 53.6 million respectively in 2025.
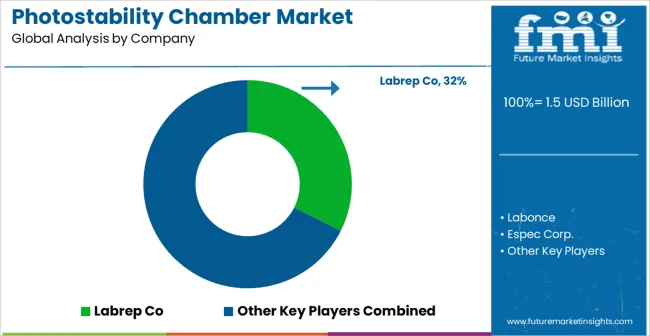
Key Players in the Photostability Chamber Market

Photostability Chamber Market Analysis By Company

  • Labrep Co
  • Labonce
  • Espec Corp.
  • Caron

Scope of the Report

Item Value
Quantitative Units USD 1.5 Billion
Product Type Small Chambers, Medium Chambers, and Large Chambers
End Use Laboratory, Pharmaceutical Industries, and Other
Regions Covered North America, Europe, Asia-Pacific, Latin America, Middle East & Africa
Country Covered United States, Canada, Germany, France, United Kingdom, China, Japan, India, Brazil, South Africa
Key Companies Profiled Labrep Co, Labonce, Espec Corp., and Caron

Photostability Chamber Market by Segments

Product Type:

  • Small Chambers
  • Medium Chambers
  • Large Chambers

End Use:

  • Laboratory
  • Pharmaceutical Industries
  • Other

Region:

  • North America
    • U.S.
    • Canada
    • Mexico
  • Latin America
    • Brazil
    • Chile
    • Rest of Latin America
  • Western Europe
    • Germany
    • U.K.
    • Italy
    • Spain
    • France
    • Nordic
    • BENELUX
    • Rest of Western Europe
  • Eastern Europe
    • Russia
    • Poland
    • Hungary
    • Balkan & Baltic
    • Rest of Eastern Europe
  • East Asia
    • China
    • Japan
    • South Korea
  • South Asia and Pacific
    • India
    • ASEAN
    • Australia & New Zealand
    • Rest of South Asia and Pacific
  • Middle East & Africa
    • Kingdom of Saudi Arabia
    • Other GCC Countries
    • Turkiye
    • South Africa
    • Other African Union
    • Rest of Middle East & Africa

Frequently Asked Questions

How big is the photostability chamber market in 2025?

The global photostability chamber market is estimated to be valued at USD 1.5 billion in 2025.

What will be the size of photostability chamber market in 2035?

The market size for the photostability chamber market is projected to reach USD 2.6 billion by 2035.

How much will be the photostability chamber market growth between 2025 and 2035?

The photostability chamber market is expected to grow at a 5.2% CAGR between 2025 and 2035.

What are the key product types in the photostability chamber market?

The key product types in photostability chamber market are small chambers, medium chambers and large chambers.

Which end use segment to contribute significant share in the photostability chamber market in 2025?

In terms of end use, laboratory segment to command 50.0% share in the photostability chamber market in 2025.

Table of Content

  1. Executive Summary
    • Global Market Outlook
    • Demand-side Trends
    • Supply-side Trends
    • Technology Roadmap Analysis
    • Analysis and Recommendations
  2. Market Overview
    • Market Coverage / Taxonomy
    • Market Definition / Scope / Limitations
  3. Market Background
    • Market Dynamics
      • Drivers
      • Restraints
      • Opportunity
      • Trends
    • Scenario Forecast
      • Demand in Optimistic Scenario
      • Demand in Likely Scenario
      • Demand in Conservative Scenario
    • Opportunity Map Analysis
    • Product Life Cycle Analysis
    • Supply Chain Analysis
    • Investment Feasibility Matrix
    • Value Chain Analysis
    • PESTLE and Porter’s Analysis
    • Regulatory Landscape
    • Regional Parent Market Outlook
    • Production and Consumption Statistics
    • Import and Export Statistics
  4. Global Market Analysis 2020-2024 and Forecast, 2025-2035
    • Historical Market Size Value (USD Million) Analysis, 2020-2024
    • Current and Future Market Size Value (USD Million) Projections, 2025-2035
      • Y-o-Y Growth Trend Analysis
      • Absolute $ Opportunity Analysis
  5. Global Market Pricing Analysis 2020-2024 and Forecast 2025-2035
  6. Global Market Analysis 2020-2024 and Forecast 2025-2035, By Product Type
    • Introduction / Key Findings
    • Historical Market Size Value (USD Million) Analysis By Product Type , 2020-2024
    • Current and Future Market Size Value (USD Million) Analysis and Forecast By Product Type , 2025-2035
      • Small Chambers
      • Medium Chambers
      • Large Chambers
    • Y-o-Y Growth Trend Analysis By Product Type , 2020-2024
    • Absolute $ Opportunity Analysis By Product Type , 2025-2035
  7. Global Market Analysis 2020-2024 and Forecast 2025-2035, By End Use
    • Introduction / Key Findings
    • Historical Market Size Value (USD Million) Analysis By End Use, 2020-2024
    • Current and Future Market Size Value (USD Million) Analysis and Forecast By End Use, 2025-2035
      • Laboratory
      • Pharmaceutical Industries
      • Other
    • Y-o-Y Growth Trend Analysis By End Use, 2020-2024
    • Absolute $ Opportunity Analysis By End Use, 2025-2035
  8. Global Market Analysis 2020-2024 and Forecast 2025-2035, By Region
    • Introduction
    • Historical Market Size Value (USD Million) Analysis By Region, 2020-2024
    • Current Market Size Value (USD Million) Analysis and Forecast By Region, 2025-2035
      • North America
      • Latin America
      • Western Europe
      • Eastern Europe
      • East Asia
      • South Asia and Pacific
      • Middle East & Africa
    • Market Attractiveness Analysis By Region
  9. North America Market Analysis 2020-2024 and Forecast 2025-2035, By Country
    • Historical Market Size Value (USD Million) Trend Analysis By Market Taxonomy, 2020-2024
    • Market Size Value (USD Million) Forecast By Market Taxonomy, 2025-2035
      • By Country
        • U.S.
        • Canada
        • Mexico
      • By Product Type
      • By End Use
    • Market Attractiveness Analysis
      • By Country
      • By Product Type
      • By End Use
    • Key Takeaways
  10. Latin America Market Analysis 2020-2024 and Forecast 2025-2035, By Country
    • Historical Market Size Value (USD Million) Trend Analysis By Market Taxonomy, 2020-2024
    • Market Size Value (USD Million) Forecast By Market Taxonomy, 2025-2035
      • By Country
        • Brazil
        • Chile
        • Rest of Latin America
      • By Product Type
      • By End Use
    • Market Attractiveness Analysis
      • By Country
      • By Product Type
      • By End Use
    • Key Takeaways
  11. Western Europe Market Analysis 2020-2024 and Forecast 2025-2035, By Country
    • Historical Market Size Value (USD Million) Trend Analysis By Market Taxonomy, 2020-2024
    • Market Size Value (USD Million) Forecast By Market Taxonomy, 2025-2035
      • By Country
        • Germany
        • U.K.
        • Italy
        • Spain
        • France
        • Nordic
        • BENELUX
        • Rest of Western Europe
      • By Product Type
      • By End Use
    • Market Attractiveness Analysis
      • By Country
      • By Product Type
      • By End Use
    • Key Takeaways
  12. Eastern Europe Market Analysis 2020-2024 and Forecast 2025-2035, By Country
    • Historical Market Size Value (USD Million) Trend Analysis By Market Taxonomy, 2020-2024
    • Market Size Value (USD Million) Forecast By Market Taxonomy, 2025-2035
      • By Country
        • Russia
        • Poland
        • Hungary
        • Balkan & Baltic
        • Rest of Eastern Europe
      • By Product Type
      • By End Use
    • Market Attractiveness Analysis
      • By Country
      • By Product Type
      • By End Use
    • Key Takeaways
  13. East Asia Market Analysis 2020-2024 and Forecast 2025-2035, By Country
    • Historical Market Size Value (USD Million) Trend Analysis By Market Taxonomy, 2020-2024
    • Market Size Value (USD Million) Forecast By Market Taxonomy, 2025-2035
      • By Country
        • China
        • Japan
        • South Korea
      • By Product Type
      • By End Use
    • Market Attractiveness Analysis
      • By Country
      • By Product Type
      • By End Use
    • Key Takeaways
  14. South Asia and Pacific Market Analysis 2020-2024 and Forecast 2025-2035, By Country
    • Historical Market Size Value (USD Million) Trend Analysis By Market Taxonomy, 2020-2024
    • Market Size Value (USD Million) Forecast By Market Taxonomy, 2025-2035
      • By Country
        • India
        • ASEAN
        • Australia & New Zealand
        • Rest of South Asia and Pacific
      • By Product Type
      • By End Use
    • Market Attractiveness Analysis
      • By Country
      • By Product Type
      • By End Use
    • Key Takeaways
  15. Middle East & Africa Market Analysis 2020-2024 and Forecast 2025-2035, By Country
    • Historical Market Size Value (USD Million) Trend Analysis By Market Taxonomy, 2020-2024
    • Market Size Value (USD Million) Forecast By Market Taxonomy, 2025-2035
      • By Country
        • Kingdom of Saudi Arabia
        • Other GCC Countries
        • Turkiye
        • South Africa
        • Other African Union
        • Rest of Middle East & Africa
      • By Product Type
      • By End Use
    • Market Attractiveness Analysis
      • By Country
      • By Product Type
      • By End Use
    • Key Takeaways
  16. Key Countries Market Analysis
    • U.S.
      • Pricing Analysis
      • Market Share Analysis, 2024
        • By Product Type
        • By End Use
    • Canada
      • Pricing Analysis
      • Market Share Analysis, 2024
        • By Product Type
        • By End Use
    • Mexico
      • Pricing Analysis
      • Market Share Analysis, 2024
        • By Product Type
        • By End Use
    • Brazil
      • Pricing Analysis
      • Market Share Analysis, 2024
        • By Product Type
        • By End Use
    • Chile
      • Pricing Analysis
      • Market Share Analysis, 2024
        • By Product Type
        • By End Use
    • Germany
      • Pricing Analysis
      • Market Share Analysis, 2024
        • By Product Type
        • By End Use
    • U.K.
      • Pricing Analysis
      • Market Share Analysis, 2024
        • By Product Type
        • By End Use
    • Italy
      • Pricing Analysis
      • Market Share Analysis, 2024
        • By Product Type
        • By End Use
    • Spain
      • Pricing Analysis
      • Market Share Analysis, 2024
        • By Product Type
        • By End Use
    • France
      • Pricing Analysis
      • Market Share Analysis, 2024
        • By Product Type
        • By End Use
    • India
      • Pricing Analysis
      • Market Share Analysis, 2024
        • By Product Type
        • By End Use
    • ASEAN
      • Pricing Analysis
      • Market Share Analysis, 2024
        • By Product Type
        • By End Use
    • Australia & New Zealand
      • Pricing Analysis
      • Market Share Analysis, 2024
        • By Product Type
        • By End Use
    • China
      • Pricing Analysis
      • Market Share Analysis, 2024
        • By Product Type
        • By End Use
    • Japan
      • Pricing Analysis
      • Market Share Analysis, 2024
        • By Product Type
        • By End Use
    • South Korea
      • Pricing Analysis
      • Market Share Analysis, 2024
        • By Product Type
        • By End Use
    • Russia
      • Pricing Analysis
      • Market Share Analysis, 2024
        • By Product Type
        • By End Use
    • Poland
      • Pricing Analysis
      • Market Share Analysis, 2024
        • By Product Type
        • By End Use
    • Hungary
      • Pricing Analysis
      • Market Share Analysis, 2024
        • By Product Type
        • By End Use
    • Kingdom of Saudi Arabia
      • Pricing Analysis
      • Market Share Analysis, 2024
        • By Product Type
        • By End Use
    • Turkiye
      • Pricing Analysis
      • Market Share Analysis, 2024
        • By Product Type
        • By End Use
    • South Africa
      • Pricing Analysis
      • Market Share Analysis, 2024
        • By Product Type
        • By End Use
  17. Market Structure Analysis
    • Competition Dashboard
    • Competition Benchmarking
    • Market Share Analysis of Top Players
      • By Regional
      • By Product Type
      • By End Use
  18. Competition Analysis
    • Competition Deep Dive
      • Labrep Co
        • Overview
        • Product Portfolio
        • Profitability by Market Segments (Product/Age /Sales Channel/Region)
        • Sales Footprint
        • Strategy Overview
          • Marketing Strategy
          • Product Strategy
          • Channel Strategy
      • Labonce
      • Espec Corp.
      • Caron
  19. Assumptions & Acronyms Used
  20. Research Methodology

List of Tables

  • Table 1: Global Photostability Chamber Market Value (USD Mn) Forecast by Region, 2020-2035
  • Table 2: Global Photostability Chamber Market Value (USD Mn) Forecast by Product Type , 2020-2035
  • Table 3: Global Photostability Chamber Market Value (USD Mn) Forecast by End Use, 2020-2035
  • Table 4: North America Photostability Chamber Market Value (USD Mn) Forecast by Country, 2020-2035
  • Table 5: North America Photostability Chamber Market Value (USD Mn) Forecast by Product Type , 2020-2035
  • Table 6: North America Photostability Chamber Market Value (USD Mn) Forecast by End Use, 2020-2035
  • Table 7: Latin America Photostability Chamber Market Value (USD Mn) Forecast by Country, 2020-2035
  • Table 8: Latin America Photostability Chamber Market Value (USD Mn) Forecast by Product Type , 2020-2035
  • Table 9: Latin America Photostability Chamber Market Value (USD Mn) Forecast by End Use, 2020-2035
  • Table 10: Western Europe Photostability Chamber Market Value (USD Mn) Forecast by Country, 2020-2035
  • Table 11: Western Europe Photostability Chamber Market Value (USD Mn) Forecast by Product Type , 2020-2035
  • Table 12: Western Europe Photostability Chamber Market Value (USD Mn) Forecast by End Use, 2020-2035
  • Table 13: Eastern Europe Photostability Chamber Market Value (USD Mn) Forecast by Country, 2020-2035
  • Table 14: Eastern Europe Photostability Chamber Market Value (USD Mn) Forecast by Product Type , 2020-2035
  • Table 15: Eastern Europe Photostability Chamber Market Value (USD Mn) Forecast by End Use, 2020-2035
  • Table 16: East Asia Photostability Chamber Market Value (USD Mn) Forecast by Country, 2020-2035
  • Table 17: East Asia Photostability Chamber Market Value (USD Mn) Forecast by Product Type , 2020-2035
  • Table 18: East Asia Photostability Chamber Market Value (USD Mn) Forecast by End Use, 2020-2035
  • Table 19: South Asia and Pacific Photostability Chamber Market Value (USD Mn) Forecast by Country, 2020-2035
  • Table 20: South Asia and Pacific Photostability Chamber Market Value (USD Mn) Forecast by Product Type , 2020-2035
  • Table 21: South Asia and Pacific Photostability Chamber Market Value (USD Mn) Forecast by End Use, 2020-2035
  • Table 22: Middle East & Africa Photostability Chamber Market Value (USD Mn) Forecast by Country, 2020-2035
  • Table 23: Middle East & Africa Photostability Chamber Market Value (USD Mn) Forecast by Product Type , 2020-2035
  • Table 24: Middle East & Africa Photostability Chamber Market Value (USD Mn) Forecast by End Use, 2020-2035

List of Figures

  • Figure 1: Global Photostability Chamber Market Pricing Analysis
  • Figure 2: Global Photostability Chamber Market Value (USD Mn) Forecast 2020–2035
  • Figure 3: Global Photostability Chamber Market Value Share and BPS Analysis by Product Type , 2025 and 2035
  • Figure 4: Global Photostability Chamber Market Y-o-Y Growth Comparison by Product Type , 2025–2035
  • Figure 5: Global Photostability Chamber Market Attractiveness Analysis by Product Type
  • Figure 6: Global Photostability Chamber Market Value Share and BPS Analysis by End Use, 2025 and 2035
  • Figure 7: Global Photostability Chamber Market Y-o-Y Growth Comparison by End Use, 2025–2035
  • Figure 8: Global Photostability Chamber Market Attractiveness Analysis by End Use
  • Figure 9: Global Photostability Chamber Market Value (USD Mn) Share and BPS Analysis by Region, 2025 and 2035
  • Figure 10: Global Photostability Chamber Market Y-o-Y Growth Comparison by Region, 2025–2035
  • Figure 11: Global Photostability Chamber Market Attractiveness Analysis by Region
  • Figure 12: North America Photostability Chamber Market Incremental Dollar Opportunity, 2025–2035
  • Figure 13: Latin America Photostability Chamber Market Incremental Dollar Opportunity, 2025–2035
  • Figure 14: Western Europe Photostability Chamber Market Incremental Dollar Opportunity, 2025–2035
  • Figure 15: Eastern Europe Photostability Chamber Market Incremental Dollar Opportunity, 2025–2035
  • Figure 16: East Asia Photostability Chamber Market Incremental Dollar Opportunity, 2025–2035
  • Figure 17: South Asia and Pacific Photostability Chamber Market Incremental Dollar Opportunity, 2025–2035
  • Figure 18: Middle East & Africa Photostability Chamber Market Incremental Dollar Opportunity, 2025–2035
  • Figure 19: North America Photostability Chamber Market Value Share and BPS Analysis by Country, 2025 and 2035
  • Figure 20: North America Photostability Chamber Market Value Share and BPS Analysis by Product Type , 2025 and 2035
  • Figure 21: North America Photostability Chamber Market Y-o-Y Growth Comparison by Product Type , 2025–2035
  • Figure 22: North America Photostability Chamber Market Attractiveness Analysis by Product Type
  • Figure 23: North America Photostability Chamber Market Value Share and BPS Analysis by End Use, 2025 and 2035
  • Figure 24: North America Photostability Chamber Market Y-o-Y Growth Comparison by End Use, 2025–2035
  • Figure 25: North America Photostability Chamber Market Attractiveness Analysis by End Use
  • Figure 26: Latin America Photostability Chamber Market Value Share and BPS Analysis by Country, 2025 and 2035
  • Figure 27: Latin America Photostability Chamber Market Value Share and BPS Analysis by Product Type , 2025 and 2035
  • Figure 28: Latin America Photostability Chamber Market Y-o-Y Growth Comparison by Product Type , 2025–2035
  • Figure 29: Latin America Photostability Chamber Market Attractiveness Analysis by Product Type
  • Figure 30: Latin America Photostability Chamber Market Value Share and BPS Analysis by End Use, 2025 and 2035
  • Figure 31: Latin America Photostability Chamber Market Y-o-Y Growth Comparison by End Use, 2025–2035
  • Figure 32: Latin America Photostability Chamber Market Attractiveness Analysis by End Use
  • Figure 33: Western Europe Photostability Chamber Market Value Share and BPS Analysis by Country, 2025 and 2035
  • Figure 34: Western Europe Photostability Chamber Market Value Share and BPS Analysis by Product Type , 2025 and 2035
  • Figure 35: Western Europe Photostability Chamber Market Y-o-Y Growth Comparison by Product Type , 2025–2035
  • Figure 36: Western Europe Photostability Chamber Market Attractiveness Analysis by Product Type
  • Figure 37: Western Europe Photostability Chamber Market Value Share and BPS Analysis by End Use, 2025 and 2035
  • Figure 38: Western Europe Photostability Chamber Market Y-o-Y Growth Comparison by End Use, 2025–2035
  • Figure 39: Western Europe Photostability Chamber Market Attractiveness Analysis by End Use
  • Figure 40: Eastern Europe Photostability Chamber Market Value Share and BPS Analysis by Country, 2025 and 2035
  • Figure 41: Eastern Europe Photostability Chamber Market Value Share and BPS Analysis by Product Type , 2025 and 2035
  • Figure 42: Eastern Europe Photostability Chamber Market Y-o-Y Growth Comparison by Product Type , 2025–2035
  • Figure 43: Eastern Europe Photostability Chamber Market Attractiveness Analysis by Product Type
  • Figure 44: Eastern Europe Photostability Chamber Market Value Share and BPS Analysis by End Use, 2025 and 2035
  • Figure 45: Eastern Europe Photostability Chamber Market Y-o-Y Growth Comparison by End Use, 2025–2035
  • Figure 46: Eastern Europe Photostability Chamber Market Attractiveness Analysis by End Use
  • Figure 47: East Asia Photostability Chamber Market Value Share and BPS Analysis by Country, 2025 and 2035
  • Figure 48: East Asia Photostability Chamber Market Value Share and BPS Analysis by Product Type , 2025 and 2035
  • Figure 49: East Asia Photostability Chamber Market Y-o-Y Growth Comparison by Product Type , 2025–2035
  • Figure 50: East Asia Photostability Chamber Market Attractiveness Analysis by Product Type
  • Figure 51: East Asia Photostability Chamber Market Value Share and BPS Analysis by End Use, 2025 and 2035
  • Figure 52: East Asia Photostability Chamber Market Y-o-Y Growth Comparison by End Use, 2025–2035
  • Figure 53: East Asia Photostability Chamber Market Attractiveness Analysis by End Use
  • Figure 54: South Asia and Pacific Photostability Chamber Market Value Share and BPS Analysis by Country, 2025 and 2035
  • Figure 55: South Asia and Pacific Photostability Chamber Market Value Share and BPS Analysis by Product Type , 2025 and 2035
  • Figure 56: South Asia and Pacific Photostability Chamber Market Y-o-Y Growth Comparison by Product Type , 2025–2035
  • Figure 57: South Asia and Pacific Photostability Chamber Market Attractiveness Analysis by Product Type
  • Figure 58: South Asia and Pacific Photostability Chamber Market Value Share and BPS Analysis by End Use, 2025 and 2035
  • Figure 59: South Asia and Pacific Photostability Chamber Market Y-o-Y Growth Comparison by End Use, 2025–2035
  • Figure 60: South Asia and Pacific Photostability Chamber Market Attractiveness Analysis by End Use
  • Figure 61: Middle East & Africa Photostability Chamber Market Value Share and BPS Analysis by Country, 2025 and 2035
  • Figure 62: Middle East & Africa Photostability Chamber Market Value Share and BPS Analysis by Product Type , 2025 and 2035
  • Figure 63: Middle East & Africa Photostability Chamber Market Y-o-Y Growth Comparison by Product Type , 2025–2035
  • Figure 64: Middle East & Africa Photostability Chamber Market Attractiveness Analysis by Product Type
  • Figure 65: Middle East & Africa Photostability Chamber Market Value Share and BPS Analysis by End Use, 2025 and 2035
  • Figure 66: Middle East & Africa Photostability Chamber Market Y-o-Y Growth Comparison by End Use, 2025–2035
  • Figure 67: Middle East & Africa Photostability Chamber Market Attractiveness Analysis by End Use
  • Figure 68: Global Photostability Chamber Market – Tier Structure Analysis
  • Figure 69: Global Photostability Chamber Market – Company Share Analysis
Dashboard
Dashboard
Dashboard
Dashboard
Dashboard
Dashboard

Our Research Products

Full Research Suite

The "Full Research Suite" delivers actionable market intel, deep dives on markets or technologies, so clients act faster, cut risk, and unlock growth.

Competitor Leaderboard Report

The Leaderboard benchmarks and ranks top vendors, classifying them as Established Leaders, Leading Challengers, or Disruptors & Challengers.

Future Leaders Index

Locates where complements amplify value and substitutes erode it, forecasting net impact by horizon

Market Data & Forecasts

We deliver granular, decision-grade intel: market sizing, 5-year forecasts, pricing, adoption, usage, revenue, and operational KPIs—plus competitor tracking, regulation, and value chains—across 60 countries broadly.

Market Focus Report

Spot the shifts before they hit your P&L. We track inflection points, adoption curves, pricing moves, and ecosystem plays to show where demand is heading, why it is changing, and what to do next across high-growth markets and disruptive tech

Survey Report

Real-time reads of user behavior. We track shifting priorities, perceptions of today’s and next-gen services, and provider experience, then pace how fast tech moves from trial to adoption, blending buyer, consumer, and channel inputs with social signals (#WhySwitch, #UX).

Bespoke Reports

Partner with our analyst team to build a custom report designed around your business priorities. From analysing market trends to assessing competitors or crafting bespoke datasets, we tailor insights to your needs.

Supplier Intelligence

Discovery & Profiling

Capacity & Footprint

Performance & Risk

Compliance & Governance

Commercial Readiness

Who Supplies Whom

Scorecards & Shortlists

Playbooks & Docs

Category Intelligence

Definition & Scope

Demand & Use Cases

Cost Drivers

Market Structure

Supply Chain Map

Trade & Policy

Operating Norms

Deliverables

Buyer Intelligence

Account Basics

Spend & Scope

Procurement Model

Vendor Requirements

Terms & Policies

Entry Strategy

Pain Points & Triggers

Outputs

Pricing Analysis

Benchmarks

Trends

Should-Cost

Indexation

Landed Cost

Commercial Terms

Deliverables

Brand Analysis

Positioning & Value Prop

Share & Presence

Customer Evidence

Go-to-Market

Digital & Reputation

Compliance & Trust

KPIs & Gaps

Outputs

Full Research Suite comprises of:

Market outlook & trends analysis

Market outlook & trends analysis

Interviews & case studies

Interviews & case studies

Strategic recommendations

Strategic recommendations

Vendor profiles & capabilities analysis

Vendor profiles & capabilities analysis

5-year forecasts

5-year forecasts

8 regions and 60+ country-level data splits

8 regions and 60+ country-level data splits

Market segment data splits

Market segment data splits

12 months of continuous data updates

12 months of continuous data updates

DELIVERED AS:

PDF EXCEL ONLINE

Full Research Suite


$5000

$7500

$10000

Buy Report Now
Similar Industry Reports

Similar Industry Reports

Chamber Belt Vacuum Machine Market

Chamber Belt Vacuum Machine Market Analysis Size and Share Forecast Outlook 2025 to 2035

Hot Chamber Die Casting Machine Market

Hot Chamber Die Casting Machine Market Growth - Trends & Forecast 2025 to 2035

Dual Chamber Dispensing Bottles Market

Dual Chamber Dispensing Bottles Market Size and Share Forecast Outlook 2025 to 2035

Dual Chamber Pumps Market

Dual-Chamber Pumps Market Analysis - Size, Share, and Forecast Outlook (2025 to 2035)

Dual Chamber Bottle Market

Dual Chamber Bottle Market Insights – Size, Trends & Forecast 2024-2034

Vacuum Chamber Pouches Market

Vacuum Chamber Pouches Market Size and Share Forecast Outlook 2025 to 2035

Vacuum Chamber Packaging Machines Market

Vacuum Chamber Packaging Machines Market

Dual Air Chamber Hydro-pneumatic Suspension Market

Dual Air Chamber Hydro-pneumatic Suspension Market Size and Share Forecast Outlook 2025 to 2035

Anechoic Chamber Market

Anechoic Chamber Market Growth - Trends & Forecast 2025 to 2035

Posterior Chamber Lens Market

Posterior Chamber Lens Market

Single Air Chamber Hydro-pneumatic Suspension Market

Single Air Chamber Hydro-pneumatic Suspension Market Forecast and Outlook 2025 to 2035

Stability Test Chamber Market

Stability Test Chamber Market Growth – Trends & Forecast 2019 to 2027

Flammability Test Chamber Market

Flammability Test Chamber Market

Cellbag Bioreactor Chambers Market

Cellbag Bioreactor Chambers Market Size and Share Forecast Outlook 2025 to 2035

Environmental Test Chambers Market

Environmental Test Chambers Market Size and Share Forecast Outlook 2025 to 2035

Commercial Vehicle Brake Chambers Market

Commercial Vehicle Brake Chambers Market Size and Share Forecast Outlook 2025 to 2035

Water-cooled Walk-in Temperature & Humidity Chamber Market

Water-cooled Walk-in Temperature & Humidity Chamber Market Size and Share Forecast Outlook 2025 to 2035

Future Market Insights

Photostability Chamber Market

Chat With MaRIA

Chat With

MaRIA

Hi There, I am MaRIA, Your Market Research Intelligence Assistant. How may I help you?