Dual-Chamber Pumps Market Size and Share Forecast Outlook 2025 to 2035

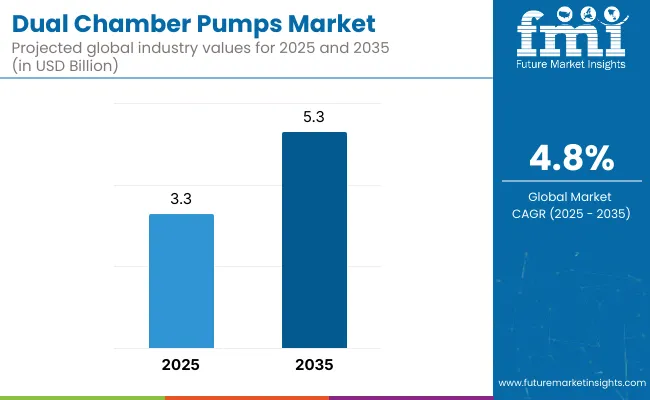
In 2025, the dual-chamber pumps market is valued at USD 3.3 billion and is expected to reach USD 5.3 billion by 2035, growing at a CAGR of 4.8%. Annual gains are projected to rise progressively, from around USD 0.16 billion in the initial years to nearly USD 0.24 billion by the end of the period.

This steady growth is attributed to increasing demand for accurate dual-dispensing mechanisms in pharmaceutical formulations, skincare products, and industrial adhesives. The ability to maintain component separation until application boosts product effectiveness and shelf life. Expanding end-use applications are likely to drive long-term adoption and ongoing product innovation.

Quick stats of Dual-Chamber Pumps Market

  • Dual-Chamber Pumps Market Size (2025): USD 3.3 billion
  • Projected Dual-Chamber Pumps Market Size (2035): USD 5.3 billion
  • Forecast CAGR of Dual-Chamber Pumps Market (2025 to 2035): 4.8%
  • Leading Segment by Pump Type (2025): Segmented Chamber (61%)
  • Dominant End-Use Segment (2025): Skincare (47%)
  • Key Growth Regions: Asia-Pacific, North America
  • Leading Player: APC Packaging holding 18% industry share

Dual Chamber Pumps Market Market Value Analysis

Metric Value
Industry Size (2025E) USD 3.3 billion
Industry Value (2035F) USD 5.3 billion
CAGR (2025 to 2035) 4.8%

The dual-chamber pumps market occupies a specialized but growing niche within its parent industries. In the global industrial pumps market (USD 65 billion), dual-chamber pumps hold 5-8% share, valued for precision fluid handling. The chemical processing industry accounts for 30-35% of demand, leveraging their leak-proof design for aggressive fluids. In pharmaceuticals/biotech (USD 15 billion pump segment), they capture 20-25% share for sterile drug production and lab use.

Water/wastewater treatment represents 15-20% adoption, primarily for chemical dosing. The food/beverage sector contributes 10-12%, favoring hygienic liquid transfer. With a CAGR of 6.5-7% (2024-2030), growth is driven by stricter safety regulations and process automation, though higher costs (20-30% premium over standard pumps) limit penetration in price-sensitive markets. Europe and North America dominate, holding 60% of global revenue.

Precision dispensing is transforming cosmetics and skincare packaging by combining functionality, sustainability, and ingredient integrity. Aptar’sNeomix, developed with Clarins, uses a patented dual-chamber airless system to deliver an 80/20 mix ratio, integrating UV protection and ISCC-certified recycled materials.

APC Packaging’s DCH2XA features dual-wall airless bottles with synchronized 0.23ml dosage, ideal for activating sensitive ingredients like vitamin C and hyaluronic acid at the point of use. Quadpack’s Ultra Solo, the first mono-material PE airless pump, enhances recyclability and supports plastic reduction goals. These innovations reflect a growing industry focus on high-performance, eco-conscious packaging solutions for modern skincare formulations.

Analyzing Dual-Chamber Pumps Market by Top Investment Segments

The global dual-chamber pumps market is driven by rising demand for multi-phase formulations across skincare, pharmaceuticals, and nutraceuticals. Segmented chambers lead with 61% market share, offering consistent dual dispensing. Skincare remains the largest end-use, capturing 47%, driven by rising consumer preference for serum-cream pairings, functional packaging, and dose accuracy across premium cosmetic formats.

Segmented Chambers Lead Consistent Dual-Dispensing Formats at 61%

Dual Chamber Pumps Market Analysis By Chamber Configuration

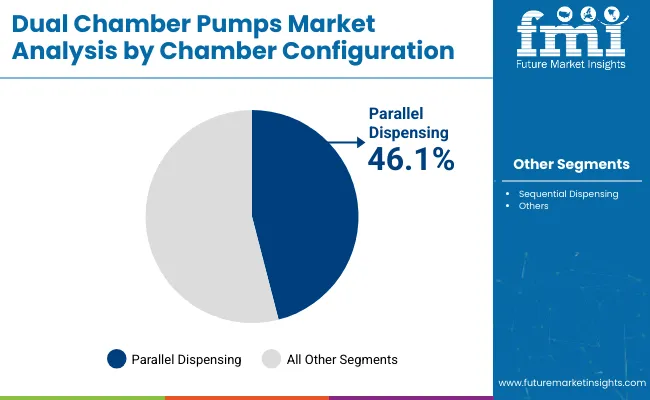
Segmented chamber pumps will remain the most dominant configuration in 2025, accounting for 61% of global demand. Their ability to separate active and base components until the point of use supports product integrity and consumer trust. Brands such as L’Oréal, Beiersdorf, and Olay use this system in their advanced serums and clinical skincare products.

  • Provides up to 99.8% separation until dispensing, ensuring shelf stability
  • Preferred in cosmeceuticals and dual-serum formulations with live actives
  • 4 out of 5 new dual-pack skincare launches in 2024 used segmented chambers

0.5-1 ml Pumps Dominate Mid-Range Dosing Preferences Globally

Dual Chamber Pumps Market Analysis By Output Capacity

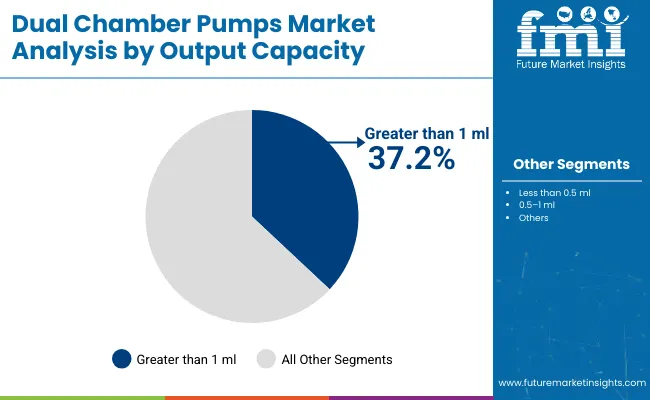
The 0.5-1 ml output capacity segment holds 45% of the global market, favored for daily-use products requiring accurate and user-friendly dosing. Products like L’Oréal Revitalift, Neutrogena Rapid Wrinkle Repair, and GarnierSkinActive utilize this range for serum and cream dispensing. Pharmaceutical-grade dual-dosing oral syrups also use this format to ensure consistent delivery.

  • Reduces dosing deviation to under ±4% per use
  • Present in over 57% of dual-chamber products launched between 2023-2024
  • Offers optimal viscosity range from 1,500 to 10,000 cPs

Static Mixing Pumps Gain Preference for Homogenous Delivery

Dual Chamber Pumps Market Analysis By Mixing Type

Static mixing dominates the mixing-type segment, commanding 52% of market share in 2025. These pumps mix two components inside a disposable mixing nozzle, ensuring uniform output. Used in premium skincare like Shiseido Ultimune and anti-aging creams with dual formulations, this technology ensures efficacy without requiring consumer interaction.

  • Improves uniformity by 28% compared to manual mixing formats
  • Reduces formulation failure due to user error in mixing
  • Common in prescription topical dual-drug therapy pumps in the U.S. market

Serum + Cream Applications Take Lead with 38% Market Share

Dual Chamber Pumps Market Analysis By Application

Serum and cream combinations lead the application segment with 38% share, especially in aging and brightening product lines. Dual-chamber pumps preserve actives like Vitamin C or retinol in the serum compartment, while emulsions in the cream compartment provide hydration. Major launches from Olay, Vichy, and LVMH brands use this format.

  • 71% of anti-aging skincare kits now include serum-cream dual pumps
  • Enables stable pH separation between water-based and oil-based actives
  • Used in over 64% of functional skincare DTC kits in 2024

Skincare & Beauty Hold Top Position in End-Use with 47%

Dual Chamber Pumps Market Analysis By End Use Industry

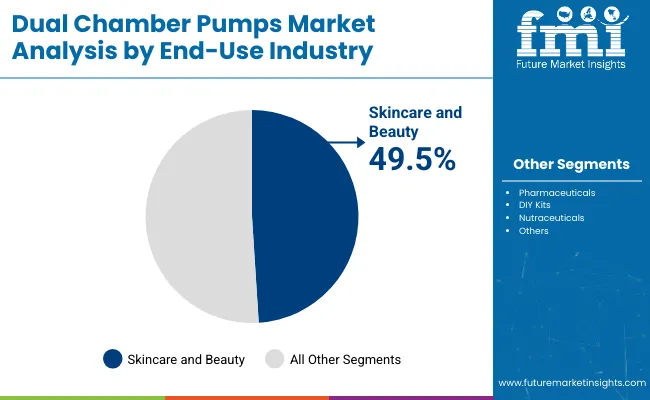
Skincare & beauty dominate with 47% of end-use demand, driven by rapid premiumization and ingredient complexity. Key brands like Estée Lauder, Clinique, and Drunk Elephant utilize dual chambers to enhance efficacy perception and justify premium pricing. Demand is strong in APAC and North America where skincare rituals involve stepwise applications.

  • Over 86% of dual-chamber pumps in Asia-Pacific are used for skincare
  • Used in 2 out of 3 launches involving brightening or hydration formulas
  • Supports growth of refillable packaging in eco-conscious brands

Top Dual-Chamber Pumps Market Dynamics

Dual-chamber pumps are gaining traction in skincare, pharmaceutical, and nutraceutical packaging due to their ability to separate and dispense two active formulas. In 2024, segmented chamber formats accounted for 61% of global sales. Brands are using them to enhance shelf life, dose accuracy, and appeal in functional product lines.

Segmentation Functionality Driving Brand Adoption in Skincare and CosmeceuticalsIn 2024, 47% of dual-chamber pump demand came from skincare applications, led by serums and anti-aging creams requiring ingredient separation. Dermatological brands reported a 19% increase in retention when products featured co-dosing delivery.

Chamber volume configurations under 20 ml held 36% market share, as travel-size formats gained traction in Asia and Europe. Flexible dosing controls allowed premium brands to launch multi-step regimens with controlled release, targeting user compliance and efficacy claims.

Application Expansion into Nutraceuticals and OTC PharmaceuticalsNutraceutical blends featuring omega oils and botanical extracts pushed dual-chamber adoption in ingestible products, accounting for an 11.3% YoY growth in demand from dietary supplement firms. OTC cold relief and topical steroid categories trialed pumps with asymmetric dosing, where one chamber holds active ingredients and the other holds buffering agents or moisturizers. Regional regulatory clarity across Canada and Japan enabled smoother rollout of dual-dispense formats, opening additional product registration routes.

Production Shifts and Cost-Sensitive Customization TrendsManufacturers optimized tooling for fast-changeover chamber molds to serve short-run custom SKUs. Contract packers saw a 14.8% rise in orders for dual-dispense packaging from boutique brands and formulation labs. Average per-unit cost declined by 8.4% for mid-volume orders due to improvements in actuator design and valve standardization. Polypropylene remained the preferred material, though bio-based polymers gained a 5.2% share as brands trialed lower-carbon alternatives in EU markets.

Top Countries Influencing the Growth Trajectory of the Dual-Chamber Pumps Market

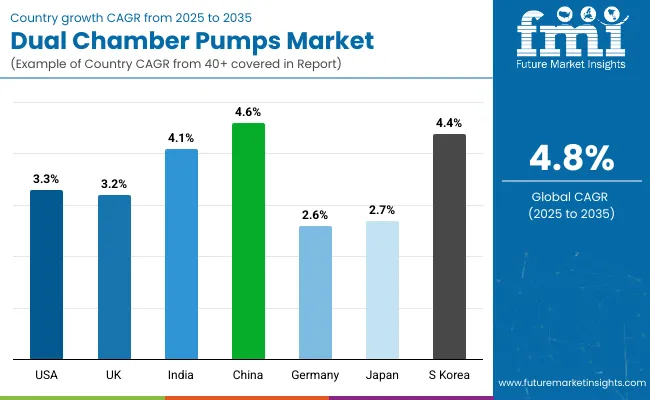
The industry is expected to grow at a CAGR of 4.8% between 2025 and 2035. Among the listed countries, China (BRICS) shows the highest alignment with global trends at 4.6%, just 0.2 percentage points below the average. India (BRICS) follows with 4.1%, trailing the global pace by 0.7%. In contrast, key OECD countries lag more noticeably.

The United States posts a CAGR of 3.3%, falling 1.5% short of the global rate, while Canada and Germany register 2.8% and 2.6%, underperforming by 2.0% and 2.2%, respectively. These differences stem from varying adoption rates in skincare, pharmaceutical packaging, and consumer preference for precision-dosing applications.

The report covers detailed analysis of 40+ countries, with the top five countries shared as a reference.

Dual Chamber Pumps Market Cagr Analysis By Country

Countries CAGR (2025 to 2035)
China 4.6%
India 4.1%
United States 3.3%
Canada 2.8%
Germany 2.6%

Growth Analysis of Dual-Chamber Pumps Market in the United States

The USA market is projected to grow at a 3.3% CAGR, notably below the global average of 4.8%. The market is maturing, with limited growth in hospital and long-term care usage. Between 2020 and 2024, compound annual growth stood at just 2.1%, driven by demand in immunotherapy and hormone delivery. However, cost pressures and regulatory scrutiny over drug-device combination approvals are extending product lifecycles. Demand remains moderate across outpatient infusion centers, with an uptick in prefilled biologic combination units.

  • Prefilled dual-chamber formats made up 28% of USA demand in 2024
  • Private-label sterile delivery systems grew by 9.7% annually post-2021
  • Five of the top eight manufacturers focused on product standardization in 2023

Demand Outlook for Dual-Chamber Pumps Market in Canada

Canada is expected to expand at a 2.8% CAGR, also trailing behind the global benchmark. Between 2020 and 2024, growth averaged 2.0% due to cautious hospital adoption and limited reimbursement support. Most of the demand comes from centralized health regions with specialized oncology and biologic drug protocols. Some pharmaceutical co-packers in Ontario and Quebec are piloting dual-chamber units for lyophilized antibiotics and immunoglobulin delivery.

  • 61% of dual-chamber systems were used in oncology and critical care in 2024
  • Canadian clinics reported a 19% improvement in medication accuracy through these systems
  • Cold-chain compliant dual-chamber packaging accounted for 13% of total units

Market Forecast for Dual-Chamber Pumps in China

China is forecast to grow at a 4.6% CAGR, just below the global average, but still driven by increasing adoption in injectable therapeutics and critical care. From 2020 to 2024, growth reached 3.4%, with a sharp increase in Tier 1 and 2 city hospitals. Domestic drug manufacturers are embracing dual-chamber pumps for monoclonal antibodies and peptide drugs. Favorable health reforms and rising investments in high-barrier pharma packaging support this growth trajectory.

  • Over 72 million dual-chamber pumps were deployed in China in 2024
  • 47% of high-volume tertiary hospitals adopted dual-chamber delivery systems
  • 18 new automated assembly lines for pump filling launched between 2022-2024

Analysis of Dual-Chamber Pumps Market in India

India is expected to grow at a 4.1% CAGR, slightly below the global average but improving from the 2.7% CAGR observed during 2020-2024. This growth is driven by rising demand for combination therapies in oncology, diabetes, and infectious diseases. Government initiatives in pharmaceutical manufacturing hubs like Gujarat and Telangana have encouraged the adoption of dual-chamber pumps, especially for ready-to-use biologics. Domestic production remains concentrated among a few players focusing on exports and urban hospital contracts.

  • In 2024, 8% of injectable therapies used dual-chamber pump formats
  • Three major Indian players received regulatory clearance for dual-chamber sterile injectables
  • Hyderabad-based facilities increased dual-chamber packaging output by 31% year-on-year

Dual-Chamber Pumps Market Outlook in Germany

The market in Germany is forecast to grow at a 2.6% CAGR, well below the global trend. From 2020 to 2024, demand saw only incremental gains as insurers emphasized cost control over complex drug-delivery systems. Dual-chamber systems are largely confined to high-value biologics and post-operative therapeutics. Regulatory resistance to newer configurations and the cost of line upgrades have slowed innovation adoption across hospitals and CMOs. Reimbursement realignment is expected to partially support niche applications.

  • Less than 15% of all injectable therapies in Germany used dual-chamber packaging in 2024
  • Hospital group purchasing organizations reduced dual-chamber procurement by 7.5% YoY
  • Two major pharmaceutical packagers shelved new dual-chamber integration projects in 2023

Leading Dual-Chamber Pumps Manufacturers, Suppliers, DistributorsLeading player - APC Packaging holding 18% industry share

Dual Chamber Pumps Market Analysis By Company

The market is dominated by established players like AptarGroup, Inc. and APG, which maintain strong positions through extensive distribution networks and proprietary dispensing technologies. AptarGroup has reinforced its market presence with recent launches of precision-dose pumps for pharmaceutical applications, while APG focuses on high-volume production for personal care products.

Emerging competitors such as Zhejiang Dayuan Pump Co., Ltd. are gaining traction by offering cost-effective alternatives, particularly in Asian markets. These firms prioritize rapid customization and shorter lead times to attract mid-sized brands.

Entry barriers in this market include stringent regulatory compliance for hygiene and dosage accuracy, particularly in pharmaceuticals and cosmetics. High initial costs for tooling and production molds also limit new entrants. Established manufacturers benefit from long-term contracts with major brands and patented pump mechanisms, making it difficult for smaller players to compete.

Recent Industry News

  • In Q2 2024, AptarGroup acquired a majority stake in Silgan Dispensing Systems, combining their expertise to create the market's most comprehensive dual-chamber pump portfolio for pharmaceutical and cosmetic applications, significantly expanding their global distribution network.
  • In March 2025, Rieke Packaging Systems launched the first dual-chamber pump with integrated anti-microbial protection, specifically designed for sensitive skincare formulations, featuring a patented barrier technology that prevents bacterial growth while maintaining precise dosage control.

Leading Players

  • APC Packaging
  • APG
  • The Packaging Company
  • Zhejiang Dayuan Pump Co., Ltd.
  • AptarGroup, Inc.

Report Scope

Report Attributes Details
Market Size (2025) USD 3.3 billion
Projected Market Size (2035) USD 5.3 billion
CAGR (2025-2035) 4.8%
Forecast Period 2025 to 2035
Quantitative Units USD billion (revenue)
Segmentation - Chamber Configuration Parallel Dispensing, Sequential Dispensing
Segmentation - Output Capacity <0.5 ml, 0.5-1 ml, >1 ml
Segmentation - Mixing Type Manual Mixing on Dispense, Static Mixing, No Mixing (separate streams)
Segmentation - Application Serum + Cream, Shampoo + Conditioner, Active Ingredient + Base
Segmentation - End-Use Industry Skincare & Beauty, Pharmaceuticals, DIY Kits, Nutraceuticals
Regional/Country Coverage North America (USA, Canada), Europe (Germany, UK, France, Italy, Spain), Asia-Pacific (China, Japan, South Korea, India, ASEAN), Latin America (Brazil, Mexico, Argentina), Middle East & Africa (GCC Countries, South Africa, Egypt)
Leading Companies Profiled APC Packaging, APG, The Packaging Company, Zhejiang Dayuan Pump Co., Ltd., AptarGroup, Inc.
Additional Attributes Dollar sales, share by mixing type and end-use, increased demand for active-dual formulas in cosmetics and pharma, rise in customizable DIY kits, growth in precision dosage dispensing, regional production clustering in Asia and Europe driving exports

Key Segments

By Chamber Configuration

  • Parallel Dispensing
  • Sequential Dispensing

By Output Capacity

  • Less than 0.5 ml
  • 0.5–1 ml
  • Greater than 1 ml

By Mixing Type:

  • Manual Mixing on Dispense
  • Static Mixing
  • No Mixing (separate streams)

By Application:

  • Serum + Cream
  • Shampoo + Conditioner
  • Active Ingredient + Base

By End-Use Industry:

  • Skincare & Beauty
  • Pharmaceuticals
  • DIY Kits
  • Nutraceuticals

By Region:

  • North America
  • Europe
  • Asia-Pacific
  • Latin America
  • Middle East & Africa

Table of Content

  1. Executive Summary
    • Global Market Outlook
    • Demand-side Trends
    • Supply-side Trends
    • Technology Roadmap Analysis
    • Analysis and Recommendations
  2. Market Overview
    • Market Coverage / Taxonomy
    • Market Definition / Scope / Limitations
  3. Market Background
    • Market Dynamics
      • Drivers
      • Restraints
      • Opportunity
      • Trends
    • Scenario Forecast
      • Demand in Optimistic Scenario
      • Demand in Likely Scenario
      • Demand in Conservative Scenario
    • Opportunity Map Analysis
    • Product Life Cycle Analysis
    • Supply Chain Analysis
      • Supply Side Participants and their Roles
        • Producers
        • Mid-Level Participants (Traders/ Agents/ Brokers)
        • Wholesalers and Distributors
      • Value Added and Value Created at Node in the Supply Chain
      • List of Raw Material Suppliers
      • List of Existing and Potential Buyer’s
    • Investment Feasibility Matrix
    • Value Chain Analysis
      • Profit Margin Analysis
      • Wholesalers and Distributors
      • Retailers
    • PESTLE and Porter’s Analysis
    • Regulatory Landscape
      • By Key Regions
      • By Key Countries
    • Regional Parent Market Outlook
    • Production and Consumption Statistics
    • Import and Export Statistics
  4. Global Market Analysis 2020 to 2024 and Forecast, 2025 to 2035
    • Historical Market Size Value (MT) & Volume (Million Units) Analysis, 2020 to 2024
    • Current and Future Market Size Value (MT) & Volume (Million Units) Projections, 2025 to 2035
      • Y-o-Y Growth Trend Analysis
      • Absolute $ Opportunity Analysis
  5. Global Market Pricing Analysis 2020 to 2024 and Forecast 2025 to 2035
  6. Global Market Analysis 2020 to 2024 and Forecast 2025 to 2035, By Chamber Configuration
    • Introduction / Key Findings
    • Historical Market Size Value (MT) & Volume (Million Units) Analysis By Chamber Configuration, 2020 to 2024
    • Current and Future Market Size Value (MT) & Volume (Million Units) Analysis and Forecast By Chamber Configuration, 2025 to 2035
      • Parallel Dispensing
      • Sequential Dispensing
    • Y-o-Y Growth Trend Analysis By Chamber Configuration, 2020 to 2024
    • Absolute $ Opportunity Analysis By Chamber Configuration, 2025 to 2035
  7. Global Market Analysis 2020 to 2024 and Forecast 2025 to 2035, By Output Capacity
    • Introduction / Key Findings
    • Historical Market Size Value (MT) & Volume (Million Units) Analysis By Output Capacity, 2020 to 2024
    • Current and Future Market Size Value (MT) & Volume (Million Units) Analysis and Forecast By Output Capacity, 2025 to 2035
      • Less than 0.5 ml
      • 0.5-1 ml
      • Greater than 1 ml
    • Y-o-Y Growth Trend Analysis By Output Capacity, 2020 to 2024
    • Absolute $ Opportunity Analysis By Output Capacity, 2025 to 2035
  8. Global Market Analysis 2020 to 2024 and Forecast 2025 to 2035, By Mixing Type
    • Introduction / Key Findings
    • Historical Market Size Value (MT) & Volume (Million Units) Analysis By Mixing Type, 2020 to 2024
    • Current and Future Market Size Value (MT) & Volume (Million Units) Analysis and Forecast By Mixing Type, 2025 to 2035
      • Manual Mixing on Dispense
      • Static Mixing
      • No Mixing (separate streams)
    • Y-o-Y Growth Trend Analysis By Mixing Type, 2020 to 2024
    • Absolute $ Opportunity Analysis By Mixing Type, 2025 to 2035
  9. Global Market Analysis 2020 to 2024 and Forecast 2025 to 2035, By Application
    • Introduction / Key Findings
    • Historical Market Size Value (MT) & Volume (Million Units) Analysis By Application, 2020 to 2024
    • Current and Future Market Size Value (MT) & Volume (Million Units) Analysis and Forecast By Application, 2025 to 2035
      • Serum + Cream
      • Shampoo + Conditioner
      • Active Ingredient + Base
    • Y-o-Y Growth Trend Analysis By Application, 2020 to 2024
    • Absolute $ Opportunity Analysis By Application, 2025 to 2035
  10. Global Market Analysis 2020 to 2024 and Forecast 2025 to 2035, By End-Use Industry
    • Introduction / Key Findings
    • Historical Market Size Value (MT) & Volume (Million Units) Analysis By End-Use Industry, 2020 to 2024
    • Current and Future Market Size Value (MT) & Volume (Million Units) Analysis and Forecast By End-Use Industry, 2025 to 2035
      • Skincare & Beauty
      • Pharmaceuticals
      • DIY Kits
      • Nutraceuticals
    • Y-o-Y Growth Trend Analysis By End-Use Industry, 2020 to 2024
    • Absolute $ Opportunity Analysis By End-Use Industry, 2025 to 2035
  11. Global Market Analysis 2020 to 2024 and Forecast 2025 to 2035, By Region
    • Introduction
    • Historical Market Size Value (MT) & Volume (Million Units) Analysis By Region, 2020 to 2024
    • Current Market Size Value (MT) & Volume (Million Units) Analysis and Forecast By Region, 2025 to 2035
      • North America
      • Latin America
      • Western Europe
      • Eastern Europe
      • East Asia
      • South Asia & Pacific
      • Middle East and Africa
    • Market Attractiveness Analysis By Region
  12. North America Market Analysis 2020 to 2024 and Forecast 2025 to 2035, By Country
    • Historical Market Size Value (MT) & Volume (Million Units) Trend Analysis By Market Taxonomy, 2020 to 2024
    • Market Size Value (MT) & Volume (Million Units) Forecast By Market Taxonomy, 2025 to 2035
      • By Country
        • USA
        • Canada
        • Mexico
      • By Chamber Configuration
      • By Output Capacity
      • By Mixing Type
      • By Application
      • By End-Use Industry
    • Market Attractiveness Analysis
      • By Country
      • By Chamber Configuration
      • By Output Capacity
      • By Mixing Type
      • By Application
      • By End-Use Industry
    • Key Takeaways
  13. Latin America Market Analysis 2020 to 2024 and Forecast 2025 to 2035, By Country
    • Historical Market Size Value (MT) & Volume (Million Units) Trend Analysis By Market Taxonomy, 2020 to 2024
    • Market Size Value (MT) & Volume (Million Units) Forecast By Market Taxonomy, 2025 to 2035
      • By Country
        • Brazil
        • Argentina
        • Rest of LATAM
      • By Chamber Configuration
      • By Output Capacity
      • By Mixing Type
      • By Application
      • By End-Use Industry
    • Market Attractiveness Analysis
      • By Country
      • By Chamber Configuration
      • By Output Capacity
      • By Mixing Type
      • By Application
      • By End-Use Industry
    • Key Takeaways
  14. Western Europe Market Analysis 2020 to 2024 and Forecast 2025 to 2035, By Country
    • Historical Market Size Value (MT) & Volume (Million Units) Trend Analysis By Market Taxonomy, 2020 to 2024
    • Market Size Value (MT) & Volume (Million Units) Forecast By Market Taxonomy, 2025 to 2035
      • By Country
        • Germany
        • Italy
        • France
        • UK
        • Spain
        • BENELUX
        • Nordic
        • Rest of W.Europe
      • By Chamber Configuration
      • By Output Capacity
      • By Mixing Type
      • By Application
      • By End-Use Industry
    • Market Attractiveness Analysis
      • By Country
      • By Chamber Configuration
      • By Output Capacity
      • By Mixing Type
      • By Application
      • By End-Use Industry
    • Key Takeaways
  15. Eastern Europe Market Analysis 2020 to 2024 and Forecast 2025 to 2035, By Country
    • Historical Market Size Value (MT) & Volume (Million Units) Trend Analysis By Market Taxonomy, 2020 to 2024
    • Market Size Value (MT) & Volume (Million Units) Forecast By Market Taxonomy, 2025 to 2035
      • By Country
        • Russia
        • Hungary
        • Poland
        • Balkan & Baltics
        • Rest of E. Europe
      • By Chamber Configuration
      • By Output Capacity
      • By Mixing Type
      • By Application
      • By End-Use Industry
    • Market Attractiveness Analysis
      • By Country
      • By Chamber Configuration
      • By Output Capacity
      • By Mixing Type
      • By Application
      • By End-Use Industry
    • Key Takeaways
  16. East Asia Market Analysis 2020 to 2024 and Forecast 2025 to 2035, By Country
    • Historical Market Size Value (MT) & Volume (Million Units) Trend Analysis By Market Taxonomy, 2020 to 2024
    • Market Size Value (MT) & Volume (Million Units) Forecast By Market Taxonomy, 2025 to 2035
      • By Country
        • China
        • Japan
        • South Korea
      • By Chamber Configuration
      • By Output Capacity
      • By Mixing Type
      • By Application
      • By End-Use Industry
    • Market Attractiveness Analysis
      • By Country
      • By Chamber Configuration
      • By Output Capacity
      • By Mixing Type
      • By Application
      • By End-Use Industry
    • Key Takeaways
  17. South Asia & Pacific Market Analysis 2020 to 2024 and Forecast 2025 to 2035, By Country
    • Historical Market Size Value (MT) & Volume (Million Units) Trend Analysis By Market Taxonomy, 2020 to 2024
    • Market Size Value (MT) & Volume (Million Units) Forecast By Market Taxonomy, 2025 to 2035
      • By Country
        • India
        • Australia & New Zealand
        • ASEAN
        • Rest of SAP
      • By Chamber Configuration
      • By Output Capacity
      • By Mixing Type
      • By Application
      • By End-Use Industry
    • Market Attractiveness Analysis
      • By Country
      • By Chamber Configuration
      • By Output Capacity
      • By Mixing Type
      • By Application
      • By End-Use Industry
    • Key Takeaways
  18. Middle East and Africa Market Analysis 2020 to 2024 and Forecast 2025 to 2035, By Country
    • Historical Market Size Value (MT) & Volume (Million Units) Trend Analysis By Market Taxonomy, 2020 to 2024
    • Market Size Value (MT) & Volume (Million Units) Forecast By Market Taxonomy, 2025 to 2035
      • By Country
        • GCC Countries
        • Northern Africa
        • South Africa
        • Turkiye
        • Rest of MEA
      • By Chamber Configuration
      • By Output Capacity
      • By Mixing Type
      • By Application
      • By End-Use Industry
    • Market Attractiveness Analysis
      • By Country
      • By Chamber Configuration
      • By Output Capacity
      • By Mixing Type
      • By Application
      • By End-Use Industry
    • Key Takeaways
  19. Key Countries Market Analysis
    • USA
      • Pricing Analysis
      • Market Share Analysis, 2024
        • By Chamber Configuration
        • By Output Capacity
        • By Mixing Type
        • By Application
        • By End-Use Industry
    • Canada
      • Pricing Analysis
      • Market Share Analysis, 2024
        • By Chamber Configuration
        • By Output Capacity
        • By Mixing Type
        • By Application
        • By End-Use Industry
    • Brazil
      • Pricing Analysis
      • Market Share Analysis, 2024
        • By Chamber Configuration
        • By Output Capacity
        • By Mixing Type
        • By Application
        • By End-Use Industry
    • Mexico
      • Pricing Analysis
      • Market Share Analysis, 2024
        • By Chamber Configuration
        • By Output Capacity
        • By Mixing Type
        • By Application
        • By End-Use Industry
    • Argentina
      • Pricing Analysis
      • Market Share Analysis, 2024
        • By Chamber Configuration
        • By Output Capacity
        • By Mixing Type
        • By Application
        • By End-Use Industry
  20. Market Structure Analysis
    • Competition Dashboard
    • Competition Benchmarking
    • Market Share Analysis of Top Players
      • By Regional
      • By Chamber Configuration
      • By Output Capacity
      • By Mixing Type
      • By Application
      • By End-Use Industry
  21. Competition Analysis
    • Competition Deep Dive
      • APC Packaging
        • Overview
        • Product Portfolio
        • Profitability by Market Segments (Product/Age /Sales Channel/Region)
        • Sales Footprint
        • Strategy Overview
          • Marketing Strategy
          • Product Strategy
          • Channel Strategy
      • APG
        • Overview
        • Product Portfolio
        • Profitability by Market Segments (Product/Age /Sales Channel/Region)
        • Sales Footprint
        • Strategy Overview
          • Marketing Strategy
          • Product Strategy
          • Channel Strategy
      • The Packaging Company
        • Overview
        • Product Portfolio
        • Profitability by Market Segments (Product/Age /Sales Channel/Region)
        • Sales Footprint
        • Strategy Overview
          • Marketing Strategy
          • Product Strategy
          • Channel Strategy
      • Zhejiang Dayuan Pump Co., Ltd.
        • Overview
        • Product Portfolio
        • Profitability by Market Segments (Product/Age /Sales Channel/Region)
        • Sales Footprint
        • Strategy Overview
          • Marketing Strategy
          • Product Strategy
          • Channel Strategy
      • AptarGroup, Inc.
        • Overview
        • Product Portfolio
        • Profitability by Market Segments (Product/Age /Sales Channel/Region)
        • Sales Footprint
        • Strategy Overview
          • Marketing Strategy
          • Product Strategy
          • Channel Strategy
  22. Assumptions & Acronyms Used
  23. Research Methodology

List of Tables

  • Table 1: Global Market Value (MT) Forecast by Region, 2020-2035
  • Table 2: Global Market Volume (Million Units) Forecast by Region, 2020-2035
  • Table 3: Global Market Value (MT) Forecast by Chamber Configuration, 2020-2035
  • Table 4: Global Market Volume (Million Units) Forecast by Chamber Configuration, 2020-2035
  • Table 5: Global Market Value (MT) Forecast by Output Capacity, 2020-2035
  • Table 6: Global Market Volume (Million Units) Forecast by Output Capacity, 2020-2035
  • Table 7: Global Market Value (MT) Forecast by Mixing Type, 2020-2035
  • Table 8: Global Market Volume (Million Units) Forecast by Mixing Type, 2020-2035
  • Table 9: Global Market Value (MT) Forecast by Application, 2020-2035
  • Table 10: Global Market Volume (Million Units) Forecast by Application, 2020-2035
  • Table 11: Global Market Value (MT) Forecast by End-Use Industry, 2020-2035
  • Table 12: Global Market Volume (Million Units) Forecast by End-Use Industry, 2020-2035
  • Table 13: North America Market Value (MT) Forecast by Country, 2020-2035
  • Table 14: North America Market Volume (Million Units) Forecast by Country, 2020-2035
  • Table 15: North America Market Value (MT) Forecast by Chamber Configuration, 2020-2035
  • Table 16: North America Market Volume (Million Units) Forecast by Chamber Configuration, 2020-2035
  • Table 17: North America Market Value (MT) Forecast by Output Capacity, 2020-2035
  • Table 18: North America Market Volume (Million Units) Forecast by Output Capacity, 2020-2035
  • Table 19: North America Market Value (MT) Forecast by Mixing Type, 2020-2035
  • Table 20: North America Market Volume (Million Units) Forecast by Mixing Type, 2020-2035
  • Table 21: North America Market Value (MT) Forecast by Application, 2020-2035
  • Table 22: North America Market Volume (Million Units) Forecast by Application, 2020-2035
  • Table 23: North America Market Value (MT) Forecast by End-Use Industry, 2020-2035
  • Table 24: North America Market Volume (Million Units) Forecast by End-Use Industry, 2020-2035
  • Table 25: Latin America Market Value (MT) Forecast by Country, 2020-2035
  • Table 26: Latin America Market Volume (Million Units) Forecast by Country, 2020-2035
  • Table 27: Latin America Market Value (MT) Forecast by Chamber Configuration, 2020-2035
  • Table 28: Latin America Market Volume (Million Units) Forecast by Chamber Configuration, 2020-2035
  • Table 29: Latin America Market Value (MT) Forecast by Output Capacity, 2020-2035
  • Table 30: Latin America Market Volume (Million Units) Forecast by Output Capacity, 2020-2035
  • Table 31: Latin America Market Value (MT) Forecast by Mixing Type, 2020-2035
  • Table 32: Latin America Market Volume (Million Units) Forecast by Mixing Type, 2020-2035
  • Table 33: Latin America Market Value (MT) Forecast by Application, 2020-2035
  • Table 34: Latin America Market Volume (Million Units) Forecast by Application, 2020-2035
  • Table 35: Latin America Market Value (MT) Forecast by End-Use Industry, 2020-2035
  • Table 36: Latin America Market Volume (Million Units) Forecast by End-Use Industry, 2020-2035
  • Table 37: Western Europe Market Value (MT) Forecast by Country, 2020-2035
  • Table 38: Western Europe Market Volume (Million Units) Forecast by Country, 2020-2035
  • Table 39: Western Europe Market Value (MT) Forecast by Chamber Configuration, 2020-2035
  • Table 40: Western Europe Market Volume (Million Units) Forecast by Chamber Configuration, 2020-2035
  • Table 41: Western Europe Market Value (MT) Forecast by Output Capacity, 2020-2035
  • Table 42: Western Europe Market Volume (Million Units) Forecast by Output Capacity, 2020-2035
  • Table 43: Western Europe Market Value (MT) Forecast by Mixing Type, 2020-2035
  • Table 44: Western Europe Market Volume (Million Units) Forecast by Mixing Type, 2020-2035
  • Table 45: Western Europe Market Value (MT) Forecast by Application, 2020-2035
  • Table 46: Western Europe Market Volume (Million Units) Forecast by Application, 2020-2035
  • Table 47: Western Europe Market Value (MT) Forecast by End-Use Industry, 2020-2035
  • Table 48: Western Europe Market Volume (Million Units) Forecast by End-Use Industry, 2020-2035
  • Table 49: Eastern Europe Market Value (MT) Forecast by Country, 2020-2035
  • Table 50: Eastern Europe Market Volume (Million Units) Forecast by Country, 2020-2035
  • Table 51: Eastern Europe Market Value (MT) Forecast by Chamber Configuration, 2020-2035
  • Table 52: Eastern Europe Market Volume (Million Units) Forecast by Chamber Configuration, 2020-2035
  • Table 53: Eastern Europe Market Value (MT) Forecast by Output Capacity, 2020-2035
  • Table 54: Eastern Europe Market Volume (Million Units) Forecast by Output Capacity, 2020-2035
  • Table 55: Eastern Europe Market Value (MT) Forecast by Mixing Type, 2020-2035
  • Table 56: Eastern Europe Market Volume (Million Units) Forecast by Mixing Type, 2020-2035
  • Table 57: Eastern Europe Market Value (MT) Forecast by Application, 2020-2035
  • Table 58: Eastern Europe Market Volume (Million Units) Forecast by Application, 2020-2035
  • Table 59: Eastern Europe Market Value (MT) Forecast by End-Use Industry, 2020-2035
  • Table 60: Eastern Europe Market Volume (Million Units) Forecast by End-Use Industry, 2020-2035
  • Table 61: East Asia Market Value (MT) Forecast by Country, 2020-2035
  • Table 62: East Asia Market Volume (Million Units) Forecast by Country, 2020-2035
  • Table 63: East Asia Market Value (MT) Forecast by Chamber Configuration, 2020-2035
  • Table 64: East Asia Market Volume (Million Units) Forecast by Chamber Configuration, 2020-2035
  • Table 65: East Asia Market Value (MT) Forecast by Output Capacity, 2020-2035
  • Table 66: East Asia Market Volume (Million Units) Forecast by Output Capacity, 2020-2035
  • Table 67: East Asia Market Value (MT) Forecast by Mixing Type, 2020-2035
  • Table 68: East Asia Market Volume (Million Units) Forecast by Mixing Type, 2020-2035
  • Table 69: East Asia Market Value (MT) Forecast by Application, 2020-2035
  • Table 70: East Asia Market Volume (Million Units) Forecast by Application, 2020-2035
  • Table 71: East Asia Market Value (MT) Forecast by End-Use Industry, 2020-2035
  • Table 72: East Asia Market Volume (Million Units) Forecast by End-Use Industry, 2020-2035
  • Table 73: South Asia & Pacific Market Value (MT) Forecast by Country, 2020-2035
  • Table 74: South Asia & Pacific Market Volume (Million Units) Forecast by Country, 2020-2035
  • Table 75: South Asia & Pacific Market Value (MT) Forecast by Chamber Configuration, 2020-2035
  • Table 76: South Asia & Pacific Market Volume (Million Units) Forecast by Chamber Configuration, 2020-2035
  • Table 77: South Asia & Pacific Market Value (MT) Forecast by Output Capacity, 2020-2035
  • Table 78: South Asia & Pacific Market Volume (Million Units) Forecast by Output Capacity, 2020-2035
  • Table 79: South Asia & Pacific Market Value (MT) Forecast by Mixing Type, 2020-2035
  • Table 80: South Asia & Pacific Market Volume (Million Units) Forecast by Mixing Type, 2020-2035
  • Table 81: South Asia & Pacific Market Value (MT) Forecast by Application, 2020-2035
  • Table 82: South Asia & Pacific Market Volume (Million Units) Forecast by Application, 2020-2035
  • Table 83: South Asia & Pacific Market Value (MT) Forecast by End-Use Industry, 2020-2035
  • Table 84: South Asia & Pacific Market Volume (Million Units) Forecast by End-Use Industry, 2020-2035
  • Table 85: Middle East and Africa Market Value (MT) Forecast by Country, 2020-2035
  • Table 86: Middle East and Africa Market Volume (Million Units) Forecast by Country, 2020-2035
  • Table 87: Middle East and Africa Market Value (MT) Forecast by Chamber Configuration, 2020-2035
  • Table 88: Middle East and Africa Market Volume (Million Units) Forecast by Chamber Configuration, 2020-2035
  • Table 89: Middle East and Africa Market Value (MT) Forecast by Output Capacity, 2020-2035
  • Table 90: Middle East and Africa Market Volume (Million Units) Forecast by Output Capacity, 2020-2035
  • Table 91: Middle East and Africa Market Value (MT) Forecast by Mixing Type, 2020-2035
  • Table 92: Middle East and Africa Market Volume (Million Units) Forecast by Mixing Type, 2020-2035
  • Table 93: Middle East and Africa Market Value (MT) Forecast by Application, 2020-2035
  • Table 94: Middle East and Africa Market Volume (Million Units) Forecast by Application, 2020-2035
  • Table 95: Middle East and Africa Market Value (MT) Forecast by End-Use Industry, 2020-2035
  • Table 96: Middle East and Africa Market Volume (Million Units) Forecast by End-Use Industry, 2020-2035

List of Figures

  • Figure 1: Global Market Volume (Million Units) Forecast 2020-2035
  • Figure 2: Global Market Pricing Analysis
  • Figure 3: Global Market Value (MT) Forecast 2020-2035
  • Figure 4: Global Market Value Share and BPS Analysis by Chamber Configuration, 2025 and 2035
  • Figure 5: Global Market Y-o-Y Growth Comparison by Chamber Configuration, 2025-2035
  • Figure 6: Global Market Attractiveness Analysis by Chamber Configuration
  • Figure 7: Global Market Value Share and BPS Analysis by Output Capacity, 2025 and 2035
  • Figure 8: Global Market Y-o-Y Growth Comparison by Output Capacity, 2025-2035
  • Figure 9: Global Market Attractiveness Analysis by Output Capacity
  • Figure 10: Global Market Value Share and BPS Analysis by Mixing Type, 2025 and 2035
  • Figure 11: Global Market Y-o-Y Growth Comparison by Mixing Type, 2025-2035
  • Figure 12: Global Market Attractiveness Analysis by Mixing Type
  • Figure 13: Global Market Value Share and BPS Analysis by Application, 2025 and 2035
  • Figure 14: Global Market Y-o-Y Growth Comparison by Application, 2025-2035
  • Figure 15: Global Market Attractiveness Analysis by Application
  • Figure 16: Global Market Value Share and BPS Analysis by End-Use Industry, 2025 and 2035
  • Figure 17: Global Market Y-o-Y Growth Comparison by End-Use Industry, 2025-2035
  • Figure 18: Global Market Attractiveness Analysis by End-Use Industry
  • Figure 19: Global Market Value (MT) Share and BPS Analysis by Region, 2025 and 2035
  • Figure 20: Global Market Y-o-Y Growth Comparison by Region, 2025-2035
  • Figure 21: Global Market Attractiveness Analysis by Region
  • Figure 22: North America Market Incremental $ Opportunity, 2025-2035
  • Figure 23: Latin America Market Incremental $ Opportunity, 2025-2035
  • Figure 24: Western Europe Market Incremental $ Opportunity, 2025-2035
  • Figure 25: Eastern Europe Market Incremental $ Opportunity, 2025-2035
  • Figure 26: East Asia Market Incremental $ Opportunity, 2025-2035
  • Figure 27: South Asia & Pacific Market Incremental $ Opportunity, 2025-2035
  • Figure 28: Middle East and Africa Market Incremental $ Opportunity, 2025-2035
  • Figure 29: North America Market Value Share and BPS Analysis by Country, 2025 and 2035
  • Figure 30: North America Market Value Share and BPS Analysis by Chamber Configuration, 2025 and 2035
  • Figure 31: North America Market Y-o-Y Growth Comparison by Chamber Configuration, 2025-2035
  • Figure 32: North America Market Attractiveness Analysis by Chamber Configuration
  • Figure 33: North America Market Value Share and BPS Analysis by Output Capacity, 2025 and 2035
  • Figure 34: North America Market Y-o-Y Growth Comparison by Output Capacity, 2025-2035
  • Figure 35: North America Market Attractiveness Analysis by Output Capacity
  • Figure 36: North America Market Value Share and BPS Analysis by Mixing Type, 2025 and 2035
  • Figure 37: North America Market Y-o-Y Growth Comparison by Mixing Type, 2025-2035
  • Figure 38: North America Market Attractiveness Analysis by Mixing Type
  • Figure 39: North America Market Value Share and BPS Analysis by Application, 2025 and 2035
  • Figure 40: North America Market Y-o-Y Growth Comparison by Application, 2025-2035
  • Figure 41: North America Market Attractiveness Analysis by Application
  • Figure 42: North America Market Value Share and BPS Analysis by End-Use Industry, 2025 and 2035
  • Figure 43: North America Market Y-o-Y Growth Comparison by End-Use Industry, 2025-2035
  • Figure 44: North America Market Attractiveness Analysis by End-Use Industry
  • Figure 45: Latin America Market Value Share and BPS Analysis by Country, 2025 and 2035
  • Figure 46: Latin America Market Value Share and BPS Analysis by Chamber Configuration, 2025 and 2035
  • Figure 47: Latin America Market Y-o-Y Growth Comparison by Chamber Configuration, 2025-2035
  • Figure 48: Latin America Market Attractiveness Analysis by Chamber Configuration
  • Figure 49: Latin America Market Value Share and BPS Analysis by Output Capacity, 2025 and 2035
  • Figure 50: Latin America Market Y-o-Y Growth Comparison by Output Capacity, 2025-2035
  • Figure 51: Latin America Market Attractiveness Analysis by Output Capacity
  • Figure 52: Latin America Market Value Share and BPS Analysis by Mixing Type, 2025 and 2035
  • Figure 53: Latin America Market Y-o-Y Growth Comparison by Mixing Type, 2025-2035
  • Figure 54: Latin America Market Attractiveness Analysis by Mixing Type
  • Figure 55: Latin America Market Value Share and BPS Analysis by Application, 2025 and 2035
  • Figure 56: Latin America Market Y-o-Y Growth Comparison by Application, 2025-2035
  • Figure 57: Latin America Market Attractiveness Analysis by Application
  • Figure 58: Latin America Market Value Share and BPS Analysis by End-Use Industry, 2025 and 2035
  • Figure 59: Latin America Market Y-o-Y Growth Comparison by End-Use Industry, 2025-2035
  • Figure 60: Latin America Market Attractiveness Analysis by End-Use Industry
  • Figure 61: Western Europe Market Value Share and BPS Analysis by Country, 2025 and 2035
  • Figure 62: Western Europe Market Value Share and BPS Analysis by Chamber Configuration, 2025 and 2035
  • Figure 63: Western Europe Market Y-o-Y Growth Comparison by Chamber Configuration, 2025-2035
  • Figure 64: Western Europe Market Attractiveness Analysis by Chamber Configuration
  • Figure 65: Western Europe Market Value Share and BPS Analysis by Output Capacity, 2025 and 2035
  • Figure 66: Western Europe Market Y-o-Y Growth Comparison by Output Capacity, 2025-2035
  • Figure 67: Western Europe Market Attractiveness Analysis by Output Capacity
  • Figure 68: Western Europe Market Value Share and BPS Analysis by Mixing Type, 2025 and 2035
  • Figure 69: Western Europe Market Y-o-Y Growth Comparison by Mixing Type, 2025-2035
  • Figure 70: Western Europe Market Attractiveness Analysis by Mixing Type
  • Figure 71: Western Europe Market Value Share and BPS Analysis by Application, 2025 and 2035
  • Figure 72: Western Europe Market Y-o-Y Growth Comparison by Application, 2025-2035
  • Figure 73: Western Europe Market Attractiveness Analysis by Application
  • Figure 74: Western Europe Market Value Share and BPS Analysis by End-Use Industry, 2025 and 2035
  • Figure 75: Western Europe Market Y-o-Y Growth Comparison by End-Use Industry, 2025-2035
  • Figure 76: Western Europe Market Attractiveness Analysis by End-Use Industry
  • Figure 77: Eastern Europe Market Value Share and BPS Analysis by Country, 2025 and 2035
  • Figure 78: Eastern Europe Market Value Share and BPS Analysis by Chamber Configuration, 2025 and 2035
  • Figure 79: Eastern Europe Market Y-o-Y Growth Comparison by Chamber Configuration, 2025-2035
  • Figure 80: Eastern Europe Market Attractiveness Analysis by Chamber Configuration
  • Figure 81: Eastern Europe Market Value Share and BPS Analysis by Output Capacity, 2025 and 2035
  • Figure 82: Eastern Europe Market Y-o-Y Growth Comparison by Output Capacity, 2025-2035
  • Figure 83: Eastern Europe Market Attractiveness Analysis by Output Capacity
  • Figure 84: Eastern Europe Market Value Share and BPS Analysis by Mixing Type, 2025 and 2035
  • Figure 85: Eastern Europe Market Y-o-Y Growth Comparison by Mixing Type, 2025-2035
  • Figure 86: Eastern Europe Market Attractiveness Analysis by Mixing Type
  • Figure 87: Eastern Europe Market Value Share and BPS Analysis by Application, 2025 and 2035
  • Figure 88: Eastern Europe Market Y-o-Y Growth Comparison by Application, 2025-2035
  • Figure 89: Eastern Europe Market Attractiveness Analysis by Application
  • Figure 90: Eastern Europe Market Value Share and BPS Analysis by End-Use Industry, 2025 and 2035
  • Figure 91: Eastern Europe Market Y-o-Y Growth Comparison by End-Use Industry, 2025-2035
  • Figure 92: Eastern Europe Market Attractiveness Analysis by End-Use Industry
  • Figure 93: East Asia Market Value Share and BPS Analysis by Country, 2025 and 2035
  • Figure 94: East Asia Market Value Share and BPS Analysis by Chamber Configuration, 2025 and 2035
  • Figure 95: East Asia Market Y-o-Y Growth Comparison by Chamber Configuration, 2025-2035
  • Figure 96: East Asia Market Attractiveness Analysis by Chamber Configuration
  • Figure 97: East Asia Market Value Share and BPS Analysis by Output Capacity, 2025 and 2035
  • Figure 98: East Asia Market Y-o-Y Growth Comparison by Output Capacity, 2025-2035
  • Figure 99: East Asia Market Attractiveness Analysis by Output Capacity
  • Figure 100: East Asia Market Value Share and BPS Analysis by Mixing Type, 2025 and 2035
  • Figure 101: East Asia Market Y-o-Y Growth Comparison by Mixing Type, 2025-2035
  • Figure 102: East Asia Market Attractiveness Analysis by Mixing Type
  • Figure 103: East Asia Market Value Share and BPS Analysis by Application, 2025 and 2035
  • Figure 104: East Asia Market Y-o-Y Growth Comparison by Application, 2025-2035
  • Figure 105: East Asia Market Attractiveness Analysis by Application
  • Figure 106: East Asia Market Value Share and BPS Analysis by End-Use Industry, 2025 and 2035
  • Figure 107: East Asia Market Y-o-Y Growth Comparison by End-Use Industry, 2025-2035
  • Figure 108: East Asia Market Attractiveness Analysis by End-Use Industry
  • Figure 109: South Asia & Pacific Market Value Share and BPS Analysis by Country, 2025 and 2035
  • Figure 110: South Asia & Pacific Market Value Share and BPS Analysis by Chamber Configuration, 2025 and 2035
  • Figure 111: South Asia & Pacific Market Y-o-Y Growth Comparison by Chamber Configuration, 2025-2035
  • Figure 112: South Asia & Pacific Market Attractiveness Analysis by Chamber Configuration
  • Figure 113: South Asia & Pacific Market Value Share and BPS Analysis by Output Capacity, 2025 and 2035
  • Figure 114: South Asia & Pacific Market Y-o-Y Growth Comparison by Output Capacity, 2025-2035
  • Figure 115: South Asia & Pacific Market Attractiveness Analysis by Output Capacity
  • Figure 116: South Asia & Pacific Market Value Share and BPS Analysis by Mixing Type, 2025 and 2035
  • Figure 117: South Asia & Pacific Market Y-o-Y Growth Comparison by Mixing Type, 2025-2035
  • Figure 118: South Asia & Pacific Market Attractiveness Analysis by Mixing Type
  • Figure 119: South Asia & Pacific Market Value Share and BPS Analysis by Application, 2025 and 2035
  • Figure 120: South Asia & Pacific Market Y-o-Y Growth Comparison by Application, 2025-2035
  • Figure 121: South Asia & Pacific Market Attractiveness Analysis by Application
  • Figure 122: South Asia & Pacific Market Value Share and BPS Analysis by End-Use Industry, 2025 and 2035
  • Figure 123: South Asia & Pacific Market Y-o-Y Growth Comparison by End-Use Industry, 2025-2035
  • Figure 124: South Asia & Pacific Market Attractiveness Analysis by End-Use Industry
  • Figure 125: Middle East and Africa Market Value Share and BPS Analysis by Country, 2025 and 2035
  • Figure 126: Middle East and Africa Market Value Share and BPS Analysis by Chamber Configuration, 2025 and 2035
  • Figure 127: Middle East and Africa Market Y-o-Y Growth Comparison by Chamber Configuration, 2025-2035
  • Figure 128: Middle East and Africa Market Attractiveness Analysis by Chamber Configuration
  • Figure 129: Middle East and Africa Market Value Share and BPS Analysis by Output Capacity, 2025 and 2035
  • Figure 130: Middle East and Africa Market Y-o-Y Growth Comparison by Output Capacity, 2025-2035
  • Figure 131: Middle East and Africa Market Attractiveness Analysis by Output Capacity
  • Figure 132: Middle East and Africa Market Value Share and BPS Analysis by Mixing Type, 2025 and 2035
  • Figure 133: Middle East and Africa Market Y-o-Y Growth Comparison by Mixing Type, 2025-2035
  • Figure 134: Middle East and Africa Market Attractiveness Analysis by Mixing Type
  • Figure 135: Middle East and Africa Market Value Share and BPS Analysis by Application, 2025 and 2035
  • Figure 136: Middle East and Africa Market Y-o-Y Growth Comparison by Application, 2025-2035
  • Figure 137: Middle East and Africa Market Attractiveness Analysis by Application
  • Figure 138: Middle East and Africa Market Value Share and BPS Analysis by End-Use Industry, 2025 and 2035
  • Figure 139: Middle East and Africa Market Y-o-Y Growth Comparison by End-Use Industry, 2025-2035
  • Figure 140: Middle East and Africa Market Attractiveness Analysis by End-Use Industry
  • Figure 141: Global Market - Tier Structure Analysis
  • Figure 142: Global Market - Company Share Analysis

Frequently Asked Questions

What is the projected size of the dual-chamber pumps market by 2035?

The industry is expected to reach USD 5.3 billion by 2035, growing at a 4.8% CAGR.

Which pump type holds the highest share in 2025?

Segmented chamber pumps lead with 61% of the market share in 2025.

What is the dominant end-use industry for dual-chamber pumps in 2025?

Skincare applications account for 47% of end-use demand in 2025.

Which country has the fastest growth rate in the dual-chamber pumps market?

China is projected to grow at a 4.6% CAGR from 2025 to 2035.

Who is the leading company in the dual-chamber pumps market and what is its market share?

APC Packaging leads the industry with an 18% global share.

Explore Similar Insights

Future Market Insights

Dual Chamber Pumps Market