Photoacoustic Tomography Market
Market Insights on Photoacoustic Tomography covering sales outlook, demand forecast & up-to-date key trends
Photoacoustic Tomography Market by Type, End User, Application & Region - Forecast 2022 - 2032
Photoacoustic Tomography Market Outlook (2022-2032)
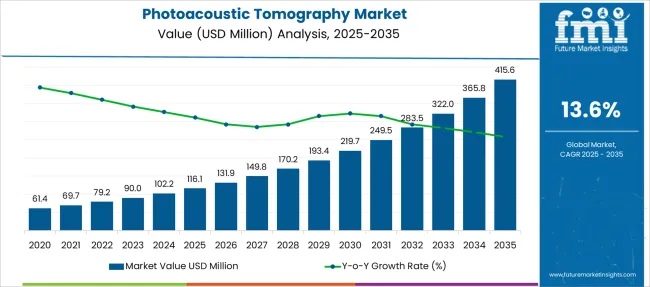
[333 Pages Report] The global photoacoustic tomography market is projected to reach US$ 79.2 million in 2022. Based on the report, sales of photoacoustic tomography are likely to soar at a CAGR of 13.60% to reach an evaluation of US$ 320.9 million by 2032.
Demand for photoacoustic tomography is on the rise owing to awareness about cancer diagnosis in its early stages and the prevalence of cancer.
Photoacoustic tomography is a non-invasive biomedical hybrid imaging technique that merges acoustic detection and optical excitation to recognize high resolution, high contrast, and deep penetration in biological tissues. This technique acquires images of biological tissues without using excising tissue or ionizing radiation. Photoacoustic tomography functions on the photoacoustic effect that transforms absorbed optical energy into acoustic energy. This is said to drive the growth of the photoacoustic tomography market.
Report Attribute |
Details |
Photoacoustic Tomography Market Value (2022) |
US$ 79.2 Million |
Photoacoustic Tomography Market Anticipated Value (2032) |
US$ 320.9 Million |
Photoacoustic Tomography Projected Growth Rate (2022-2032) |
13.60% |
The growth of the global photoacoustic tomography market is said to surge during the forecast period owing to the fact that this technique can be utilized in detecting physiological properties such as hemoglobin concentration and oxygen saturation. Furthermore, the functioning of the brain, tumor mapping, methemoglobin measuring, skin melanoma detection, and various others can be monitored with the assistance of the photoacoustic tomography technique. Also, with the help of photoacoustic tomography, 2D and 3D images can be formed.
The rising prevalence of breast cancer across the world, combined with a greater number of research studies in the fields of non-ionizing radiation for imaging, is propelling the growth of the photoacoustic tomography market.
For example, WHO stated that in 2020 there were nearly 2.3 million women diagnosed with breast cancer and approximately 685,000 deaths across the world. Furthermore, the rising extent of applications is equally impacting the expansion of the global market. Photoacoustic tomography is much enhanced as compared to any other diagnostic imaging system.
Photoacoustic tomography has faster imaging speed and sensitivity along with diagnostic accuracy and better handling. One of the key advantages of this technique is that it can be applied clinically on ultrasound machines, enabling molecular and cellular imaging to be added to the spectrum of traditional ultrasound imaging.
Several studies have shown the use of photoacoustic tomography imaging techniques for numerous applications. Also, multiple research activities have been conducted over the last ten years, and positive results on various diseases are studied with this technique, such as wound healing, cancer, brain disorders, etc.
Photoacoustic tomography delivers both functional as well as structural, optical information for deep tissues with scalable ultrasound resolution. Additional application of this technique in pre-clinical studies, as well as potential application in disease diagnosis and monitoring, is resulting in the lucrative growth of the global photoacoustic tomography market.
Let us know your requirement to get
100% FREE customization
Which are the Key Drivers and Restraining Factors in the Photoacoustic Tomography Market?
Recent developments by medical equipment manufacturers and various research groups in the past few years have resulted in increased adoption of photoacoustic tomography imaging technology in the medical segment, which boosts the market's growth during the forecast period.
Growth in pre-clinical studies about photoacoustic tomography in various research and academic institutes are some of the key factors predicted to promote the growth of the photoacoustic tomography market in the future. Moreover, the expanding imaging technique of photoacoustic imaging is predicted to fuel the market growth during the forecast period.
The increasing prevalence of chronic diseases such as cardiovascular and cancer are grave concerns in the healthcare industry. Still, these factors are said to support the lucrative growth of the photoacoustic tomography market. WHO says that in 2020, one of the leading causes of death was cancer across the world. This accounted for nearly 10 million deaths, with the most common type of cancer being lung and breast cancers.
Increasing awareness and the need for cancer detection at early stages have been driving key enhancements in medical and technology systems. In addition, advanced technology in non-invasive diagnosis and an increase in the application of non-ionizing radiation in healthcare science will encourage the demand for photoacoustic tomography to a substantial degree.
Moreover, several technologies, such as intravascular photoacoustic tomography, intravascular ultrasound (IVUS), and angiography, are used to detect cardiovascular diseases. The combined IVPA and IVUS imaging are utilized to characterize and detect atherosclerotic plaques. The demand for photoacoustic tomography is surging as it offers several advantages in atherosclerotic plaque imaging as compared to other techniques.
An upsurge in non-transmissible diseases cases, increasing demand for enhanced imaging methods, more cases of skin and eye-related diseases, surging demand by various oncology departments, and escalating awareness pertaining to early diagnosis procedures are some of the primary factors which promote the growth of photoacoustic tomography during the forecast period.
Additionally, support from the government is likely to further render prospective opportunities for the market growth of photoacoustic tomography in the future. However, photoacoustic imaging is expensive. This factor, coupled with strict regulations pertaining to laser usage, is anticipated to restrict the revenue growth of the market during the forecast period.
Lasers are known to be extremely precise and have high accuracy. However, they are cost-intensive systems that need high investments and funds. Therefore, new players find it challenging to penetrate and sustain in the market. Moreover, in the flow of research and development, surveillance in the case of pre-clinical applications on animals for research acts as a barrier. Lastly, the lack of skilled labor for the smooth operation of photoacoustic tomography is also said to hamper the growth of this market during the forecast period.
Why North America Holds a Significant Market Share in the Photoacoustic Tomography Market?
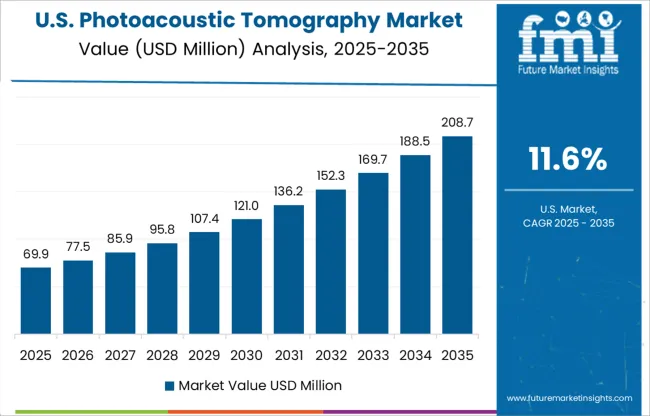
North America is dominating the global photoacoustic tomography market owing to rising pre-clinical studies related to this technique in several research and academic institutions. North America is responsible for holding a market share of 29.20% of the global market. The growing geriatric population and increasing cancer cases are among the key driving factors in the North American photoacoustic tomography market.
Safe non-ionizing radiation used in photoacoustic technology and the growing healthcare industry are key factors that are driving the market in this region. The initial cost of photoacoustic tomography is very high. This, along with the developing technology, can pose a challenge for the North American photoacoustic tomography market.
There is a constant upgradation in technology and features, which results in vendors attracting new consumers and growing their footprints in the upcoming markets. This factor is said to promote the growth of the photoacoustic tomography market in North America.
Find your sweet spots for generating winning opportunities in this market.
Talk to AnalystWhat is the Regional Outlook for the European Photoacoustic Tomography Market?
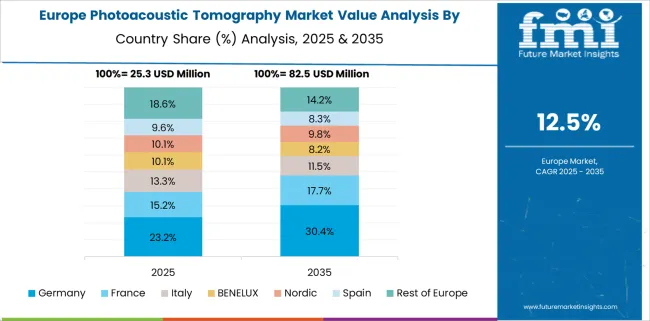
The increasing aged population coupled with the growing prevalence of cancer is the major driving factor of the Europe photoacoustic tomography market. Europe is responsible for holding a market share of 37.40% of the global market. Government support in developing innovative equipment, the trend of adoption of technology, and investment in research activities are accountable for the growth of the market in this region.
Moreover, increasing cases of fungal disease and infection are anticipated to promote market growth during the forecast period. In Europe, a country like Germany is anticipated to lead the market owing to constant research and the primary manufacturer being a major player in the industry.
How is the Start-up Ecosystem in the Photoacoustic Tomography Market?
The photoacoustic tomography industry opens numerous opportunities for new participants who concentrate on segments such as 3D imaging. For instance, in 2021, Luxonus, a Japanese start-up, produced a remarkable picture of the medial side of the lower leg. In practice, the colorized 3D showed the complex latticework of large and small vessels inside the leg and the blood flow through it. In comparison to any other type of medical imaging, the detail is unmatched. Luxonus used its novel devices, a game-altering photoacoustic 3D scanner that employs the novel science of photoacoustic imaging.
A unified Market Research Subscription Platform, built for today's disparate research needs.
Who are the Key Players in the Photoacoustic Tomography Market?
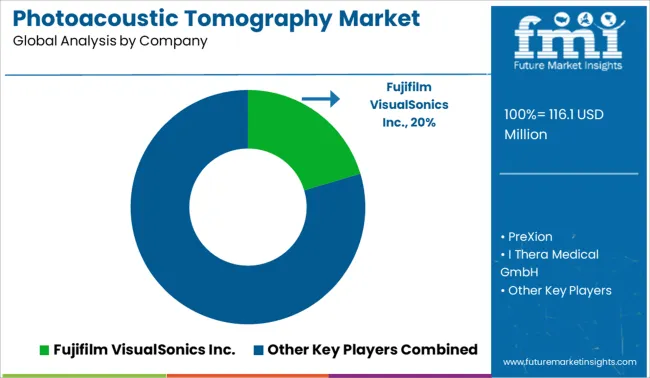
Some of the key players in the photoacoustic tomography market are Advantest Corporation; Fujifilm VisualSonics Inc., Seno Medical, PreXion, iThera Medical GmbH, InnoLas Laser GmbH, OPOTEK LLC, CYBERDYNE INC., TomoWave Laboratories, Inc., Aspectus GmbH, Endra, Inc., and others.
Market players have adopted strategies such as product approvals, product launches, market initiatives, and mergers and acquisitions. For example, in June 2020, FUJIFILM VisualSonics Inc, a subsidiary of FUJIFILM SonoSite, Inc, launched Vevo F2, the world’s first ultra-high-to-low-frequency ultrasound imaging system with a frequency range of 71-1 MHz.
In February 2022, FUJIFILM VisualSonics Inc and PIUR IMAGING, the European giant in tomographic ultrasound imaging, partnered to introduce UHF, which is a three-dimensional (3D) ultrasound imaging technology to researchers and clinicians.
Report Scope
Report Attribute |
Details |
Growth Rate |
CAGR of 13.60% from 2022 to 2032 |
Base Year for Estimation |
2021 |
Historical Data |
2016-2021 |
Forecast Period |
2022-2032 |
Quantitative Units |
Revenue in USD million and CAGR from 2022-2032 |
Report Coverage |
Revenue Forecast, Volume Forecast, Company Ranking, Competitive Landscape, Growth Factors, Trends and Pricing Analysis |
Segments Covered |
|
Regions Covered |
|
Key Countries Profiled |
|
Key Companies Profiled |
|
Customization |
Available Upon Request |
Key Segments of the Photoacoustic Tomography Market
By Type:
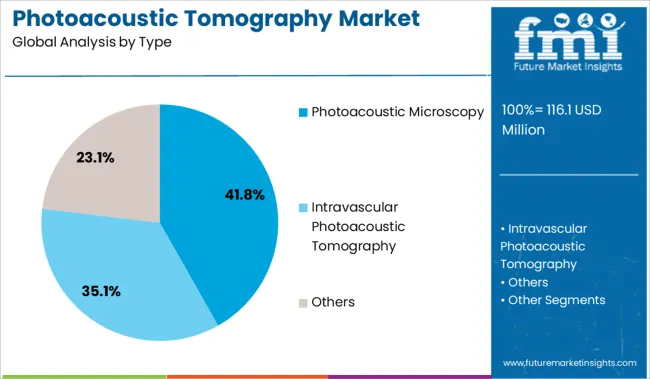
- Photoacoustic Microscopy
- Intravascular Photoacoustic Tomography
- Others
By Application:
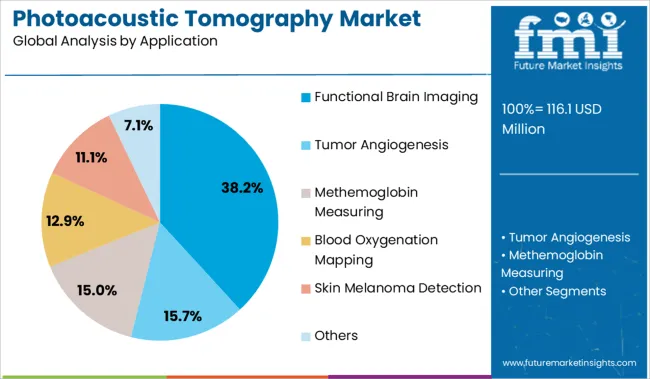
- Functional Brain Imaging
- Tumor Angiogenesis
- Methemoglobin Measuring
- Blood Oxygenation Mapping
- Skin Melanoma Detection
- Others
By End User:
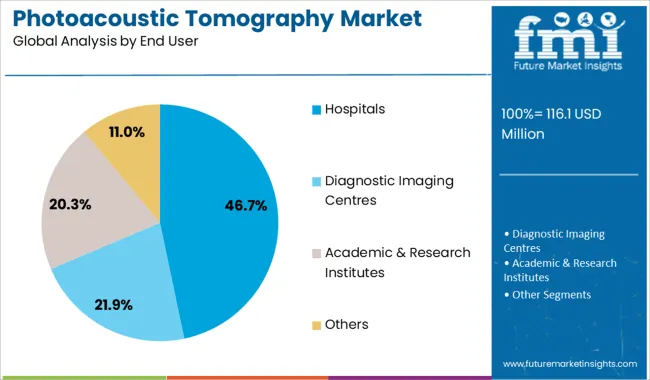
- Hospitals
- Diagnostic Imaging Centres
- Academic & Research Institutes
- Others
By Region:
- North America
- Latin America
- Europe
- MEA
- Asia Pacific
Frequently Asked Questions
The growth outlook for the photoacoustic tomography market is predicted to advance at a CAGR of 13.60% from 2022 to 2032.
The North American region is anticipated to lead the photoacoustic tomography market during the forecast period.
The photoacoustic tomography market is likely to hold a valuation of US$ 320.9 million by 2032.
Table of Content
1. Executive Summary
1.1. Global Market Outlook
1.2. Demand-side Trends
1.3. Supply-side Trends
1.4. Technology Roadmap Analysis
1.5. Analysis and Recommendations
2. Market Overview
2.1. Market Coverage / Taxonomy
2.2. Market Definition / Scope / Limitations
3. Market Background
3.1. Market Dynamics
3.1.1. Drivers
3.1.2. Restraints
3.1.3. Opportunity
3.1.4. Trends
3.2. Scenario Forecast
3.2.1. Demand in Optimistic Scenario
3.2.2. Demand in Likely Scenario
3.2.3. Demand in Conservative Scenario
3.3. Opportunity Map Analysis
3.4. Investment Feasibility Matrix
3.5. PESTLE and Porter’s Analysis
3.6. Regulatory Landscape
3.6.1. By Key Regions
3.6.2. By Key Countries
3.7. Regional Parent Market Outlook
4. Global Market Analysis 2017-2021 and Forecast, 2022-2032
4.1. Historical Market Size Value (US$ Mn) Analysis, 2017-2021
4.2. Current and Future Market Size Value (US$ Mn) Projections, 2022-2032
4.2.1. Y-o-Y Growth Trend Analysis
4.2.2. Absolute $ Opportunity Analysis
5. Global Market Analysis 2017-2021 and Forecast 2022-2032, By Application
5.1. Introduction / Key Findings
5.2. Historical Market Size Value (US$ Mn) Analysis By Application, 2017-2021
5.3. Current and Future Market Size Value (US$ Mn) Analysis and Forecast By Application, 2022-2032
5.3.1. Diagnosis & Monitoring
5.3.2. Clinical Research
5.4. Y-o-Y Growth Trend Analysis By Application, 2017-2021
5.5. Absolute $ Opportunity Analysis By Application, 2022-2032
6. Global Market Analysis 2017-2021 and Forecast 2022-2032, By End User
6.1. Introduction / Key Findings
6.2. Historical Market Size Value (US$ Mn) Analysis By End User, 2017-2021
6.3. Current and Future Market Size Value (US$ Mn) Analysis and Forecast By End User, 2022-2032
6.3.1. Hospitals
6.3.2. Diagnostics Imaging Centers
6.3.3. Academic and Research Institutes
6.4. Y-o-Y Growth Trend Analysis By End User, 2017-2021
6.5. Absolute $ Opportunity Analysis By End User, 2022-2032
7. Global Market Analysis 2017-2021 and Forecast 2022-2032, By Region
7.1. Introduction
7.2. Historical Market Size Value (US$ Mn) Analysis By Region, 2017-2021
7.3. Current Market Size Value (US$ Mn) Analysis and Forecast By Region, 2022-2032
7.3.1. North America
7.3.2. Latin America
7.3.3. Europe
7.3.4. Asia Pacific
7.3.5. MEA
7.4. Market Attractiveness Analysis By Region
8. North America Market Analysis 2017-2021 and Forecast 2022-2032, By Country
8.1. Historical Market Size Value (US$ Mn) Trend Analysis By Market Taxonomy, 2017-2021
8.2. Market Size Value (US$ Mn) Forecast By Market Taxonomy, 2022-2032
8.2.1. By Country
8.2.1.1. U.S.
8.2.1.2. Canada
8.2.2. By Application
8.2.3. By End User
8.3. Market Attractiveness Analysis
8.3.1. By Country
8.3.2. By Application
8.3.3. By End User
8.4. Key Takeaways
9. Latin America Market Analysis 2017-2021 and Forecast 2022-2032, By Country
9.1. Historical Market Size Value (US$ Mn) Trend Analysis By Market Taxonomy, 2017-2021
9.2. Market Size Value (US$ Mn) Forecast By Market Taxonomy, 2022-2032
9.2.1. By Country
9.2.1.1. Brazil
9.2.1.2. Mexico
9.2.1.3. Rest of Latin America
9.2.2. By Application
9.2.3. By End User
9.3. Market Attractiveness Analysis
9.3.1. By Country
9.3.2. By Application
9.3.3. By End User
9.4. Key Takeaways
10. Europe Market Analysis 2017-2021 and Forecast 2022-2032, By Country
10.1. Historical Market Size Value (US$ Mn) Trend Analysis By Market Taxonomy, 2017-2021
10.2. Market Size Value (US$ Mn) Forecast By Market Taxonomy, 2022-2032
10.2.1. By Country
10.2.1.1. Germany
10.2.1.2. U.K.
10.2.1.3. France
10.2.1.4. Spain
10.2.1.5. Italy
10.2.1.6. Rest of Europe
10.2.2. By Application
10.2.3. By End User
10.3. Market Attractiveness Analysis
10.3.1. By Country
10.3.2. By Application
10.3.3. By End User
10.4. Key Takeaways
11. Asia Pacific Market Analysis 2017-2021 and Forecast 2022-2032, By Country
11.1. Historical Market Size Value (US$ Mn) Trend Analysis By Market Taxonomy, 2017-2021
11.2. Market Size Value (US$ Mn) Forecast By Market Taxonomy, 2022-2032
11.2.1. By Country
11.2.1.1. China
11.2.1.2. Japan
11.2.1.3. South Korea
11.2.1.4. India
11.2.1.5. Malaysia
11.2.1.6. Singapore
11.2.1.7. Australia
11.2.1.8. New Zealand
11.2.1.9. Rest of APAC
11.2.2. By Application
11.2.3. By End User
11.3. Market Attractiveness Analysis
11.3.1. By Country
11.3.2. By Application
11.3.3. By End User
11.4. Key Takeaways
12. MEA Market Analysis 2017-2021 and Forecast 2022-2032, By Country
12.1. Historical Market Size Value (US$ Mn) Trend Analysis By Market Taxonomy, 2017-2021
12.2. Market Size Value (US$ Mn) Forecast By Market Taxonomy, 2022-2032
12.2.1. By Country
12.2.1.1. GCC Countries
12.2.1.2. South Africa
12.2.1.3. Israel
12.2.1.4. Rest of MEA
12.2.2. By Application
12.2.3. By End User
12.3. Market Attractiveness Analysis
12.3.1. By Country
12.3.2. By Application
12.3.3. By End User
12.4. Key Takeaways
13. Key Countries Market Analysis
13.1. U.S.
13.1.1. Pricing Analysis
13.1.2. Market Share Analysis, 2021
13.1.2.1. By Application
13.1.2.2. By End User
13.2. Canada
13.2.1. Pricing Analysis
13.2.2. Market Share Analysis, 2021
13.2.2.1. By Application
13.2.2.2. By End User
13.3. Brazil
13.3.1. Pricing Analysis
13.3.2. Market Share Analysis, 2021
13.3.2.1. By Application
13.3.2.2. By End User
13.4. Mexico
13.4.1. Pricing Analysis
13.4.2. Market Share Analysis, 2021
13.4.2.1. By Application
13.4.2.2. By End User
13.5. Germany
13.5.1. Pricing Analysis
13.5.2. Market Share Analysis, 2021
13.5.2.1. By Application
13.5.2.2. By End User
13.6. U.K.
13.6.1. Pricing Analysis
13.6.2. Market Share Analysis, 2021
13.6.2.1. By Application
13.6.2.2. By End User
13.7. France
13.7.1. Pricing Analysis
13.7.2. Market Share Analysis, 2021
13.7.2.1. By Application
13.7.2.2. By End User
13.8. Spain
13.8.1. Pricing Analysis
13.8.2. Market Share Analysis, 2021
13.8.2.1. By Application
13.8.2.2. By End User
13.9. Italy
13.9.1. Pricing Analysis
13.9.2. Market Share Analysis, 2021
13.9.2.1. By Application
13.9.2.2. By End User
13.10. China
13.10.1. Pricing Analysis
13.10.2. Market Share Analysis, 2021
13.10.2.1. By Application
13.10.2.2. By End User
13.11. Japan
13.11.1. Pricing Analysis
13.11.2. Market Share Analysis, 2021
13.11.2.1. By Application
13.11.2.2. By End User
13.12. South Korea
13.12.1. Pricing Analysis
13.12.2. Market Share Analysis, 2021
13.12.2.1. By Application
13.12.2.2. By End User
13.13. Malaysia
13.13.1. Pricing Analysis
13.13.2. Market Share Analysis, 2021
13.13.2.1. By Application
13.13.2.2. By End User
13.14. Singapore
13.14.1. Pricing Analysis
13.14.2. Market Share Analysis, 2021
13.14.2.1. By Application
13.14.2.2. By End User
13.15. Australia
13.15.1. Pricing Analysis
13.15.2. Market Share Analysis, 2021
13.15.2.1. By Application
13.15.2.2. By End User
13.16. New Zealand
13.16.1. Pricing Analysis
13.16.2. Market Share Analysis, 2021
13.16.2.1. By Application
13.16.2.2. By End User
13.17. GCC Countries
13.17.1. Pricing Analysis
13.17.2. Market Share Analysis, 2021
13.17.2.1. By Application
13.17.2.2. By End User
13.18. South Africa
13.18.1. Pricing Analysis
13.18.2. Market Share Analysis, 2021
13.18.2.1. By Application
13.18.2.2. By End User
13.19. Israel
13.19.1. Pricing Analysis
13.19.2. Market Share Analysis, 2021
13.19.2.1. By Application
13.19.2.2. By End User
14. Market Structure Analysis
14.1. Competition Dashboard
14.2. Competition Benchmarking
14.3. Market Share Analysis of Top Players
14.3.1. By Regional
14.3.2. By Application
14.3.3. By End User
15. Competition Analysis
15.1. Competition Deep Dive
15.1.1. Fujifilm VisualSonics Inc.
15.1.1.1. Overview
15.1.1.2. Product Portfolio
15.1.1.3. Profitability by Market Segments
15.1.1.4. Sales Footprint
15.1.1.5. Strategy Overview
15.1.1.5.1. Marketing Strategy
15.1.2. PreXion
15.1.2.1. Overview
15.1.2.2. Product Portfolio
15.1.2.3. Profitability by Market Segments
15.1.2.4. Sales Footprint
15.1.2.5. Strategy Overview
15.1.2.5.1. Marketing Strategy
15.1.3. iThera Medical GmbH
15.1.3.1. Overview
15.1.3.2. Product Portfolio
15.1.3.3. Profitability by Market Segments
15.1.3.4. Sales Footprint
15.1.3.5. Strategy Overview
15.1.3.5.1. Marketing Strategy
15.1.4. Endra, Inc.
15.1.4.1. Overview
15.1.4.2. Product Portfolio
15.1.4.3. Profitability by Market Segments
15.1.4.4. Sales Footprint
15.1.4.5. Strategy Overview
15.1.4.5.1. Marketing Strategy
15.1.5. TomoWave Laboratories, Inc.
15.1.5.1. Overview
15.1.5.2. Product Portfolio
15.1.5.3. Profitability by Market Segments
15.1.5.4. Sales Footprint
15.1.5.5. Strategy Overview
15.1.5.5.1. Marketing Strategy
15.1.6. OPOTEK LLC.
15.1.6.1. Overview
15.1.6.2. Product Portfolio
15.1.6.3. Profitability by Market Segments
15.1.6.4. Sales Footprint
15.1.6.5. Strategy Overview
15.1.6.5.1. Marketing Strategy
15.1.7. Seno Medical Instruments
15.1.7.1. Overview
15.1.7.2. Product Portfolio
15.1.7.3. Profitability by Market Segments
15.1.7.4. Sales Footprint
15.1.7.5. Strategy Overview
15.1.7.5.1. Marketing Strategy
15.1.8. Advantest Corporation
15.1.8.1. Overview
15.1.8.2. Product Portfolio
15.1.8.3. Profitability by Market Segments
15.1.8.4. Sales Footprint
15.1.8.5. Strategy Overview
15.1.8.5.1. Marketing Strategy
15.1.9. Aspectus GmbH
15.1.9.1. Overview
15.1.9.2. Product Portfolio
15.1.9.3. Profitability by Market Segments
15.1.9.4. Sales Footprint
15.1.9.5. Strategy Overview
15.1.9.5.1. Marketing Strategy
15.1.10. kibero
15.1.10.1. Overview
15.1.10.2. Product Portfolio
15.1.10.3. Profitability by Market Segments
15.1.10.4. Sales Footprint
15.1.10.5. Strategy Overview
15.1.10.5.1. Marketing Strategy
16. Assumptions & Acronyms Used
17. Research Methodology
Let us know your requirement to get
100% FREE customization
List of Tables
Table 1: Global Market Value (US$ Mn) Forecast by Region, 2017-2032
Table 2: Global Market Value (US$ Mn) Forecast by Application, 2017-2032
Table 3: Global Market Value (US$ Mn) Forecast by End User, 2017-2032
Table 4: North America Market Value (US$ Mn) Forecast by Country, 2017-2032
Table 5: North America Market Value (US$ Mn) Forecast by Application, 2017-2032
Table 6: North America Market Value (US$ Mn) Forecast by End User, 2017-2032
Table 7: Latin America Market Value (US$ Mn) Forecast by Country, 2017-2032
Table 8: Latin America Market Value (US$ Mn) Forecast by Application, 2017-2032
Table 9: Latin America Market Value (US$ Mn) Forecast by End User, 2017-2032
Table 10: Europe Market Value (US$ Mn) Forecast by Country, 2017-2032
Table 11: Europe Market Value (US$ Mn) Forecast by Application, 2017-2032
Table 12: Europe Market Value (US$ Mn) Forecast by End User, 2017-2032
Table 13: Asia Pacific Market Value (US$ Mn) Forecast by Country, 2017-2032
Table 14: Asia Pacific Market Value (US$ Mn) Forecast by Application, 2017-2032
Table 15: Asia Pacific Market Value (US$ Mn) Forecast by End User, 2017-2032
Table 16: MEA Market Value (US$ Mn) Forecast by Country, 2017-2032
Table 17: MEA Market Value (US$ Mn) Forecast by Application, 2017-2032
Table 18: MEA Market Value (US$ Mn) Forecast by End User, 2017-2032
Find your sweet spots for generating winning opportunities in this market.
Talk to AnalystList of Charts
Figure 1: Global Market Value (US$ Mn) by Application, 2022-2032
Figure 2: Global Market Value (US$ Mn) by End User, 2022-2032
Figure 3: Global Market Value (US$ Mn) by Region, 2022-2032
Figure 4: Global Market Value (US$ Mn) Analysis by Region, 2017-2032
Figure 5: Global Market Value Share (%) and BPS Analysis by Region, 2022-2032
Figure 6: Global Market Y-o-Y Growth (%) Projections by Region, 2022-2032
Figure 7: Global Market Value (US$ Mn) Analysis by Application, 2017-2032
Figure 8: Global Market Value Share (%) and BPS Analysis by Application, 2022-2032
Figure 9: Global Market Y-o-Y Growth (%) Projections by Application, 2022-2032
Figure 10: Global Market Value (US$ Mn) Analysis by End User, 2017-2032
Figure 11: Global Market Value Share (%) and BPS Analysis by End User, 2022-2032
Figure 12: Global Market Y-o-Y Growth (%) Projections by End User, 2022-2032
Figure 13: Global Market Attractiveness by Application, 2022-2032
Figure 14: Global Market Attractiveness by End User, 2022-2032
Figure 15: Global Market Attractiveness by Region, 2022-2032
Figure 16: North America Market Value (US$ Mn) by Application, 2022-2032
Figure 17: North America Market Value (US$ Mn) by End User, 2022-2032
Figure 18: North America Market Value (US$ Mn) by Country, 2022-2032
Figure 19: North America Market Value (US$ Mn) Analysis by Country, 2017-2032
Figure 20: North America Market Value Share (%) and BPS Analysis by Country, 2022-2032
Figure 21: North America Market Y-o-Y Growth (%) Projections by Country, 2022-2032
Figure 22: North America Market Value (US$ Mn) Analysis by Application, 2017-2032
Figure 23: North America Market Value Share (%) and BPS Analysis by Application, 2022-2032
Figure 24: North America Market Y-o-Y Growth (%) Projections by Application, 2022-2032
Figure 25: North America Market Value (US$ Mn) Analysis by End User, 2017-2032
Figure 26: North America Market Value Share (%) and BPS Analysis by End User, 2022-2032
Figure 27: North America Market Y-o-Y Growth (%) Projections by End User, 2022-2032
Figure 28: North America Market Attractiveness by Application, 2022-2032
Figure 29: North America Market Attractiveness by End User, 2022-2032
Figure 30: North America Market Attractiveness by Country, 2022-2032
Figure 31: Latin America Market Value (US$ Mn) by Application, 2022-2032
Figure 32: Latin America Market Value (US$ Mn) by End User, 2022-2032
Figure 33: Latin America Market Value (US$ Mn) by Country, 2022-2032
Figure 34: Latin America Market Value (US$ Mn) Analysis by Country, 2017-2032
Figure 35: Latin America Market Value Share (%) and BPS Analysis by Country, 2022-2032
Figure 36: Latin America Market Y-o-Y Growth (%) Projections by Country, 2022-2032
Figure 37: Latin America Market Value (US$ Mn) Analysis by Application, 2017-2032
Figure 38: Latin America Market Value Share (%) and BPS Analysis by Application, 2022-2032
Figure 39: Latin America Market Y-o-Y Growth (%) Projections by Application, 2022-2032
Figure 40: Latin America Market Value (US$ Mn) Analysis by End User, 2017-2032
Figure 41: Latin America Market Value Share (%) and BPS Analysis by End User, 2022-2032
Figure 42: Latin America Market Y-o-Y Growth (%) Projections by End User, 2022-2032
Figure 43: Latin America Market Attractiveness by Application, 2022-2032
Figure 44: Latin America Market Attractiveness by End User, 2022-2032
Figure 45: Latin America Market Attractiveness by Country, 2022-2032
Figure 46: Europe Market Value (US$ Mn) by Application, 2022-2032
Figure 47: Europe Market Value (US$ Mn) by End User, 2022-2032
Figure 48: Europe Market Value (US$ Mn) by Country, 2022-2032
Figure 49: Europe Market Value (US$ Mn) Analysis by Country, 2017-2032
Figure 50: Europe Market Value Share (%) and BPS Analysis by Country, 2022-2032
Figure 51: Europe Market Y-o-Y Growth (%) Projections by Country, 2022-2032
Figure 52: Europe Market Value (US$ Mn) Analysis by Application, 2017-2032
Figure 53: Europe Market Value Share (%) and BPS Analysis by Application, 2022-2032
Figure 54: Europe Market Y-o-Y Growth (%) Projections by Application, 2022-2032
Figure 55: Europe Market Value (US$ Mn) Analysis by End User, 2017-2032
Figure 56: Europe Market Value Share (%) and BPS Analysis by End User, 2022-2032
Figure 57: Europe Market Y-o-Y Growth (%) Projections by End User, 2022-2032
Figure 58: Europe Market Attractiveness by Application, 2022-2032
Figure 59: Europe Market Attractiveness by End User, 2022-2032
Figure 60: Europe Market Attractiveness by Country, 2022-2032
Figure 61: Asia Pacific Market Value (US$ Mn) by Application, 2022-2032
Figure 62: Asia Pacific Market Value (US$ Mn) by End User, 2022-2032
Figure 63: Asia Pacific Market Value (US$ Mn) by Country, 2022-2032
Figure 64: Asia Pacific Market Value (US$ Mn) Analysis by Country, 2017-2032
Figure 65: Asia Pacific Market Value Share (%) and BPS Analysis by Country, 2022-2032
Figure 66: Asia Pacific Market Y-o-Y Growth (%) Projections by Country, 2022-2032
Figure 67: Asia Pacific Market Value (US$ Mn) Analysis by Application, 2017-2032
Figure 68: Asia Pacific Market Value Share (%) and BPS Analysis by Application, 2022-2032
Figure 69: Asia Pacific Market Y-o-Y Growth (%) Projections by Application, 2022-2032
Figure 70: Asia Pacific Market Value (US$ Mn) Analysis by End User, 2017-2032
Figure 71: Asia Pacific Market Value Share (%) and BPS Analysis by End User, 2022-2032
Figure 72: Asia Pacific Market Y-o-Y Growth (%) Projections by End User, 2022-2032
Figure 73: Asia Pacific Market Attractiveness by Application, 2022-2032
Figure 74: Asia Pacific Market Attractiveness by End User, 2022-2032
Figure 75: Asia Pacific Market Attractiveness by Country, 2022-2032
Figure 76: MEA Market Value (US$ Mn) by Application, 2022-2032
Figure 77: MEA Market Value (US$ Mn) by End User, 2022-2032
Figure 78: MEA Market Value (US$ Mn) by Country, 2022-2032
Figure 79: MEA Market Value (US$ Mn) Analysis by Country, 2017-2032
Figure 80: MEA Market Value Share (%) and BPS Analysis by Country, 2022-2032
Figure 81: MEA Market Y-o-Y Growth (%) Projections by Country, 2022-2032
Figure 82: MEA Market Value (US$ Mn) Analysis by Application, 2017-2032
Figure 83: MEA Market Value Share (%) and BPS Analysis by Application, 2022-2032
Figure 84: MEA Market Y-o-Y Growth (%) Projections by Application, 2022-2032
Figure 85: MEA Market Value (US$ Mn) Analysis by End User, 2017-2032
Figure 86: MEA Market Value Share (%) and BPS Analysis by End User, 2022-2032
Figure 87: MEA Market Y-o-Y Growth (%) Projections by End User, 2022-2032
Figure 88: MEA Market Attractiveness by Application, 2022-2032
Figure 89: MEA Market Attractiveness by End User, 2022-2032
Figure 90: MEA Market Attractiveness by Country, 2022-2032
Need specific information?
Request CustomizationExplore Healthcare Insights
View Reports