Mobile Tomography Market
New Market for Mobile Tomography Is Being Created by Disruptive Technologies.: Track More Trends with FMI
Mobile Tomography Market by Number of Slices, Application, End User & Region - Forecast 2022 - 2032
Mobile Tomography Market Outlook (2022-2032)
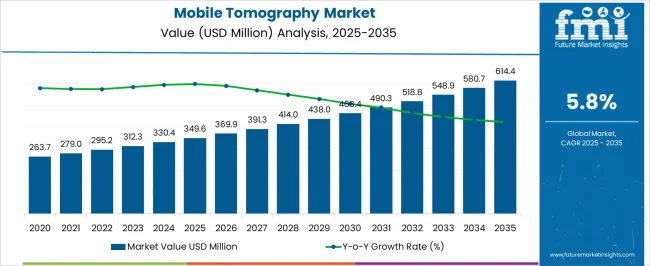
[324 Pages Report] A 5.8% compound annual growth rate (CAGR) is projected for the global mobile tomography market from 2022-2032, with 2022 revenues of US$ 295.2 Mn and 2032 revenues of US$ 595.1 Mn. The growth of the market is being sustained by:
- Adoption of minimally invasive operations
- Increasing public awareness about the need for early disease identification
- Changes in the economic and technological landscapes of a variety of nations
Report Attribute |
Details |
Mobile Tomography Market Value (2022) |
US$ 295.2 Mn |
Mobile Tomography Market Anticipated Value (2032) |
US$ 595.1 Mn |
Mobile Tomography Projected Growth Rate (2032) |
5.8% |
The expansion of this sector could be stymied by the fact that transportable computed tomography scanners have been linked to health problems like headaches and nausea. The mobile tomography market is expected to expand due to the device's ease of use and portability.
The use of portable CT scanners in healthcare settings has been quite fruitful. Successful applications of CT scanner technology in malignancies, trauma, unexplained chronic headache, and disease staging have created new growth prospects for the mobile tomography market.
Let us know your requirement to get
100% FREE customization
Samsung's New Mobile CT OmniTom Is a Breakthrough in Technology
OmniTom is Samsung's newest proof of its superiority in the mobile tomography market. In comparison to Samsung's previous generation CereTom CT scanner, the newer OmniTom model, has several notable upgrades, such as:
- OmniTom is the first mobile imaging device with omni-directional wheels, improving workflow by making it possible to move around quickly and silently, even in confined situations.
- With its cutting-edge data-collecting system and efficient dose optimization, the 16-slice (0.625 mm per slice) scanner produces images of exceptional quality.
- The gantry opening has been increased to 40 cm, allowing for better coverage of adult head and neck and full body paediatric scanning while maintaining a small footprint suitable for mobile applications.
- OmniTom has an internal drive system, making portability easier, and smart-sensing collision avoidance software, which contributes to improved control and patient safety.
Innovations Taking the Mobile Tomography Market by Storm
Next-generation CT technologies include Samsung's spectral CT with Photon Counting Detector (PCD). The healthcare solutions presented by the Samsung team include mobile CT, digital radiography, and ultrasound, all of which aim to close the gap in care delivery and increase productivity for a better patient experience. Solutions like these include:
In the ultrasound market, Samsung will showcase its whole line of ultrasound equipment, including the recently released HS60 and HS40. Three daily instructional presentations with live scanning will showcase the RS80A with Prestige, Samsung's top-tier general-imaging ultrasound system. The RS80A's cutting-edge features are a welcome boon to clinical confidence in a department as high-volume as radiology. The company is building on its success in obstetrics and gynaecology ultrasonic diagnosis equipment to expand into radiology, the sector with the most promising future.
In the digital radiography market, Samsung will showcase an extensive product line-up, including the GC85 and GC70, two ceiling-mounted systems, and the GM85, a premium portable X-ray. Users will enjoy unprecedented productivity and stunning visuals because of the GM85's improved portability and simpler workflow. Samsung's low-dose technology, which aims to improve patient safety, is another way it stands apart from the competition.
Samsung will display an early model of their Specialty MRI equipment, an MRI scanner designed to image extremities. The prototype is being heralded as a game-changer in the business because of its innovative approach to MRI scanning that reduces the need for patients to place their entire bodies within the machine, saving both time and money.
Find your sweet spots for generating winning opportunities in this market.
Talk to AnalystDrivers & Restraints of the Mobile Tomography Market
As a result of several valid concerns about cost and access, mobile CT scanners are increasingly favoured over permanently installed ones in hospitals. Healthcare providers in some regions, such as North America, are opting to use mobile CT scanners rather than permanently installed ones due to the long wait times and high costs associated with purchasing fixed CT. Key advantages include less work for medical staff, shorter hospital stays, faster access to CT for outpatients, and quicker provision of essential services for inpatients. This is changing the global mobile tomography market outlook.
Patients appreciate CT scanners largely because they don't require any patient interaction beyond looking at the image on the screen. High adaptability and decreased operating and capital costs propel the CT scanners market. Mobile tomography market growth can be directly attributed to these devices' superior safety and sensitivity.
One trend helping to create opportunities in the mobile tomography market is the rising demand for mobile CT scanners in diagnostic services in both emerging and developed countries. The increasing adoption of mobile tomography to diagnose and treat neurological disorders is a major factor driving market growth. As a result of their low risk of infection and recovery time, mobile CT scanners have become increasingly popular.
However, the mobile tomography market is likely to be stymied by factors such as a clearly defined regulatory framework and a lack of suitable reimbursement. High product costs and one-time installations at individual facilities slow the mobile tomography market's expansion.
Since mobile tomography is still a novel service, so a lack of trained specialists is expected to restrain the industry's expansion further. Additionally, mobile tomography is projected to have slow mobile tomography market expansion because of specific adverse effects, such as nausea and headache.
Regional Insights
Outlook of North American Mobile Tomography Market
Due to factors such as increasing demand for healthcare services and diagnostic centers, as well as greater public knowledge about the importance of early disease detection, the regional North American mobile tomography market is anticipated to expand rapidly throughout the forecast period.
Greater access to high-quality medical care in industrialized nations is a major factor in why these economies generate more money than those in the developing world.
Outlook of Asia Pacific Mobile Tomography Market
Due to factors such as the region's developing healthcare infrastructure, rising chronic disease rates, rising disposable incomes, the strength of home-grown businesses, and the rapid growth of the region's elderly population, the Asia-Pacific region presents lucrative opportunities for leaders in the mobile tomography market. The expansion of Asia's mobile tomography market is anticipated to be bolstered by the improving economies of emerging markets like India and China. More government efforts to build new community health and oncology centres are expected to enhance the use of mobile medical imaging in underserved areas

A unified Market Research Subscription Platform, built for today's disparate research needs.
Startup Ecosystem
The future of the mobile tomography market is anticipated to be shaped by the key developments of new firms. Manufacturers in the mobile tomography market are investing heavily in R&D to produce increasingly sophisticated mobile tomography solutions, opening numerous potential opportunities in the market. Mobile tomography is expected to increase as a market since it is widely favoured by patients who have suffered a stroke due to the short time required for scanning.
Start-up company FITPU healthcare has created an image analytics platform called Mltalytics. Tissue analysis for malignant tumours is performed, and dynamic contrast-enhanced and multi-parametric imaging are supported.
Recent Developments in the Mobile Tomography
- In 2020, X-Ray was the most lucrative subsector of the mobile tomography market worldwide, and this trend is expected to persist through 2025.
- Patients greatly appreciate CT scanners because they pose no risk to the patient.
- The increasing use of mobile tomography systems in diagnosing and treating neurological illnesses is a major factor driving market growth. The minimally invasive nature of mobile tomography has contributed to the growth of the market for such devices.
Some of the key players of mobile tomography are
- Xoran Technologies
- LLC. NeuroLogica Corp.
- Planmed OY
- Brainlab AG
- Dixion distribution of medical devices GmbH
- United Imaging Healthcare
- Sino Vision
- Samsung Electronics
- Olympus Corporation
- Karl Storz GmbH & Co.Kg
- Koninklijke Philips
- Hitachi Medical Corporation
- GE Healthcare
- Medtronics
Report Scope
Report Attribute |
Details |
Growth Rate |
5.8% |
Base Year for Estimation |
2021 |
Historical Data |
2016-2021 |
Forecast Period |
2022-2032 |
Quantitative Units |
Revenue in US$ million and CAGR from 2022-2032 |
Report Coverage |
Revenue Forecast, Volume Forecast, Company Ranking, Competitive Landscape, Growth Factors, Trends, and Pricing Analysis |
Segments Covered |
Number of Slices, Application, End-User, Region |
Regions Covered |
|
Key Countries Profiled |
|
Key Companies Profiled |
|
Customization |
Available Upon Request |
Key Segments
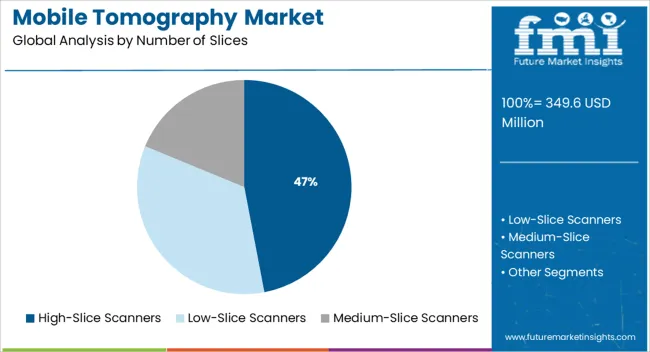
Number of Slices:
- Low-Slice Scanners
- Medium-Slice Scanners
- High-Slice Scanners
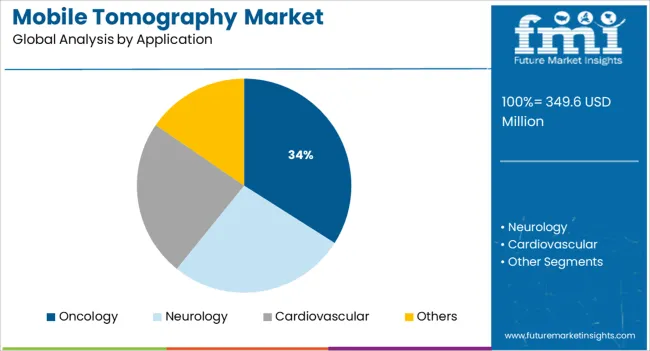
Application:
- Oncology
- Neurology
- Cardiovascular
- Others
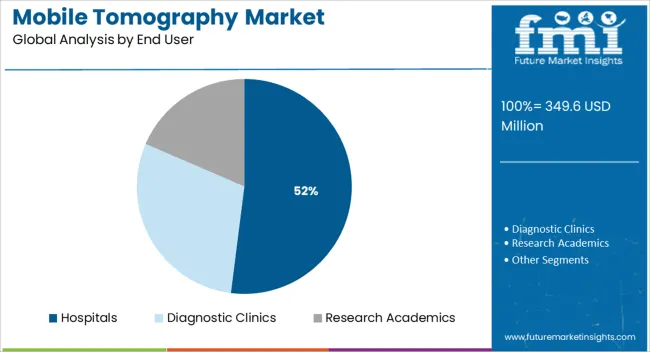
End User:
- Hospitals
- Diagnostic Clinics
- Research Academics
Region:
- North America
- Latin America
- Asia Pacific
- MEA
- Europe
Frequently Asked Questions
North America is anticipated to lead the mobile tomography market during the forecast period.
The mobile tomography market is likely to hold a valuation of US$ 595.1 Mn by 2032.
The growth outlook of mobile tomography market is predicted to advance at a CAGR of 5.8% from 2022 to 2032.
Table of Content
1. Executive Summary
1.1. Global Market Outlook
1.2. Demand-side Trends
1.3. Supply-side Trends
1.4. Technology Roadmap Analysis
1.5. Analysis and Recommendations
2. Market Overview
2.1. Market Coverage / Taxonomy
2.2. Market Definition / Scope / Limitations
3. Market Background
3.1. Market Dynamics
3.1.1. Drivers
3.1.2. Restraints
3.1.3. Opportunity
3.1.4. Trends
3.2. Scenario Forecast
3.2.1. Demand in Optimistic Scenario
3.2.2. Demand in Likely Scenario
3.2.3. Demand in Conservative Scenario
3.3. Opportunity Map Analysis
3.4. Product Life Cycle Analysis
3.5. Supply Chain Analysis
3.5.1. Supply Side Participants and their Roles
3.5.1.1. Producers
3.5.1.2. Mid-Level Participants (Traders/ Agents/ Brokers)
3.5.1.3. Wholesalers and Distributors
3.5.2. Value Added and Value Created at Node in the Supply Chain
3.5.3. List of Raw Material Suppliers
3.5.4. List of Existing and Potential Buyer’s
3.6. Investment Feasibility Matrix
3.7. Value Chain Analysis
3.7.1. Profit Margin Analysis
3.7.2. Wholesalers and Distributors
3.7.3. Retailers
3.8. PESTLE and Porter’s Analysis
3.9. Regulatory Landscape
3.9.1. By Key Regions
3.9.2. By Key Countries
3.10. Regional Parent Market Outlook
3.11. Production and Consumption Statistics
3.12. Import and Export Statistics
4. Global Mobile Tomography Market Analysis 2017-2021 and Forecast, 2022-2032
4.1. Historical Market Size Value (US$ Mn) & Volume (Units) Analysis, 2017-2021
4.2. Current and Future Market Size Value (US$ Mn) & Volume (Units) Projections, 2022-2032
4.2.1. Y-o-Y Growth Trend Analysis
4.2.2. Absolute $ Opportunity Analysis
5. Global Mobile Tomography Market Analysis 2017-2021 and Forecast 2022-2032, By Product Type
5.1. Introduction / Key Findings
5.2. Historical Market Size Value (US$ Mn) & Volume (Units) Analysis By Product Type, 2017-2021
5.3. Current and Future Market Size Value (US$ Mn) & Volume (Units) Analysis and Forecast By Product Type, 2022-2032
5.3.1. Low Slice CT Scanner (<32 slices)
5.3.2. Medium Slice CT Scanner (32 slices)
5.3.3. High Slice CT Scanner (>32 slices)
5.4. Y-o-Y Growth Trend Analysis By Product Type, 2017-2021
5.5. Absolute $ Opportunity Analysis By Product Type, 2022-2032
6. Global Mobile Tomography Market Analysis 2017-2021 and Forecast 2022-2032, By End User
6.1. Introduction / Key Findings
6.2. Historical Market Size Value (US$ Mn) & Volume (Units) Analysis By End User, 2017-2021
6.3. Current and Future Market Size Value (US$ Mn) & Volume (Units) Analysis and Forecast By End User, 2022-2032
6.3.1. Hospitals
6.3.2. Clinics
6.3.3. Diagnostic Centers
6.3.4. Ambulatory Surgical Centers
6.4. Y-o-Y Growth Trend Analysis By End User, 2017-2021
6.5. Absolute $ Opportunity Analysis By End User, 2022-2032
7. Global Mobile Tomography Market Analysis 2017-2021 and Forecast 2022-2032, By Region
7.1. Introduction
7.2. Historical Market Size Value (US$ Mn) & Volume (Units) Analysis By Region, 2017-2021
7.3. Current Market Size Value (US$ Mn) & Volume (Units) Analysis and Forecast By Region, 2022-2032
7.3.1. North America
7.3.2. Latin America
7.3.3. Europe
7.3.4. Asia Pacific
7.3.5. MEA
7.4. Market Attractiveness Analysis By Region
8. North America Mobile Tomography Market Analysis 2017-2021 and Forecast 2022-2032, By Country
8.1. Historical Market Size Value (US$ Mn) & Volume (Units) Trend Analysis By Market Taxonomy, 2017-2021
8.2. Market Size Value (US$ Mn) & Volume (Units) Forecast By Market Taxonomy, 2022-2032
8.2.1. By Country
8.2.1.1. U.S.
8.2.1.2. Canada
8.2.2. By Product Type
8.2.3. By End User
8.3. Market Attractiveness Analysis
8.3.1. By Country
8.3.2. By Product Type
8.3.3. By End User
8.4. Key Takeaways
9. Latin America Mobile Tomography Market Analysis 2017-2021 and Forecast 2022-2032, By Country
9.1. Historical Market Size Value (US$ Mn) & Volume (Units) Trend Analysis By Market Taxonomy, 2017-2021
9.2. Market Size Value (US$ Mn) & Volume (Units) Forecast By Market Taxonomy, 2022-2032
9.2.1. By Country
9.2.1.1. Brazil
9.2.1.2. Mexico
9.2.1.3. Rest of Latin America
9.2.2. By Product Type
9.2.3. By End User
9.3. Market Attractiveness Analysis
9.3.1. By Country
9.3.2. By Product Type
9.3.3. By End User
9.4. Key Takeaways
10. Europe Mobile Tomography Market Analysis 2017-2021 and Forecast 2022-2032, By Country
10.1. Historical Market Size Value (US$ Mn) & Volume (Units) Trend Analysis By Market Taxonomy, 2017-2021
10.2. Market Size Value (US$ Mn) & Volume (Units) Forecast By Market Taxonomy, 2022-2032
10.2.1. By Country
10.2.1.1. Germany
10.2.1.2. U.K.
10.2.1.3. France
10.2.1.4. Spain
10.2.1.5. Italy
10.2.1.6. Rest of Europe
10.2.2. By Product Type
10.2.3. By End User
10.3. Market Attractiveness Analysis
10.3.1. By Country
10.3.2. By Product Type
10.3.3. By End User
10.4. Key Takeaways
11. Asia Pacific Mobile Tomography Market Analysis 2017-2021 and Forecast 2022-2032, By Country
11.1. Historical Market Size Value (US$ Mn) & Volume (Units) Trend Analysis By Market Taxonomy, 2017-2021
11.2. Market Size Value (US$ Mn) & Volume (Units) Forecast By Market Taxonomy, 2022-2032
11.2.1. By Country
11.2.1.1. China
11.2.1.2. Japan
11.2.1.3. South Korea
11.2.1.4. Malaysia
11.2.1.5. Singapore
11.2.1.6. Australia
11.2.1.7. New Zealand
11.2.1.8. Rest of APAC
11.2.2. By Product Type
11.2.3. By End User
11.3. Market Attractiveness Analysis
11.3.1. By Country
11.3.2. By Product Type
11.3.3. By End User
11.4. Key Takeaways
12. MEA Mobile Tomography Market Analysis 2017-2021 and Forecast 2022-2032, By Country
12.1. Historical Market Size Value (US$ Mn) & Volume (Units) Trend Analysis By Market Taxonomy, 2017-2021
12.2. Market Size Value (US$ Mn) & Volume (Units) Forecast By Market Taxonomy, 2022-2032
12.2.1. By Country
12.2.1.1. GCC Countries
12.2.1.2. South Africa
12.2.1.3. Israel
12.2.1.4. Rest of MEA
12.2.2. By Product Type
12.2.3. By End User
12.3. Market Attractiveness Analysis
12.3.1. By Country
12.3.2. By Product Type
12.3.3. By End User
12.4. Key Takeaways
13. Key Countries Mobile Tomography Market Analysis
13.1. U.S.
13.1.1. Pricing Analysis
13.1.2. Market Share Analysis, 2021
13.1.2.1. By Product Type
13.1.2.2. By End User
13.2. Canada
13.2.1. Pricing Analysis
13.2.2. Market Share Analysis, 2021
13.2.2.1. By Product Type
13.2.2.2. By End User
13.3. Brazil
13.3.1. Pricing Analysis
13.3.2. Market Share Analysis, 2021
13.3.2.1. By Product Type
13.3.2.2. By End User
13.4. Mexico
13.4.1. Pricing Analysis
13.4.2. Market Share Analysis, 2021
13.4.2.1. By Product Type
13.4.2.2. By End User
13.5. Germany
13.5.1. Pricing Analysis
13.5.2. Market Share Analysis, 2021
13.5.2.1. By Product Type
13.5.2.2. By End User
13.6. U.K.
13.6.1. Pricing Analysis
13.6.2. Market Share Analysis, 2021
13.6.2.1. By Product Type
13.6.2.2. By End User
13.7. France
13.7.1. Pricing Analysis
13.7.2. Market Share Analysis, 2021
13.7.2.1. By Product Type
13.7.2.2. By End User
13.8. Spain
13.8.1. Pricing Analysis
13.8.2. Market Share Analysis, 2021
13.8.2.1. By Product Type
13.8.2.2. By End User
13.9. Italy
13.9.1. Pricing Analysis
13.9.2. Market Share Analysis, 2021
13.9.2.1. By Product Type
13.9.2.2. By End User
13.10. China
13.10.1. Pricing Analysis
13.10.2. Market Share Analysis, 2021
13.10.2.1. By Product Type
13.10.2.2. By End User
13.11. Japan
13.11.1. Pricing Analysis
13.11.2. Market Share Analysis, 2021
13.11.2.1. By Product Type
13.11.2.2. By End User
13.12. South Korea
13.12.1. Pricing Analysis
13.12.2. Market Share Analysis, 2021
13.12.2.1. By Product Type
13.12.2.2. By End User
13.13. Malaysia
13.13.1. Pricing Analysis
13.13.2. Market Share Analysis, 2021
13.13.2.1. By Product Type
13.13.2.2. By End User
13.14. Singapore
13.14.1. Pricing Analysis
13.14.2. Market Share Analysis, 2021
13.14.2.1. By Product Type
13.14.2.2. By End User
13.15. Australia
13.15.1. Pricing Analysis
13.15.2. Market Share Analysis, 2021
13.15.2.1. By Product Type
13.15.2.2. By End User
13.16. New Zealand
13.16.1. Pricing Analysis
13.16.2. Market Share Analysis, 2021
13.16.2.1. By Product Type
13.16.2.2. By End User
13.17. GCC Countries
13.17.1. Pricing Analysis
13.17.2. Market Share Analysis, 2021
13.17.2.1. By Product Type
13.17.2.2. By End User
13.18. South Africa
13.18.1. Pricing Analysis
13.18.2. Market Share Analysis, 2021
13.18.2.1. By Product Type
13.18.2.2. By End User
13.19. Israel
13.19.1. Pricing Analysis
13.19.2. Market Share Analysis, 2021
13.19.2.1. By Product Type
13.19.2.2. By End User
14. Market Structure Analysis
14.1. Competition Dashboard
14.2. Competition Benchmarking
14.3. Market Share Analysis of Top Players
14.3.1. By Regional
14.3.2. By Product Type
14.3.3. By End User
15. Competition Analysis
15.1. Competition Deep Dive
15.1.1. Xoran Technologies
15.1.1.1. Overview
15.1.1.2. Product Portfolio
15.1.1.3. Profitability by Market Segments
15.1.1.4. Sales Footprint
15.1.1.5. Strategy Overview
15.1.1.5.1. Marketing Strategy
15.1.1.5.2. Product Strategy
15.1.1.5.3. Channel Strategy
15.1.2. NeuroLogica Corp
15.1.2.1. Overview
15.1.2.2. Product Portfolio
15.1.2.3. Profitability by Market Segments
15.1.2.4. Sales Footprint
15.1.2.5. Strategy Overview
15.1.2.5.1. Marketing Strategy
15.1.2.5.2. Product Strategy
15.1.2.5.3. Channel Strategy
15.1.3. Planmed OY
15.1.3.1. Overview
15.1.3.2. Product Portfolio
15.1.3.3. Profitability by Market Segments
15.1.3.4. Sales Footprint
15.1.3.5. Strategy Overview
15.1.3.5.1. Marketing Strategy
15.1.3.5.2. Product Strategy
15.1.3.5.3. Channel Strategy
15.1.4. Brainlab AG
15.1.4.1. Overview
15.1.4.2. Product Portfolio
15.1.4.3. Profitability by Market Segments
15.1.4.4. Sales Footprint
15.1.4.5. Strategy Overview
15.1.4.5.1. Marketing Strategy
15.1.4.5.2. Product Strategy
15.1.4.5.3. Channel Strategy
15.1.5. Dixion
15.1.5.1. Overview
15.1.5.2. Product Portfolio
15.1.5.3. Profitability by Market Segments
15.1.5.4. Sales Footprint
15.1.5.5. Strategy Overview
15.1.5.5.1. Marketing Strategy
15.1.5.5.2. Product Strategy
15.1.5.5.3. Channel Strategy
15.1.6. Canon Medical Systems
15.1.6.1. Overview
15.1.6.2. Product Portfolio
15.1.6.3. Profitability by Market Segments
15.1.6.4. Sales Footprint
15.1.6.5. Strategy Overview
15.1.6.5.1. Marketing Strategy
15.1.6.5.2. Product Strategy
15.1.6.5.3. Channel Strategy
15.1.7. Siemens
15.1.7.1. Overview
15.1.7.2. Product Portfolio
15.1.7.3. Profitability by Market Segments
15.1.7.4. Sales Footprint
15.1.7.5. Strategy Overview
15.1.7.5.1. Marketing Strategy
15.1.7.5.2. Product Strategy
15.1.7.5.3. Channel Strategy
15.1.8. InHealth Group
15.1.8.1. Overview
15.1.8.2. Product Portfolio
15.1.8.3. Profitability by Market Segments
15.1.8.4. Sales Footprint
15.1.8.5. Strategy Overview
15.1.8.5.1. Marketing Strategy
15.1.8.5.2. Product Strategy
15.1.8.5.3. Channel Strategy
15.1.9. Bausch Health
15.1.9.1. Overview
15.1.9.2. Product Portfolio
15.1.9.3. Profitability by Market Segments
15.1.9.4. Sales Footprint
15.1.9.5. Strategy Overview
15.1.9.5.1. Marketing Strategy
15.1.9.5.2. Product Strategy
15.1.9.5.3. Channel Strategy
15.1.10. Samsung
15.1.10.1. Overview
15.1.10.2. Product Portfolio
15.1.10.3. Profitability by Market Segments
15.1.10.4. Sales Footprint
15.1.10.5. Strategy Overview
15.1.10.5.1. Marketing Strategy
15.1.10.5.2. Product Strategy
15.1.10.5.3. Channel Strategy
16. Assumptions & Acronyms Used
17. Research Methodology
Let us know your requirement to get
100% FREE customization
List of Tables
Table 01: Global Mobile Tomography Market Value (US$ Mn) Forecast by Region, 2017-2032
Table 02: Global Mobile Tomography Market Volume (Units) Forecast by Region, 2017-2032
Table 03: Global Mobile Tomography Market Value (US$ Mn) Forecast by Product Type, 2017-2032
Table 04: Global Mobile Tomography Market Volume (Units) Forecast by Product Type, 2017-2032
Table 05: Global Mobile Tomography Market Value (US$ Mn) Forecast by End User, 2017-2032
Table 06: Global Mobile Tomography Market Volume (Units) Forecast by End User, 2017-2032
Table 07: North America Mobile Tomography Market Value (US$ Mn) Forecast by Country, 2017-2032
Table 08: North America Mobile Tomography Market Volume (Units) Forecast by Country, 2017-2032
Table 09: North America Mobile Tomography Market Value (US$ Mn) Forecast by Product Type, 2017-2032
Table 10: North America Mobile Tomography Market Volume (Units) Forecast by Product Type, 2017-2032
Table 11: North America Mobile Tomography Market Value (US$ Mn) Forecast by End User, 2017-2032
Table 12: North America Mobile Tomography Market Volume (Units) Forecast by End User, 2017-2032
Table 13: Latin America Mobile Tomography Market Value (US$ Mn) Forecast by Country, 2017-2032
Table 14: Latin America Mobile Tomography Market Volume (Units) Forecast by Country, 2017-2032
Table 15: Latin America Mobile Tomography Market Value (US$ Mn) Forecast by Product Type, 2017-2032
Table 16: Latin America Mobile Tomography Market Volume (Units) Forecast by Product Type, 2017-2032
Table 17: Latin America Mobile Tomography Market Value (US$ Mn) Forecast by End User, 2017-2032
Table 18: Latin America Mobile Tomography Market Volume (Units) Forecast by End User, 2017-2032
Table 19: Europe Mobile Tomography Market Value (US$ Mn) Forecast by Country, 2017-2032
Table 20: Europe Mobile Tomography Market Volume (Units) Forecast by Country, 2017-2032
Table 21: Europe Mobile Tomography Market Value (US$ Mn) Forecast by Product Type, 2017-2032
Table 22: Europe Mobile Tomography Market Volume (Units) Forecast by Product Type, 2017-2032
Table 23: Europe Mobile Tomography Market Value (US$ Mn) Forecast by End User, 2017-2032
Table 24: Europe Mobile Tomography Market Volume (Units) Forecast by End User, 2017-2032
Table 25: Asia Pacific Mobile Tomography Market Value (US$ Mn) Forecast by Country, 2017-2032
Table 26: Asia Pacific Mobile Tomography Market Volume (Units) Forecast by Country, 2017-2032
Table 27: Asia Pacific Mobile Tomography Market Value (US$ Mn) Forecast by Product Type, 2017-2032
Table 28: Asia Pacific Mobile Tomography Market Volume (Units) Forecast by Product Type, 2017-2032
Table 29: Asia Pacific Mobile Tomography Market Value (US$ Mn) Forecast by End User, 2017-2032
Table 30: Asia Pacific Mobile Tomography Market Volume (Units) Forecast by End User, 2017-2032
Table 31: MEA Mobile Tomography Market Value (US$ Mn) Forecast by Country, 2017-2032
Table 32: MEA Mobile Tomography Market Volume (Units) Forecast by Country, 2017-2032
Table 33: MEA Mobile Tomography Market Value (US$ Mn) Forecast by Product Type, 2017-2032
Table 34: MEA Mobile Tomography Market Volume (Units) Forecast by Product Type, 2017-2032
Table 35: MEA Mobile Tomography Market Value (US$ Mn) Forecast by End User, 2017-2032
Table 36: MEA Mobile Tomography Market Volume (Units) Forecast by End User, 2017-2032
Find your sweet spots for generating winning opportunities in this market.
Talk to AnalystList of Charts
Figure 01: Global Mobile Tomography Market Value (US$ Mn) by Product Type, 2022-2032
Figure 02: Global Mobile Tomography Market Value (US$ Mn) by End User, 2022-2032
Figure 03: Global Mobile Tomography Market Value (US$ Mn) by Region, 2022-2032
Figure 04: Global Mobile Tomography Market Value (US$ Mn) Analysis by Region, 2017-2032
Figure 05: Global Mobile Tomography Market Volume (Units) Analysis by Region, 2017-2032
Figure 06: Global Mobile Tomography Market Value Share (%) and BPS Analysis by Region, 2022-2032
Figure 07: Global Mobile Tomography Market Y-o-Y Growth (%) Projections by Region, 2022-2032
Figure 08: Global Mobile Tomography Market Value (US$ Mn) Analysis by Product Type, 2017-2032
Figure 09: Global Mobile Tomography Market Volume (Units) Analysis by Product Type, 2017-2032
Figure 10: Global Mobile Tomography Market Value Share (%) and BPS Analysis by Product Type, 2022-2032
Figure 11: Global Mobile Tomography Market Y-o-Y Growth (%) Projections by Product Type, 2022-2032
Figure 12: Global Mobile Tomography Market Value (US$ Mn) Analysis by End User, 2017-2032
Figure 13: Global Mobile Tomography Market Volume (Units) Analysis by End User, 2017-2032
Figure 14: Global Mobile Tomography Market Value Share (%) and BPS Analysis by End User, 2022-2032
Figure 15: Global Mobile Tomography Market Y-o-Y Growth (%) Projections by End User, 2022-2032
Figure 16: Global Mobile Tomography Market Attractiveness by Product Type, 2022-2032
Figure 17: Global Mobile Tomography Market Attractiveness by End User, 2022-2032
Figure 18: Global Mobile Tomography Market Attractiveness by Region, 2022-2032
Figure 19: North America Mobile Tomography Market Value (US$ Mn) by Product Type, 2022-2032
Figure 20: North America Mobile Tomography Market Value (US$ Mn) by End User, 2022-2032
Figure 21: North America Mobile Tomography Market Value (US$ Mn) by Country, 2022-2032
Figure 22: North America Mobile Tomography Market Value (US$ Mn) Analysis by Country, 2017-2032
Figure 23: North America Mobile Tomography Market Volume (Units) Analysis by Country, 2017-2032
Figure 24: North America Mobile Tomography Market Value Share (%) and BPS Analysis by Country, 2022-2032
Figure 25: North America Mobile Tomography Market Y-o-Y Growth (%) Projections by Country, 2022-2032
Figure 26: North America Mobile Tomography Market Value (US$ Mn) Analysis by Product Type, 2017-2032
Figure 27: North America Mobile Tomography Market Volume (Units) Analysis by Product Type, 2017-2032
Figure 28: North America Mobile Tomography Market Value Share (%) and BPS Analysis by Product Type, 2022-2032
Figure 29: North America Mobile Tomography Market Y-o-Y Growth (%) Projections by Product Type, 2022-2032
Figure 30: North America Mobile Tomography Market Value (US$ Mn) Analysis by End User, 2017-2032
Figure 31: North America Mobile Tomography Market Volume (Units) Analysis by End User, 2017-2032
Figure 32: North America Mobile Tomography Market Value Share (%) and BPS Analysis by End User, 2022-2032
Figure 33: North America Mobile Tomography Market Y-o-Y Growth (%) Projections by End User, 2022-2032
Figure 34: North America Mobile Tomography Market Attractiveness by Product Type, 2022-2032
Figure 35: North America Mobile Tomography Market Attractiveness by End User, 2022-2032
Figure 36: North America Mobile Tomography Market Attractiveness by Country, 2022-2032
Figure 37: Latin America Mobile Tomography Market Value (US$ Mn) by Product Type, 2022-2032
Figure 38: Latin America Mobile Tomography Market Value (US$ Mn) by End User, 2022-2032
Figure 39: Latin America Mobile Tomography Market Value (US$ Mn) by Country, 2022-2032
Figure 40: Latin America Mobile Tomography Market Value (US$ Mn) Analysis by Country, 2017-2032
Figure 41: Latin America Mobile Tomography Market Volume (Units) Analysis by Country, 2017-2032
Figure 42: Latin America Mobile Tomography Market Value Share (%) and BPS Analysis by Country, 2022-2032
Figure 43: Latin America Mobile Tomography Market Y-o-Y Growth (%) Projections by Country, 2022-2032
Figure 44: Latin America Mobile Tomography Market Value (US$ Mn) Analysis by Product Type, 2017-2032
Figure 45: Latin America Mobile Tomography Market Volume (Units) Analysis by Product Type, 2017-2032
Figure 46: Latin America Mobile Tomography Market Value Share (%) and BPS Analysis by Product Type, 2022-2032
Figure 47: Latin America Mobile Tomography Market Y-o-Y Growth (%) Projections by Product Type, 2022-2032
Figure 48: Latin America Mobile Tomography Market Value (US$ Mn) Analysis by End User, 2017-2032
Figure 49: Latin America Mobile Tomography Market Volume (Units) Analysis by End User, 2017-2032
Figure 50: Latin America Mobile Tomography Market Value Share (%) and BPS Analysis by End User, 2022-2032
Figure 51: Latin America Mobile Tomography Market Y-o-Y Growth (%) Projections by End User, 2022-2032
Figure 52: Latin America Mobile Tomography Market Attractiveness by Product Type, 2022-2032
Figure 53: Latin America Mobile Tomography Market Attractiveness by End User, 2022-2032
Figure 54: Latin America Mobile Tomography Market Attractiveness by Country, 2022-2032
Figure 55: Europe Mobile Tomography Market Value (US$ Mn) by Product Type, 2022-2032
Figure 56: Europe Mobile Tomography Market Value (US$ Mn) by End User, 2022-2032
Figure 57: Europe Mobile Tomography Market Value (US$ Mn) by Country, 2022-2032
Figure 58: Europe Mobile Tomography Market Value (US$ Mn) Analysis by Country, 2017-2032
Figure 59: Europe Mobile Tomography Market Volume (Units) Analysis by Country, 2017-2032
Figure 60: Europe Mobile Tomography Market Value Share (%) and BPS Analysis by Country, 2022-2032
Figure 61: Europe Mobile Tomography Market Y-o-Y Growth (%) Projections by Country, 2022-2032
Figure 62: Europe Mobile Tomography Market Value (US$ Mn) Analysis by Product Type, 2017-2032
Figure 63: Europe Mobile Tomography Market Volume (Units) Analysis by Product Type, 2017-2032
Figure 64: Europe Mobile Tomography Market Value Share (%) and BPS Analysis by Product Type, 2022-2032
Figure 65: Europe Mobile Tomography Market Y-o-Y Growth (%) Projections by Product Type, 2022-2032
Figure 66: Europe Mobile Tomography Market Value (US$ Mn) Analysis by End User, 2017-2032
Figure 67: Europe Mobile Tomography Market Volume (Units) Analysis by End User, 2017-2032
Figure 68: Europe Mobile Tomography Market Value Share (%) and BPS Analysis by End User, 2022-2032
Figure 69: Europe Mobile Tomography Market Y-o-Y Growth (%) Projections by End User, 2022-2032
Figure 70: Europe Mobile Tomography Market Attractiveness by Product Type, 2022-2032
Figure 71: Europe Mobile Tomography Market Attractiveness by End User, 2022-2032
Figure 72: Europe Mobile Tomography Market Attractiveness by Country, 2022-2032
Figure 73: Asia Pacific Mobile Tomography Market Value (US$ Mn) by Product Type, 2022-2032
Figure 74: Asia Pacific Mobile Tomography Market Value (US$ Mn) by End User, 2022-2032
Figure 75: Asia Pacific Mobile Tomography Market Value (US$ Mn) by Country, 2022-2032
Figure 76: Asia Pacific Mobile Tomography Market Value (US$ Mn) Analysis by Country, 2017-2032
Figure 77: Asia Pacific Mobile Tomography Market Volume (Units) Analysis by Country, 2017-2032
Figure 78: Asia Pacific Mobile Tomography Market Value Share (%) and BPS Analysis by Country, 2022-2032
Figure 79: Asia Pacific Mobile Tomography Market Y-o-Y Growth (%) Projections by Country, 2022-2032
Figure 80: Asia Pacific Mobile Tomography Market Value (US$ Mn) Analysis by Product Type, 2017-2032
Figure 81: Asia Pacific Mobile Tomography Market Volume (Units) Analysis by Product Type, 2017-2032
Figure 82: Asia Pacific Mobile Tomography Market Value Share (%) and BPS Analysis by Product Type, 2022-2032
Figure 83: Asia Pacific Mobile Tomography Market Y-o-Y Growth (%) Projections by Product Type, 2022-2032
Figure 84: Asia Pacific Mobile Tomography Market Value (US$ Mn) Analysis by End User, 2017-2032
Figure 85: Asia Pacific Mobile Tomography Market Volume (Units) Analysis by End User, 2017-2032
Figure 86: Asia Pacific Mobile Tomography Market Value Share (%) and BPS Analysis by End User, 2022-2032
Figure 87: Asia Pacific Mobile Tomography Market Y-o-Y Growth (%) Projections by End User, 2022-2032
Figure 88: Asia Pacific Mobile Tomography Market Attractiveness by Product Type, 2022-2032
Figure 89: Asia Pacific Mobile Tomography Market Attractiveness by End User, 2022-2032
Figure 90: Asia Pacific Mobile Tomography Market Attractiveness by Country, 2022-2032
Figure 91: MEA Mobile Tomography Market Value (US$ Mn) by Product Type, 2022-2032
Figure 92: MEA Mobile Tomography Market Value (US$ Mn) by End User, 2022-2032
Figure 93: MEA Mobile Tomography Market Value (US$ Mn) by Country, 2022-2032
Figure 94: MEA Mobile Tomography Market Value (US$ Mn) Analysis by Country, 2017-2032
Figure 95: MEA Mobile Tomography Market Volume (Units) Analysis by Country, 2017-2032
Figure 96: MEA Mobile Tomography Market Value Share (%) and BPS Analysis by Country, 2022-2032
Figure 97: MEA Mobile Tomography Market Y-o-Y Growth (%) Projections by Country, 2022-2032
Figure 98: MEA Mobile Tomography Market Value (US$ Mn) Analysis by Product Type, 2017-2032
Figure 99: MEA Mobile Tomography Market Volume (Units) Analysis by Product Type, 2017-2032
Figure 100: MEA Mobile Tomography Market Value Share (%) and BPS Analysis by Product Type, 2022-2032
Figure 101: MEA Mobile Tomography Market Y-o-Y Growth (%) Projections by Product Type, 2022-2032
Figure 102: MEA Mobile Tomography Market Value (US$ Mn) Analysis by End User, 2017-2032
Figure 103: MEA Mobile Tomography Market Volume (Units) Analysis by End User, 2017-2032
Figure 104: MEA Mobile Tomography Market Value Share (%) and BPS Analysis by End User, 2022-2032
Figure 105: MEA Mobile Tomography Market Y-o-Y Growth (%) Projections by End User, 2022-2032
Figure 106: MEA Mobile Tomography Market Attractiveness by Product Type, 2022-2032
Figure 107: MEA Mobile Tomography Market Attractiveness by End User, 2022-2032
Figure 108: MEA Mobile Tomography Market Attractiveness by Country, 2022-2032
Need specific information?
Request CustomizationExplore Healthcare Insights
View Reports