The Mobile Computed Tomography Scanners Market is estimated to be valued at USD 7.9 billion in 2025 and is projected to reach USD 13.4 billion by 2035, registering a compound annual growth rate (CAGR) of 5.5% over the forecast period.
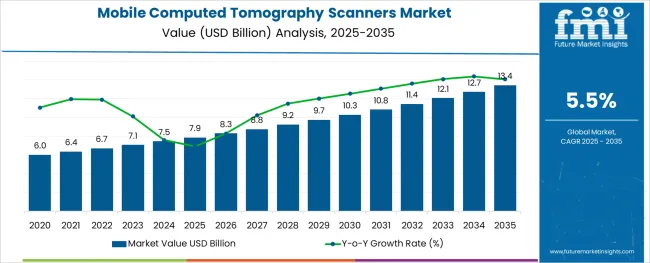
The mobile computed tomography scanners market is advancing steadily, driven by increasing demand for flexible and on-site diagnostic solutions in healthcare facilities. The ability to bring imaging services directly to patients has become critical in emergency care, neurology, and intensive care units. The growing prevalence of neurological disorders has pushed healthcare providers to adopt mobile CT scanners to enable rapid diagnosis and treatment planning.
Advancements in imaging technology have improved the accuracy and resolution of mobile scanners, making them more attractive for a range of clinical applications. Additionally, hospitals are investing in mobile CT units to improve patient flow and reduce the need for transporting critically ill patients.
The market outlook is positive as healthcare systems seek to enhance diagnostic capabilities while optimizing resource use. Segment growth is anticipated to be led by medium-slice scanners, particularly the 64-slice category, neurology as a key application area, and hospitals as the primary end user.
The market is segmented by Product Type, Application, and End User and region. By Product Type, the market is divided into Medium-Slice Scanners (64 Slice), Low-Slice Scanners (<64 Slice), and High-Slice Scanners (>64 Slice). In terms of Application, the market is classified into Neurology, Oncology, Cardiology, and Others (Abdominal, Spine, Thorax). Based on End User, the market is segmented into Hospitals, Diagnostic Centers, Clinics, and Research Academics. Regionally, the market is classified into North America, Latin America, Western Europe, Eastern Europe, Balkan & Baltic Countries, Russia & Belarus, Central Asia, East Asia, South Asia & Pacific, and the Middle East & Africa.
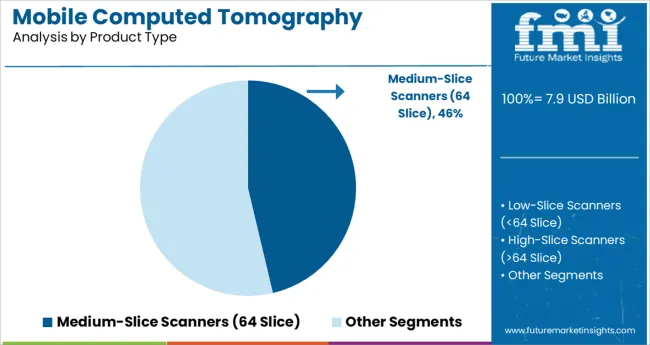
The medium-slice scanners segment, specifically 64-slice scanners, is expected to account for 46.3% of the market revenue in 2025, establishing its leadership in product types. These scanners offer a balance of imaging speed and resolution suitable for a broad range of diagnostic procedures. The 64-slice technology is valued for providing detailed images with relatively low radiation doses.
It allows clinicians to perform complex neurological scans and whole-body imaging efficiently. The mobility factor combined with high-performance scanning capabilities has increased its adoption in healthcare settings where versatility and accuracy are crucial.
As hospitals aim to improve diagnostic throughput and patient outcomes, medium-slice mobile CT scanners will continue to be a preferred choice.
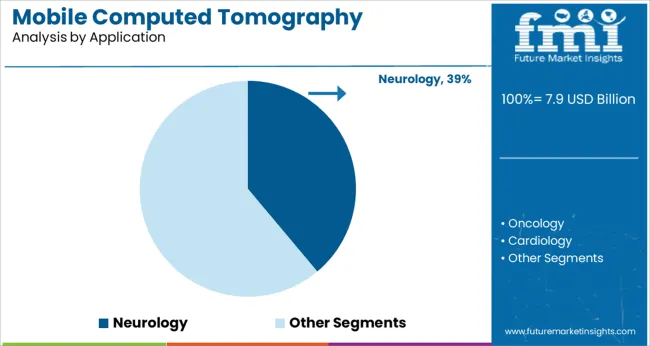
Neurology is projected to contribute 38.9% of the mobile computed tomography scanners market revenue in 2025, positioning it as the leading application segment. The growth in this segment is driven by the rising incidence of neurological disorders, including stroke, traumatic brain injuries, and neurodegenerative diseases. Rapid and accurate imaging is essential for effective diagnosis and timely intervention in these conditions.
Mobile CT scanners provide neurologists with the ability to conduct immediate bedside imaging, reducing critical delays. Furthermore, advancements in imaging software have enhanced the visualization of neurological structures, supporting better clinical decision-making.
The increasing demand for point-of-care diagnostics in neurology is expected to sustain the segment’s growth.
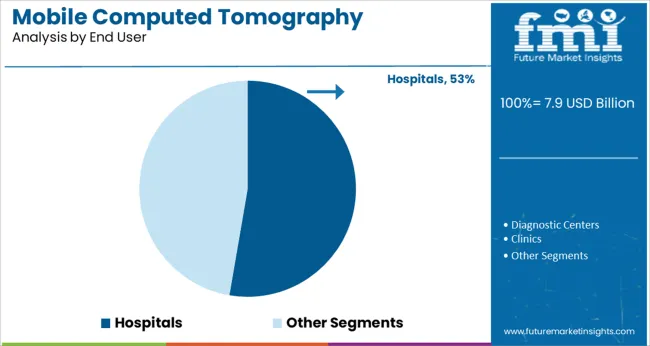
Hospitals are expected to represent 52.7% of the mobile computed tomography scanners market revenue in 2025, maintaining their status as the dominant end user segment. This growth is fueled by hospitals’ need to enhance diagnostic capabilities within emergency rooms, intensive care units, and specialized departments such as neurology and trauma.
Mobile CT scanners help hospitals reduce patient transport risks and improve workflow efficiency by delivering imaging services directly to the bedside. The ability to perform rapid imaging in critical care settings has made these scanners indispensable.
Investment in portable diagnostic equipment by hospitals seeking to improve patient outcomes and operational flexibility is driving this segment. Hospitals are likely to remain the primary users as healthcare infrastructure continues to evolve toward more patient-centric care models.
Increasing adoption of minimally invasive diagnostic procedures is expected to boost the sales of mobile computed tomography scanner globally. Also, mobile computed tomography is portable thus making it more convenient for patients and professionals, which is contributing to the higher demand for mobile computed tomography scanners in these days.
Increasing awareness for the early detection of disorders such as cancer and neurological disorders are expected to boost the sales of mobile computed tomography scanners. Rising prevalence of cardiovascular diseases is further expected to aid in the growth of the demand for mobile computed tomography scanners by various end use segments.
Also, portable scanners require less space on the floor and less weight thus increasing the demand for mobile computer tomography scanners.
However, there are certain side effects associated with mobile computed tomography scanners market such as headache, nausea, etc., thus hampering the demand for mobile computed tomography scanners in some regions.
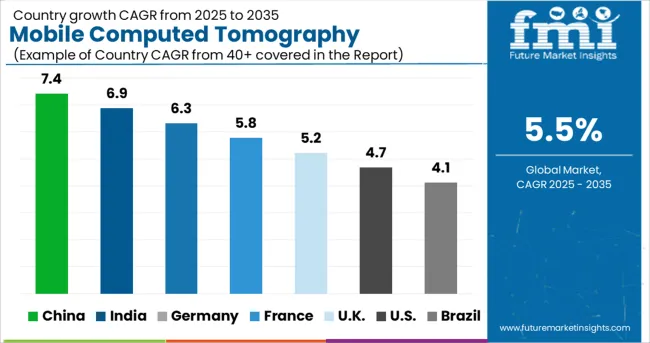
North America is expected to dominate the global mobile computed tomography scanners market as a growing number of FDA approved mobile computed tomography devices and increasing prevalence of cancers in the region.
Europe is expected to contribute the second-highest revenue share in the global mobile computed tomography scanners market due to the higher sales of mobile computed tomography devices in the region to medical professionals.
The Asia Pacific expected to grow with the highest growth rate in the mobile computed tomography scanners market due to the increasing awareness of people towards early detection of chronic neurological disorders.
Middle East & Africa mobile computed tomography scanners market share is expected to grow with the lowest growth rate due to lack of awareness, and poor medical facilities.
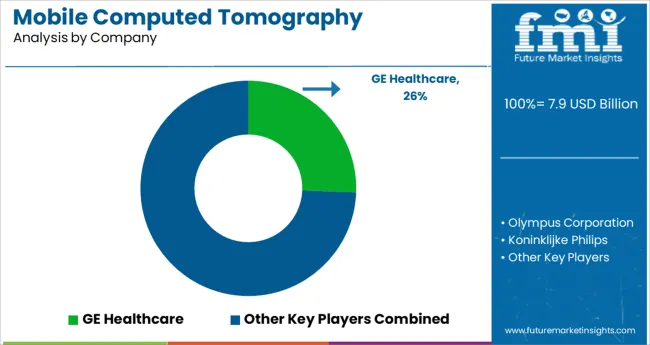
The key players of the mobile computed tomography scanners market are focusing on enhancing and adopting strategies like enhancing the durability, sizes and its use to thrive their business. This major factor is driving the demand for mobile computed tomography scanners.
Some of the key participating players operating in the global mobile computed tomography scanners are:
Manufacturers are focusing on marketing and promotional activities as well as partnerships with the mobile computed tomography service providers to accelerate their sales of mobile computed tomography scanners. These market players are also anticipated to drive the mobile computed tomography scanners market by introducing new products and expanding market penetration.
| Report Attribute | Details |
|---|---|
| Growth Rate | CAGR of 5.5% from 2025 to 2035 |
| Base year for estimation | 2025 |
| Historical data | 2020 to 2024 |
| Forecast period | 2025 to 2035 |
| Quantitative units | Revenue in million and CAGR from 2025 to 2035 |
| Report coverage | Revenue forecast, volume forecast, company ranking, competitive landscape, growth factors, and trends, Pricing Analysis |
| Segments covered | By Number of Slices, by Application, by End Users, and by Region |
| Regional scope | North America; Latin America; Western Europe; Eastern Europe; Asia Pacific; Japan; Middle East & Africa (MEA) |
| Country scope | USA, Canada, Mexico, Brazil, Germany, Italy, France, UK, Spain, Poland, Russia, India, ASEAN, Australia & New Zealand, China, Japan, GCC Countries, S. Africa, Northern Africa |
| Key companies profiled | Olympus Corporation; Karl Storz GmbH & co KG; Koninklijke Philips; Hitachi Medical Corporation; GE Healthcare; Medtronics; and Shenzhen Anke High-Tech |
| Customization scope | Free report customization (equivalent to up to 8 analyst working days) with purchase. Addition or alteration to country, regional & segment scope. |
| Pricing and purchase options | Avail customized purchase options to meet your exact research needs. |
The global mobile computed tomography scanners market is estimated to be valued at USD 7.9 billion in 2025.
It is projected to reach USD 13.4 billion by 2035.
The market is expected to grow at a 5.5% CAGR between 2025 and 2035.
The key product types are medium-slice scanners (64 slice), low-slice scanners (<64 slice) and high-slice scanners (>64 slice).
neurology segment is expected to dominate with a 38.9% industry share in 2025.


Our Research Products

The "Full Research Suite" delivers actionable market intel, deep dives on markets or technologies, so clients act faster, cut risk, and unlock growth.

The Leaderboard benchmarks and ranks top vendors, classifying them as Established Leaders, Leading Challengers, or Disruptors & Challengers.

Locates where complements amplify value and substitutes erode it, forecasting net impact by horizon

We deliver granular, decision-grade intel: market sizing, 5-year forecasts, pricing, adoption, usage, revenue, and operational KPIs—plus competitor tracking, regulation, and value chains—across 60 countries broadly.

Spot the shifts before they hit your P&L. We track inflection points, adoption curves, pricing moves, and ecosystem plays to show where demand is heading, why it is changing, and what to do next across high-growth markets and disruptive tech

Real-time reads of user behavior. We track shifting priorities, perceptions of today’s and next-gen services, and provider experience, then pace how fast tech moves from trial to adoption, blending buyer, consumer, and channel inputs with social signals (#WhySwitch, #UX).

Partner with our analyst team to build a custom report designed around your business priorities. From analysing market trends to assessing competitors or crafting bespoke datasets, we tailor insights to your needs.
Supplier Intelligence
Discovery & Profiling
Capacity & Footprint
Performance & Risk
Compliance & Governance
Commercial Readiness
Who Supplies Whom
Scorecards & Shortlists
Playbooks & Docs
Category Intelligence
Definition & Scope
Demand & Use Cases
Cost Drivers
Market Structure
Supply Chain Map
Trade & Policy
Operating Norms
Deliverables
Buyer Intelligence
Account Basics
Spend & Scope
Procurement Model
Vendor Requirements
Terms & Policies
Entry Strategy
Pain Points & Triggers
Outputs
Pricing Analysis
Benchmarks
Trends
Should-Cost
Indexation
Landed Cost
Commercial Terms
Deliverables
Brand Analysis
Positioning & Value Prop
Share & Presence
Customer Evidence
Go-to-Market
Digital & Reputation
Compliance & Trust
KPIs & Gaps
Outputs
Full Research Suite comprises of:
Market outlook & trends analysis
Interviews & case studies
Strategic recommendations
Vendor profiles & capabilities analysis
5-year forecasts
8 regions and 60+ country-level data splits
Market segment data splits
12 months of continuous data updates
DELIVERED AS:
PDF EXCEL ONLINE
Mobile Camping Toilet Market Size and Share Forecast Outlook 2025 to 2035
Mobile Phone Screen Underlayer Cushioning Material Market Size and Share Forecast Outlook 2025 to 2035
Mobile Application Store Market Size and Share Forecast Outlook 2025 to 2035
Mobile Money Market Forecast and Outlook 2025 to 2035
Mobile Application Testing Solution Market Size and Share Forecast Outlook 2025 to 2035
Mobile Cardiac Telemetry System Market Size and Share Forecast Outlook 2025 to 2035
Mobile Robots Market Size and Share Forecast Outlook 2025 to 2035
Mobile Crane Market Size and Share Forecast Outlook 2025 to 2035
Mobile Vascular Imaging Market Size and Share Forecast Outlook 2025 to 2035
Mobile Animal Inhalation Anesthesia Machine Market Size and Share Forecast Outlook 2025 to 2035
Mobile Unified Communications and Collaboration (UC&C) Solution Market Size and Share Forecast Outlook 2025 to 2035
Mobile Data Protection Market Size and Share Forecast Outlook 2025 to 2035
Mobile Medical Tablets Market Size and Share Forecast Outlook 2025 to 2035
Mobile WLAN Access Points Market Size and Share Forecast Outlook 2025 to 2035
Mobile Social Networks Market Size and Share Forecast Outlook 2025 to 2035
Mobile Printer Market Size and Share Forecast Outlook 2025 to 2035
Mobile Application Development Platform Market Size and Share Forecast Outlook 2025 to 2035
Mobile Threat Management Security Software Market Size and Share Forecast Outlook 2025 to 2035
Mobile Broadband Infrastructure Market Size and Share Forecast Outlook 2025 to 2035
Mobile Enterprise Application Development Platform Market Size and Share Forecast Outlook 2025 to 2035

Thank you!
You will receive an email from our Business Development Manager. Please be sure to check your SPAM/JUNK folder too.
Chat With
MaRIA