Computed Tomography Market Outlook from 2025 to 2035

The computed tomography (CT) market is advancing steadily, propelled by the increasing global burden of chronic diseases, the rise in emergency care admissions, and technological advancements in imaging resolution and scan speed. Healthcare publications and medical technology press releases have emphasized a shift toward faster and more accurate diagnostic modalities, leading to widespread CT system upgrades in hospitals and diagnostic centers.

The demand for high-performance CT systems has surged, particularly in oncology, cardiology, and neurological diagnostics, where precise imaging is essential for treatment planning. Medical device companies have accelerated innovation in dose-reduction technologies, AI-assisted reconstruction algorithms, and multimodal imaging integration, improving both patient safety and diagnostic confidence.

In addition, expanding access to healthcare infrastructure in emerging economies, along with favorable reimbursement policies in developed regions, has contributed to market expansion. Looking ahead, adoption of high-slice CT systems, increased neurological imaging volumes, and hospital-centric installations are expected to shape the market’s trajectory, supported by capital investment in advanced diagnostic infrastructure and the global push for early and accurate disease detection.
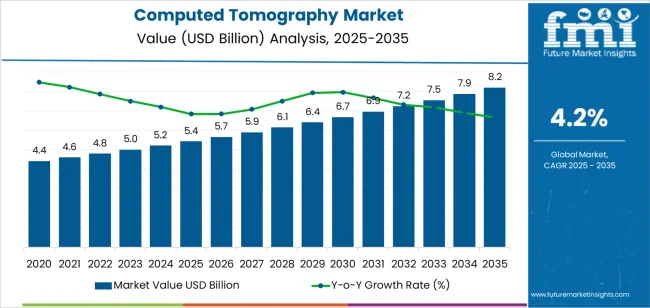
Quick Stats for Computed Tomography Market

  • Computed Tomography Market Industry Value (2025): USD 5.4 billion
  • Computed Tomography Market Forecast Value (2035): USD 8.2 billion
  • Computed Tomography Market Forecast CAGR: 4.2%
  • Leading Segment in Computed Tomography Market in 2025: High-Slice CT (46.2%)
  • Key Growth Region in Computed Tomography Market: North America, Asia-Pacific, Europe
  • Top Key Players in Computed Tomography Market: Siemens Healthineers, Fujifilm Corporation, Carestream Health, Canon Medical Systems Corporation, Neusoft Medical Systems, Koninklijke Philips, Hitachi, Ltd, GE Healthcare, NeuroLogica Corp, Shenzhen Anke High-Tech Co

Computed Tomography Market Market Value Analysis

Metric Value
Computed Tomography Market Estimated Value in (2025 E) USD 5.4 billion
Computed Tomography Market Forecast Value in (2035 F) USD 8.2 billion
Forecast CAGR (2025 to 2035) 4.2%

Segmental Analysis

The market is segmented by Technology, Application, and End-User and region. By Technology, the market is divided into High-Slice CT, Mid-Slice CT, Low-Slice CT, and Cone Beam CT. In terms of Application, the market is classified into Neurology, Orthopedics, Oncology, Cardiovascular, Respiratory, Gastrointestinal, and Others. Based on End-User, the market is segmented into Hospitals, Ambulatory Surgery Centers, Diagnostics Imaging Centers, and Others. Regionally, the market is classified into North America, Latin America, Western Europe, Eastern Europe, Balkan & Baltic Countries, Russia & Belarus, Central Asia, East Asia, South Asia & Pacific, and the Middle East & Africa.
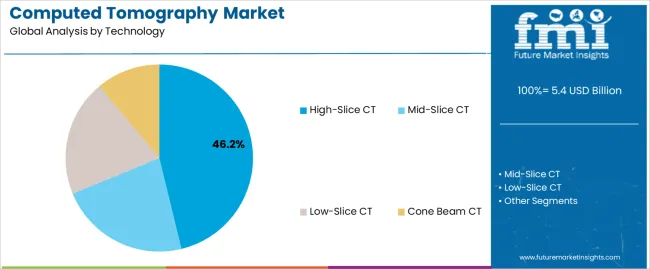
Insights into the Technology Segment: High-Slice CT

Computed Tomography Market Analysis By Technology

The High-Slice CT segment is projected to capture 46.2% of the computed tomography market revenue in 2025, establishing itself as the dominant technology type. This leadership has been supported by clinical preferences for systems that enable rapid image acquisition, especially in time-sensitive applications like trauma and cardiac imaging.

High-slice CT scanners, often equipped with 64 slices or more, have allowed radiologists to obtain high-resolution volumetric images within seconds, significantly reducing motion artifacts and enhancing diagnostic precision. Hospital procurement decisions have favored high-slice CT due to their ability to manage large patient throughput and support a broader range of complex imaging procedures.

Additionally, manufacturers have introduced radiation dose-reduction technologies in high-slice CT systems, addressing safety concerns without compromising image quality. These features have made high-slice CT indispensable for tertiary care centers and academic hospitals, where comprehensive diagnostic capabilities are essential. As imaging demand rises across multiple specialties, this segment is expected to maintain strong market momentum.
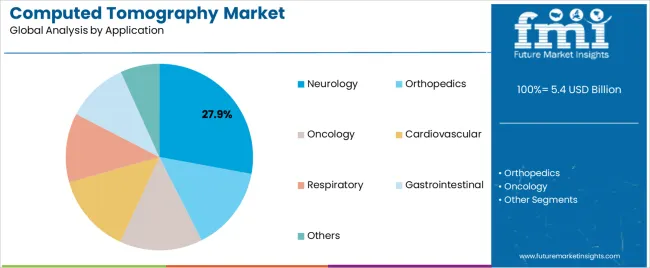
Insights into the Application Segment: Neurology

Computed Tomography Market Analysis By Application

The Neurology segment is projected to contribute 27.9% of the computed tomography market revenue in 2025, positioning it as the leading application area. Growth of this segment has been driven by the critical role of CT in diagnosing acute neurological conditions, including stroke, traumatic brain injuries, and intracranial hemorrhage.

Emergency care protocols have increasingly relied on non-contrast CT scans as the first-line diagnostic modality for suspected neurological events due to their speed, availability, and accuracy. Clinical guidelines and stroke management pathways have reinforced the use of CT for rapid triage and treatment planning, especially in time-critical interventions.

Additionally, the aging global population has led to a higher prevalence of neurodegenerative conditions, contributing to increased imaging volumes. Medical journals have highlighted ongoing advancements in perfusion CT and CT angiography techniques, which have further extended the modality’s value in neurological care. These developments, along with expanding access to stroke-ready centers, are expected to sustain the Neurology segment’s leading role in application-based adoption.
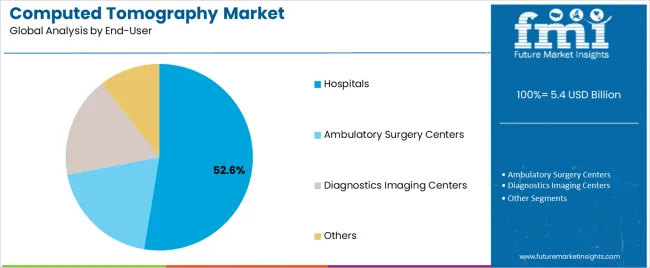
Insights into the End-User Segment: Hospitals

Computed Tomography Market Analysis By End User

The Hospitals segment is projected to account for 52.6% of the computed tomography market revenue in 2025, continuing its dominance as the primary end-user category. This segment’s growth has been underpinned by the high capital investment hospitals make in advanced diagnostic equipment to meet diverse clinical demands across departments.

Hospitals have consistently led CT adoption due to their ability to integrate imaging services with surgical, emergency, and intensive care workflows, ensuring timely and comprehensive patient assessment. Clinical infrastructure in hospitals has supported the installation of high-slice and specialty CT systems, particularly for oncology, cardiovascular, and neurological diagnostics.

Furthermore, hospitals benefit from institutional reimbursement models and access to skilled radiologists, enabling them to deliver high-volume imaging services efficiently. Health system modernization efforts in both developed and developing countries have prioritized imaging capacity expansion within hospitals, contributing to sustained equipment upgrades. As CT becomes a cornerstone of routine and advanced diagnostics, the Hospitals segment is expected to maintain its leadership in end-user demand.

Growth Factors Influencing the Computed Tomography Market

Increasing prevalence of chronic diseases such as cancer and cardiovascular disorders. These conditions require accurate and early diagnosis, for which CT scans are highly effective. The rising geriatric population, which is more susceptible to chronic illnesses, also contributes to the demand for CT imaging.

Technological advancements in CT imaging systems play a significant role in market growth. Innovations such as high-resolution imaging, faster scan times, and the development of portable and low-dose CT scanners enhance diagnostic accuracy and patient safety. These improvements make CT imaging more accessible and attractive to healthcare providers.

Government initiatives and funding for improved healthcare infrastructure further boost the CT market. Many countries are investing in advanced diagnostic equipment to enhance their healthcare services, driving the adoption of CT scanners. Additionally, the increasing number of healthcare facilities, especially in emerging economies, expands the market for CT imaging systems.

Rising awareness about the benefits of early diagnosis and preventive healthcare also fuels market growth. As patients and healthcare providers prioritize early detection and treatment of diseases, the demand for CT scans increases.

Moreover, the growing use of CT imaging in various medical fields, including oncology, neurology, and orthopedics, broadens the market scope, ensuring continued expansion and innovation in CT equipment.

Country-wise Insights

Healthcare Infrastructure is Surging the Demand For Computed Tomography in the United States

A combination of advanced healthcare infrastructure, a high prevalence of chronic diseases, and significant technological advancements drives the computed tomography (CT) market in the United States.

The United States has a well-established healthcare system with a strong emphasis on early diagnosis and preventive care. This environment fosters the widespread adoption of advanced diagnostic tools, including CT scanners.

Chronic diseases such as cancer, cardiovascular disorders, and respiratory conditions are highly prevalent in the United States, necessitating the use of CT imaging for accurate diagnosis and treatment planning. The aging population further exacerbates this demand, as older individuals are more susceptible to these conditions. This demographic trend ensures a steady increase in the need for CT scans.

Healthcare Spending and Governmental Support to Spike the Computed Tomography Demand in China

Healthcare expenditure in China has been steadily increasing, driven by economic growth and government initiatives to improve healthcare services. This increase in spending allows for the procurement of advanced medical equipment, including high-resolution and low-dose CT scanners, which are essential for accurate diagnosis and treatment.

The government's focus on modernizing healthcare facilities and incorporating advanced technologies plays a significant role in driving the CT market.

Technological advancements and local production capabilities also boost the CT market in China. Chinese manufacturers are increasingly developing and producing advanced CT scanners, making the technology more affordable and accessible.

This domestic production capability, combined with technological innovations, ensures a robust supply of CT scanners to meet the growing demand in the country.

Rise in AI Technology in the United Kingdom is Advancing Computed Tomography

The computed tomography (CT) market in the United Kingdom is driven by various factors, including an increasing emphasis on personalized medicine, the integration of artificial intelligence (AI) in diagnostic imaging, and government initiatives to reduce diagnostic waiting times.

The shift towards personalized medicine requires precise and accurate diagnostic tools, and CT imaging plays a crucial role in tailoring treatments to individual patient needs. This demand for personalized care drives the adoption of advanced CT technology in healthcare settings.

The integration of AI in diagnostic imaging significantly enhances the capabilities of CT scanners. AI algorithms can rapidly analyze CT images, improving diagnostic accuracy and enabling earlier detection of diseases.

This technological advancement is highly valued in the UK, where there is a strong focus on leveraging AI to improve healthcare outcomes. The incorporation of AI in CT imaging systems not only boosts efficiency but also aids in addressing the shortage of radiologists by assisting in image interpretation.

Category-wise Insights

Fast Processing of High Slice CT is Helping to Increase The Usage Of Computed Tomography Market

High-slice CT technology is significantly contributing to the growth of the computed tomography (CT) market. These advanced systems, offering up to 320 slices per rotation, provide remarkably detailed images, enhancing diagnostic accuracy.

This level of detail is particularly beneficial in diagnosing complex conditions such as cardiovascular diseases, where precise imaging is critical. The ability of high-slice CT scanners to capture images quickly reduces the need for repeat scans, which improves patient throughput and operational efficiency in healthcare facilities.

The speed of high-slice CT scanners is another growth driver. Faster imaging times not only improve patient comfort but also allow for better imaging of moving organs, such as the heart and lungs, without compromising image quality. This capability is essential for accurate diagnostics in dynamic studies, contributing to the broader adoption of high-slice CT technology in clinical practice.

the versatility of high-slice CT scanners supports various applications, from routine diagnostic procedures to complex interventional radiology. This versatility enhances their appeal to healthcare providers looking to invest in multipurpose imaging equipment, further driving market growth.

The continuous advancements in high-slice CT technology, such as integration with artificial intelligence for automated image analysis, further boost their adoption, ensuring sustained growth in the computed tomography market.

AI Enablement in Oncology Scan is Boosting Computed Tomography Market

The integration of artificial intelligence (AI) in CT imaging further boosts its application in oncology. AI algorithms can analyze CT images quickly and accurately, aiding in the early detection of subtle changes in tumor size or density that might be missed by the human eye.

This technological enhancement not only improves diagnostic accuracy but also streamlines workflows in busy oncology departments, thereby supporting the growth of the computed tomography market.

CT imaging is also integral in guiding minimally invasive procedures and radiation therapy planning. It helps in accurately targeting tumors while sparing surrounding healthy tissues, which is vital for effective treatment and reducing side effects.

The role of CT in post-treatment monitoring and recurrence detection is equally important, as it allows for timely interventions and adjustments in therapy, ensuring ongoing patient care and management.

The rising prevalence of cancer globally intensifies the demand for advanced diagnostic tools like CT scanners. As cancer incidence increases, the need for effective diagnostic imaging grows, driving the market for CT technology.

Furthermore, advancements in CT technology, such as multi-slice and high-resolution scanners, enhance the ability to detect and monitor tumors more effectively, contributing to their widespread adoption in oncology departments.
Competitive Landscape

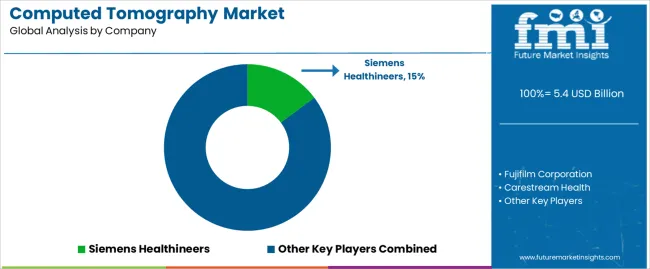
Computed Tomography Market Analysis By Company

Leading companies in CT market are expanding their geographical presence to tap into emerging markets with growing healthcare infrastructure and demand for advanced medical imaging technologies. This expansion may involve establishing partnerships, distribution agreements, or setting up subsidiaries in key regions.

Collaboration with healthcare providers, research institutions, and technology companies is becoming increasingly common. These partnerships facilitate the development of innovative solutions, clinical validation studies, and access to complementary technologies that enhance the overall value proposition of CT systems.

  • In January 2025, Siemens Healthineers received FDA approval for Syngo Virtual Cockpit. This secure, private communication platform allows healthcare professionals to visualize, capture, and collaborate in real-time across multiple locations using real-time imaging. Regardless of location, Siemens Healthineers provides software for connecting to CT scanners, magnetic resonance scanners, PET scanners, positron emission tomography scanners, single-photon emission CT scanners, PET/CT scanners, SPECT scanners, and PET/MR scanners.
  • In March 2025, Fujifilm India unveiled its latest MRI machine, the Echelon Synergy MRI Machine, at its CT & MRI User Group event. Computed tomography (CT) and magnetic resonance imaging (MRI) are part of the platform, a technology meeting that explores their futures.

Computed Tomography Market by Category

By Technology:

In terms of technology, the market includes high-slice CT, mid-slice CT, low-slice CT, and cone beam CT.

By Application:

In terms of application, the market is segmented into neurology, orthopedics, oncology, cardiovascular, respiratory, gastrointestinal, and others.

By End User:

The end user industries include hospitals, ambulatory surgery centers, diagnostics imaging centers, and others.

By Region:

In terms of region, the industry is divided into North America, Latin America, Western Europe, South Asia, East Asia, Eastern Europe, and the Middle East and Africa.

Frequently Asked Questions

How big is the computed tomography market in 2025?

The global computed tomography market is estimated to be valued at USD 5.4 billion in 2025.

What will be the size of computed tomography market in 2035?

The market size for the computed tomography market is projected to reach USD 8.2 billion by 2035.

How much will be the computed tomography market growth between 2025 and 2035?

The computed tomography market is expected to grow at a 4.2% CAGR between 2025 and 2035.

What are the key product types in the computed tomography market?

The key product types in computed tomography market are high-slice ct, mid-slice ct, low-slice ct and cone beam ct.

Which application segment to contribute significant share in the computed tomography market in 2025?

In terms of application, neurology segment to command 27.9% share in the computed tomography market in 2025.

Table of Content

  1. Executive Summary
    • Global Market Outlook
    • Demand to side Trends
    • Supply to side Trends
    • Technology Roadmap Analysis
    • Analysis and Recommendations
  2. Market Overview
    • Market Coverage / Taxonomy
    • Market Definition / Scope / Limitations
  3. Market Background
    • Market Dynamics
      • Drivers
      • Restraints
      • Opportunity
      • Trends
    • Scenario Forecast
      • Demand in Optimistic Scenario
      • Demand in Likely Scenario
      • Demand in Conservative Scenario
    • Opportunity Map Analysis
    • Product Life Cycle Analysis
    • Supply Chain Analysis
    • Investment Feasibility Matrix
    • Value Chain Analysis
    • PESTLE and Porter’s Analysis
    • Regulatory Landscape
    • Regional Parent Market Outlook
    • Production and Consumption Statistics
    • Import and Export Statistics
  4. Global Market Analysis 2020 to 2024 and Forecast, 2025 to 2035
    • Historical Market Size Value (USD Million) Analysis, 2020 to 2024
    • Current and Future Market Size Value (USD Million) Projections, 2025 to 2035
      • Y to o to Y Growth Trend Analysis
      • Absolute $ Opportunity Analysis
  5. Global Market Pricing Analysis 2020 to 2024 and Forecast 2025 to 2035
  6. Global Market Analysis 2020 to 2024 and Forecast 2025 to 2035, By Technology
    • Introduction / Key Findings
    • Historical Market Size Value (USD Million) Analysis By Technology , 2020 to 2024
    • Current and Future Market Size Value (USD Million) Analysis and Forecast By Technology , 2025 to 2035
      • High-Slice CT
      • Mid-Slice CT
      • Low-Slice CT
      • Cone Beam CT
    • Y to o to Y Growth Trend Analysis By Technology , 2020 to 2024
    • Absolute $ Opportunity Analysis By Technology , 2025 to 2035
  7. Global Market Analysis 2020 to 2024 and Forecast 2025 to 2035, By Application
    • Introduction / Key Findings
    • Historical Market Size Value (USD Million) Analysis By Application, 2020 to 2024
    • Current and Future Market Size Value (USD Million) Analysis and Forecast By Application, 2025 to 2035
      • Neurology
      • Orthopedics
      • Oncology
      • Cardiovascular
      • Respiratory
      • Gastrointestinal
      • Others
    • Y to o to Y Growth Trend Analysis By Application, 2020 to 2024
    • Absolute $ Opportunity Analysis By Application, 2025 to 2035
  8. Global Market Analysis 2020 to 2024 and Forecast 2025 to 2035, By End-User
    • Introduction / Key Findings
    • Historical Market Size Value (USD Million) Analysis By End-User, 2020 to 2024
    • Current and Future Market Size Value (USD Million) Analysis and Forecast By End-User, 2025 to 2035
      • Hospitals
      • Ambulatory Surgery Centers
      • Diagnostics Imaging Centers
      • Others
    • Y to o to Y Growth Trend Analysis By End-User, 2020 to 2024
    • Absolute $ Opportunity Analysis By End-User, 2025 to 2035
  9. Global Market Analysis 2020 to 2024 and Forecast 2025 to 2035, By Region
    • Introduction
    • Historical Market Size Value (USD Million) Analysis By Region, 2020 to 2024
    • Current Market Size Value (USD Million) Analysis and Forecast By Region, 2025 to 2035
      • North America
      • Latin America
      • Western Europe
      • Eastern Europe
      • East Asia
      • South Asia and Pacific
      • Middle East & Africa
    • Market Attractiveness Analysis By Region
  10. North America Market Analysis 2020 to 2024 and Forecast 2025 to 2035, By Country
    • Historical Market Size Value (USD Million) Trend Analysis By Market Taxonomy, 2020 to 2024
    • Market Size Value (USD Million) Forecast By Market Taxonomy, 2025 to 2035
      • By Country
        • USA
        • Canada
        • Mexico
      • By Technology
      • By Application
      • By End-User
    • Market Attractiveness Analysis
      • By Country
      • By Technology
      • By Application
      • By End-User
    • Key Takeaways
  11. Latin America Market Analysis 2020 to 2024 and Forecast 2025 to 2035, By Country
    • Historical Market Size Value (USD Million) Trend Analysis By Market Taxonomy, 2020 to 2024
    • Market Size Value (USD Million) Forecast By Market Taxonomy, 2025 to 2035
      • By Country
        • Brazil
        • Chile
        • Rest of Latin America
      • By Technology
      • By Application
      • By End-User
    • Market Attractiveness Analysis
      • By Country
      • By Technology
      • By Application
      • By End-User
    • Key Takeaways
  12. Western Europe Market Analysis 2020 to 2024 and Forecast 2025 to 2035, By Country
    • Historical Market Size Value (USD Million) Trend Analysis By Market Taxonomy, 2020 to 2024
    • Market Size Value (USD Million) Forecast By Market Taxonomy, 2025 to 2035
      • By Country
        • Germany
        • UK
        • Italy
        • Spain
        • France
        • Nordic
        • BENELUX
        • Rest of Western Europe
      • By Technology
      • By Application
      • By End-User
    • Market Attractiveness Analysis
      • By Country
      • By Technology
      • By Application
      • By End-User
    • Key Takeaways
  13. Eastern Europe Market Analysis 2020 to 2024 and Forecast 2025 to 2035, By Country
    • Historical Market Size Value (USD Million) Trend Analysis By Market Taxonomy, 2020 to 2024
    • Market Size Value (USD Million) Forecast By Market Taxonomy, 2025 to 2035
      • By Country
        • Russia
        • Poland
        • Hungary
        • Balkan & Baltic
        • Rest of Eastern Europe
      • By Technology
      • By Application
      • By End-User
    • Market Attractiveness Analysis
      • By Country
      • By Technology
      • By Application
      • By End-User
    • Key Takeaways
  14. East Asia Market Analysis 2020 to 2024 and Forecast 2025 to 2035, By Country
    • Historical Market Size Value (USD Million) Trend Analysis By Market Taxonomy, 2020 to 2024
    • Market Size Value (USD Million) Forecast By Market Taxonomy, 2025 to 2035
      • By Country
        • China
        • Japan
        • South Korea
      • By Technology
      • By Application
      • By End-User
    • Market Attractiveness Analysis
      • By Country
      • By Technology
      • By Application
      • By End-User
    • Key Takeaways
  15. South Asia and Pacific Market Analysis 2020 to 2024 and Forecast 2025 to 2035, By Country
    • Historical Market Size Value (USD Million) Trend Analysis By Market Taxonomy, 2020 to 2024
    • Market Size Value (USD Million) Forecast By Market Taxonomy, 2025 to 2035
      • By Country
        • India
        • ASEAN
        • Australia & New Zealand
        • Rest of South Asia and Pacific
      • By Technology
      • By Application
      • By End-User
    • Market Attractiveness Analysis
      • By Country
      • By Technology
      • By Application
      • By End-User
    • Key Takeaways
  16. Middle East & Africa Market Analysis 2020 to 2024 and Forecast 2025 to 2035, By Country
    • Historical Market Size Value (USD Million) Trend Analysis By Market Taxonomy, 2020 to 2024
    • Market Size Value (USD Million) Forecast By Market Taxonomy, 2025 to 2035
      • By Country
        • Kingdom of Saudi Arabia
        • Other GCC Countries
        • Turkiye
        • South Africa
        • Other African Union
        • Rest of Middle East & Africa
      • By Technology
      • By Application
      • By End-User
    • Market Attractiveness Analysis
      • By Country
      • By Technology
      • By Application
      • By End-User
    • Key Takeaways
  17. Key Countries Market Analysis
    • USA
      • Pricing Analysis
      • Market Share Analysis, 2024
        • By Technology
        • By Application
        • By End-User
    • Canada
      • Pricing Analysis
      • Market Share Analysis, 2024
        • By Technology
        • By Application
        • By End-User
    • Mexico
      • Pricing Analysis
      • Market Share Analysis, 2024
        • By Technology
        • By Application
        • By End-User
    • Brazil
      • Pricing Analysis
      • Market Share Analysis, 2024
        • By Technology
        • By Application
        • By End-User
    • Chile
      • Pricing Analysis
      • Market Share Analysis, 2024
        • By Technology
        • By Application
        • By End-User
    • Germany
      • Pricing Analysis
      • Market Share Analysis, 2024
        • By Technology
        • By Application
        • By End-User
    • UK
      • Pricing Analysis
      • Market Share Analysis, 2024
        • By Technology
        • By Application
        • By End-User
    • Italy
      • Pricing Analysis
      • Market Share Analysis, 2024
        • By Technology
        • By Application
        • By End-User
    • Spain
      • Pricing Analysis
      • Market Share Analysis, 2024
        • By Technology
        • By Application
        • By End-User
    • France
      • Pricing Analysis
      • Market Share Analysis, 2024
        • By Technology
        • By Application
        • By End-User
    • India
      • Pricing Analysis
      • Market Share Analysis, 2024
        • By Technology
        • By Application
        • By End-User
    • ASEAN
      • Pricing Analysis
      • Market Share Analysis, 2024
        • By Technology
        • By Application
        • By End-User
    • Australia & New Zealand
      • Pricing Analysis
      • Market Share Analysis, 2024
        • By Technology
        • By Application
        • By End-User
    • China
      • Pricing Analysis
      • Market Share Analysis, 2024
        • By Technology
        • By Application
        • By End-User
    • Japan
      • Pricing Analysis
      • Market Share Analysis, 2024
        • By Technology
        • By Application
        • By End-User
    • South Korea
      • Pricing Analysis
      • Market Share Analysis, 2024
        • By Technology
        • By Application
        • By End-User
    • Russia
      • Pricing Analysis
      • Market Share Analysis, 2024
        • By Technology
        • By Application
        • By End-User
    • Poland
      • Pricing Analysis
      • Market Share Analysis, 2024
        • By Technology
        • By Application
        • By End-User
    • Hungary
      • Pricing Analysis
      • Market Share Analysis, 2024
        • By Technology
        • By Application
        • By End-User
    • Kingdom of Saudi Arabia
      • Pricing Analysis
      • Market Share Analysis, 2024
        • By Technology
        • By Application
        • By End-User
    • Turkiye
      • Pricing Analysis
      • Market Share Analysis, 2024
        • By Technology
        • By Application
        • By End-User
    • South Africa
      • Pricing Analysis
      • Market Share Analysis, 2024
        • By Technology
        • By Application
        • By End-User
  18. Market Structure Analysis
    • Competition Dashboard
    • Competition Benchmarking
    • Market Share Analysis of Top Players
      • By Regional
      • By Technology
      • By Application
      • By End-User
  19. Competition Analysis
    • Competition Deep Dive
      • Siemens Healthineers
        • Overview
        • Product Portfolio
        • Profitability by Market Segments (Product/Age /Sales Channel/Region)
        • Sales Footprint
        • Strategy Overview
          • Marketing Strategy
          • Product Strategy
          • Channel Strategy
      • Fujifilm Corporation
      • Carestream Health
      • Canon Medical Systems Corporation
      • Neusoft Medical Systems
      • Koninklijke Philips
      • Hitachi, Ltd
      • GE Healthcare
      • NeuroLogica Corp
      • Shenzhen Anke High-Tech Co
  20. Assumptions & Acronyms Used
  21. Research Methodology

List of Tables

  • Table 1: Global Market Value (USD Million) Forecast by Region, 2020 to 2035
  • Table 2: Global Market Value (USD Million) Forecast by Technology , 2020 to 2035
  • Table 3: Global Market Value (USD Million) Forecast by Application, 2020 to 2035
  • Table 4: Global Market Value (USD Million) Forecast by End-User, 2020 to 2035
  • Table 5: North America Market Value (USD Million) Forecast by Country, 2020 to 2035
  • Table 6: North America Market Value (USD Million) Forecast by Technology , 2020 to 2035
  • Table 7: North America Market Value (USD Million) Forecast by Application, 2020 to 2035
  • Table 8: North America Market Value (USD Million) Forecast by End-User, 2020 to 2035
  • Table 9: Latin America Market Value (USD Million) Forecast by Country, 2020 to 2035
  • Table 10: Latin America Market Value (USD Million) Forecast by Technology , 2020 to 2035
  • Table 11: Latin America Market Value (USD Million) Forecast by Application, 2020 to 2035
  • Table 12: Latin America Market Value (USD Million) Forecast by End-User, 2020 to 2035
  • Table 13: Western Europe Market Value (USD Million) Forecast by Country, 2020 to 2035
  • Table 14: Western Europe Market Value (USD Million) Forecast by Technology , 2020 to 2035
  • Table 15: Western Europe Market Value (USD Million) Forecast by Application, 2020 to 2035
  • Table 16: Western Europe Market Value (USD Million) Forecast by End-User, 2020 to 2035
  • Table 17: Eastern Europe Market Value (USD Million) Forecast by Country, 2020 to 2035
  • Table 18: Eastern Europe Market Value (USD Million) Forecast by Technology , 2020 to 2035
  • Table 19: Eastern Europe Market Value (USD Million) Forecast by Application, 2020 to 2035
  • Table 20: Eastern Europe Market Value (USD Million) Forecast by End-User, 2020 to 2035
  • Table 21: East Asia Market Value (USD Million) Forecast by Country, 2020 to 2035
  • Table 22: East Asia Market Value (USD Million) Forecast by Technology , 2020 to 2035
  • Table 23: East Asia Market Value (USD Million) Forecast by Application, 2020 to 2035
  • Table 24: East Asia Market Value (USD Million) Forecast by End-User, 2020 to 2035
  • Table 25: South Asia and Pacific Market Value (USD Million) Forecast by Country, 2020 to 2035
  • Table 26: South Asia and Pacific Market Value (USD Million) Forecast by Technology , 2020 to 2035
  • Table 27: South Asia and Pacific Market Value (USD Million) Forecast by Application, 2020 to 2035
  • Table 28: South Asia and Pacific Market Value (USD Million) Forecast by End-User, 2020 to 2035
  • Table 29: Middle East & Africa Market Value (USD Million) Forecast by Country, 2020 to 2035
  • Table 30: Middle East & Africa Market Value (USD Million) Forecast by Technology , 2020 to 2035
  • Table 31: Middle East & Africa Market Value (USD Million) Forecast by Application, 2020 to 2035
  • Table 32: Middle East & Africa Market Value (USD Million) Forecast by End-User, 2020 to 2035

List of Figures

  • Figure 1: Global Market Pricing Analysis
  • Figure 2: Global Market Value (USD Million) Forecast 2020-2035
  • Figure 3: Global Market Value Share and BPS Analysis by Technology , 2025 and 2035
  • Figure 4: Global Market Y to o to Y Growth Comparison by Technology , 2025-2035
  • Figure 5: Global Market Attractiveness Analysis by Technology
  • Figure 6: Global Market Value Share and BPS Analysis by Application, 2025 and 2035
  • Figure 7: Global Market Y to o to Y Growth Comparison by Application, 2025-2035
  • Figure 8: Global Market Attractiveness Analysis by Application
  • Figure 9: Global Market Value Share and BPS Analysis by End-User, 2025 and 2035
  • Figure 10: Global Market Y to o to Y Growth Comparison by End-User, 2025-2035
  • Figure 11: Global Market Attractiveness Analysis by End-User
  • Figure 12: Global Market Value (USD Million) Share and BPS Analysis by Region, 2025 and 2035
  • Figure 13: Global Market Y to o to Y Growth Comparison by Region, 2025-2035
  • Figure 14: Global Market Attractiveness Analysis by Region
  • Figure 15: North America Market Incremental Dollar Opportunity, 2025-2035
  • Figure 16: Latin America Market Incremental Dollar Opportunity, 2025-2035
  • Figure 17: Western Europe Market Incremental Dollar Opportunity, 2025-2035
  • Figure 18: Eastern Europe Market Incremental Dollar Opportunity, 2025-2035
  • Figure 19: East Asia Market Incremental Dollar Opportunity, 2025-2035
  • Figure 20: South Asia and Pacific Market Incremental Dollar Opportunity, 2025-2035
  • Figure 21: Middle East & Africa Market Incremental Dollar Opportunity, 2025-2035
  • Figure 22: North America Market Value Share and BPS Analysis by Country, 2025 and 2035
  • Figure 23: North America Market Value Share and BPS Analysis by Technology , 2025 and 2035
  • Figure 24: North America Market Y to o to Y Growth Comparison by Technology , 2025-2035
  • Figure 25: North America Market Attractiveness Analysis by Technology
  • Figure 26: North America Market Value Share and BPS Analysis by Application, 2025 and 2035
  • Figure 27: North America Market Y to o to Y Growth Comparison by Application, 2025-2035
  • Figure 28: North America Market Attractiveness Analysis by Application
  • Figure 29: North America Market Value Share and BPS Analysis by End-User, 2025 and 2035
  • Figure 30: North America Market Y to o to Y Growth Comparison by End-User, 2025-2035
  • Figure 31: North America Market Attractiveness Analysis by End-User
  • Figure 32: Latin America Market Value Share and BPS Analysis by Country, 2025 and 2035
  • Figure 33: Latin America Market Value Share and BPS Analysis by Technology , 2025 and 2035
  • Figure 34: Latin America Market Y to o to Y Growth Comparison by Technology , 2025-2035
  • Figure 35: Latin America Market Attractiveness Analysis by Technology
  • Figure 36: Latin America Market Value Share and BPS Analysis by Application, 2025 and 2035
  • Figure 37: Latin America Market Y to o to Y Growth Comparison by Application, 2025-2035
  • Figure 38: Latin America Market Attractiveness Analysis by Application
  • Figure 39: Latin America Market Value Share and BPS Analysis by End-User, 2025 and 2035
  • Figure 40: Latin America Market Y to o to Y Growth Comparison by End-User, 2025-2035
  • Figure 41: Latin America Market Attractiveness Analysis by End-User
  • Figure 42: Western Europe Market Value Share and BPS Analysis by Country, 2025 and 2035
  • Figure 43: Western Europe Market Value Share and BPS Analysis by Technology , 2025 and 2035
  • Figure 44: Western Europe Market Y to o to Y Growth Comparison by Technology , 2025-2035
  • Figure 45: Western Europe Market Attractiveness Analysis by Technology
  • Figure 46: Western Europe Market Value Share and BPS Analysis by Application, 2025 and 2035
  • Figure 47: Western Europe Market Y to o to Y Growth Comparison by Application, 2025-2035
  • Figure 48: Western Europe Market Attractiveness Analysis by Application
  • Figure 49: Western Europe Market Value Share and BPS Analysis by End-User, 2025 and 2035
  • Figure 50: Western Europe Market Y to o to Y Growth Comparison by End-User, 2025-2035
  • Figure 51: Western Europe Market Attractiveness Analysis by End-User
  • Figure 52: Eastern Europe Market Value Share and BPS Analysis by Country, 2025 and 2035
  • Figure 53: Eastern Europe Market Value Share and BPS Analysis by Technology , 2025 and 2035
  • Figure 54: Eastern Europe Market Y to o to Y Growth Comparison by Technology , 2025-2035
  • Figure 55: Eastern Europe Market Attractiveness Analysis by Technology
  • Figure 56: Eastern Europe Market Value Share and BPS Analysis by Application, 2025 and 2035
  • Figure 57: Eastern Europe Market Y to o to Y Growth Comparison by Application, 2025-2035
  • Figure 58: Eastern Europe Market Attractiveness Analysis by Application
  • Figure 59: Eastern Europe Market Value Share and BPS Analysis by End-User, 2025 and 2035
  • Figure 60: Eastern Europe Market Y to o to Y Growth Comparison by End-User, 2025-2035
  • Figure 61: Eastern Europe Market Attractiveness Analysis by End-User
  • Figure 62: East Asia Market Value Share and BPS Analysis by Country, 2025 and 2035
  • Figure 63: East Asia Market Value Share and BPS Analysis by Technology , 2025 and 2035
  • Figure 64: East Asia Market Y to o to Y Growth Comparison by Technology , 2025-2035
  • Figure 65: East Asia Market Attractiveness Analysis by Technology
  • Figure 66: East Asia Market Value Share and BPS Analysis by Application, 2025 and 2035
  • Figure 67: East Asia Market Y to o to Y Growth Comparison by Application, 2025-2035
  • Figure 68: East Asia Market Attractiveness Analysis by Application
  • Figure 69: East Asia Market Value Share and BPS Analysis by End-User, 2025 and 2035
  • Figure 70: East Asia Market Y to o to Y Growth Comparison by End-User, 2025-2035
  • Figure 71: East Asia Market Attractiveness Analysis by End-User
  • Figure 72: South Asia and Pacific Market Value Share and BPS Analysis by Country, 2025 and 2035
  • Figure 73: South Asia and Pacific Market Value Share and BPS Analysis by Technology , 2025 and 2035
  • Figure 74: South Asia and Pacific Market Y to o to Y Growth Comparison by Technology , 2025-2035
  • Figure 75: South Asia and Pacific Market Attractiveness Analysis by Technology
  • Figure 76: South Asia and Pacific Market Value Share and BPS Analysis by Application, 2025 and 2035
  • Figure 77: South Asia and Pacific Market Y to o to Y Growth Comparison by Application, 2025-2035
  • Figure 78: South Asia and Pacific Market Attractiveness Analysis by Application
  • Figure 79: South Asia and Pacific Market Value Share and BPS Analysis by End-User, 2025 and 2035
  • Figure 80: South Asia and Pacific Market Y to o to Y Growth Comparison by End-User, 2025-2035
  • Figure 81: South Asia and Pacific Market Attractiveness Analysis by End-User
  • Figure 82: Middle East & Africa Market Value Share and BPS Analysis by Country, 2025 and 2035
  • Figure 83: Middle East & Africa Market Value Share and BPS Analysis by Technology , 2025 and 2035
  • Figure 84: Middle East & Africa Market Y to o to Y Growth Comparison by Technology , 2025-2035
  • Figure 85: Middle East & Africa Market Attractiveness Analysis by Technology
  • Figure 86: Middle East & Africa Market Value Share and BPS Analysis by Application, 2025 and 2035
  • Figure 87: Middle East & Africa Market Y to o to Y Growth Comparison by Application, 2025-2035
  • Figure 88: Middle East & Africa Market Attractiveness Analysis by Application
  • Figure 89: Middle East & Africa Market Value Share and BPS Analysis by End-User, 2025 and 2035
  • Figure 90: Middle East & Africa Market Y to o to Y Growth Comparison by End-User, 2025-2035
  • Figure 91: Middle East & Africa Market Attractiveness Analysis by End-User
  • Figure 92: Global Market - Tier Structure Analysis
  • Figure 93: Global Market - Company Share Analysis
Dashboard
Dashboard
Dashboard
Dashboard
Dashboard
Dashboard

Full Research Suite comprises of:

Market outlook & trends analysis

Market outlook & trends analysis

Interviews & case studies

Interviews & case studies

Strategic recommendations

Strategic recommendations

Vendor profiles & capabilities analysis

Vendor profiles & capabilities analysis

5-year forecasts

5-year forecasts

8 regions and 60+ country-level data splits

8 regions and 60+ country-level data splits

Market segment data splits

Market segment data splits

12 months of continuous data updates

12 months of continuous data updates

DELIVERED AS:

PDF EXCEL ONLINE

Full Research Suite


$5000

$7500

$10000

Buy Report Now
Similar Industry Reports

Similar Industry Reports

Micro Computed Tomography Market

Micro Computed Tomography Market Overview – Growth, Trends & Forecast 2024-2034

Mobile Computed Tomography Scanners Market

Mobile Computed Tomography Scanners Market Size and Share Forecast Outlook 2025 to 2035

Spectral Computed Tomography Market

Spectral Computed Tomography Market Size and Share Forecast Outlook 2025 to 2035

Veterinary Computed Tomography Scanner Market

Veterinary Computed Tomography Scanner Market Growth -Trends & Forecast 2025 to 2035

Dual and Multi-Energy Computed Tomography (CT) Market

Dual and Multi-Energy Computed Tomography (CT) Market Size and Share Forecast Outlook 2025 to 2035

Single-Photon Emission Computed Tomography Market

Single-Photon Emission Computed Tomography Market Size and Share Forecast Outlook 2025 to 2035

Mobile Tomography Market

Mobile Tomography Market Size and Share Forecast Outlook 2025 to 2035

Photoacoustic Tomography Market

Photoacoustic Tomography Market Size and Share Forecast Outlook 2025 to 2035

Optical Coherence Tomography Market

Optical Coherence Tomography Market Insights – Size, Trends & Forecast 2025–2035

Positron Emission Tomography (PET) Scanners Market

The Positron Emission Tomography (PET) Scanners Market is segmented by Full-ring PET Scanner and Partial-ring PET Scanner from 2025 to 2035

Future Market Insights

Computed Tomography Market

Chat With MaRIA

Chat With

MaRIA

Hi There, I am MaRIA, Your Market Research Intelligence Assistant. How may I help you?