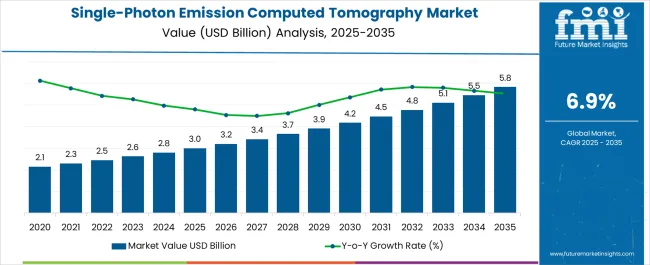
The Single-Photon Emission Computed Tomography Market is estimated to be valued at USD 3.0 billion in 2025 and is projected to reach USD 5.8 billion by 2035, registering a compound annual growth rate (CAGR) of 6.9% over the forecast period.
| Metric | Value |
|---|---|
| Single-Photon Emission Computed Tomography Market Estimated Value in (2025 E) | USD 3.0 billion |
| Single-Photon Emission Computed Tomography Market Forecast Value in (2035 F) | USD 5.8 billion |
| Forecast CAGR (2025 to 2035) | 6.9% |
The single-photon emission computed tomography (SPECT) market is experiencing sustained growth, fueled by increasing demand for precise, non-invasive imaging across cardiovascular, neurological, and oncological domains. Advances in hybrid imaging technologies and radiopharmaceutical development have expanded diagnostic capabilities while enhancing accuracy and early disease detection.
Regulatory support for early diagnosis, rising chronic disease burden, and adoption of value-based healthcare practices are pushing healthcare providers toward investing in advanced nuclear imaging modalities. Furthermore, integration with artificial intelligence and image enhancement software is improving diagnostic confidence and workflow efficiency.
Growing investment in medical infrastructure across emerging economies, along with collaborative efforts between device manufacturers and pharmaceutical firms, is expected to shape the market’s next phase. As clinical demand for cost-effective and reproducible imaging rises, SPECT is being positioned as a versatile modality with expanded applications beyond traditional use cases.
The market is segmented by Product Type, Application Type, and End User Type and region. By Product Type, the market is divided into SPECT/CT and Single Imaging Gamma Cameras. In terms of Application Type, the market is classified into Cardiology, Oncology, Neurology, and Others. Based on End User Type, the market is segmented into Hospitals, Diagnostic Imaging Centers, and Ambulatory Surgical Centers. Regionally, the market is classified into North America, Latin America, Western Europe, Eastern Europe, Balkan & Baltic Countries, Russia & Belarus, Central Asia, East Asia, South Asia & Pacific, and the Middle East & Africa.
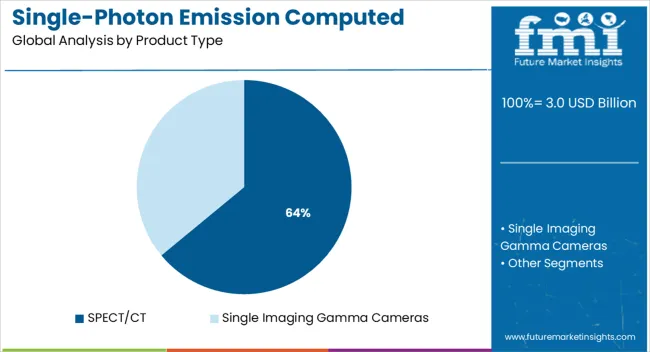
SPECT/CT systems are projected to hold 64.0% of the total market revenue in 2025, making them the leading product type in the segment. Their dominance is being driven by the ability to combine functional and anatomical imaging, allowing clinicians to improve localization and diagnostic accuracy in complex disease evaluations.
These systems support better lesion detection, staging, and therapy planning—particularly in oncology and cardiology. SPECT/CT has been increasingly adopted due to its capacity to enhance specificity and reduce false positives compared to standalone systems.
Moreover, continuous innovations in hardware, detector sensitivity, and image reconstruction algorithms have improved system performance while minimizing radiation dose. As precision medicine advances, and hybrid imaging becomes the standard in tertiary care centers, SPECT/CT is expected to maintain its strong position in the clinical imaging landscape.
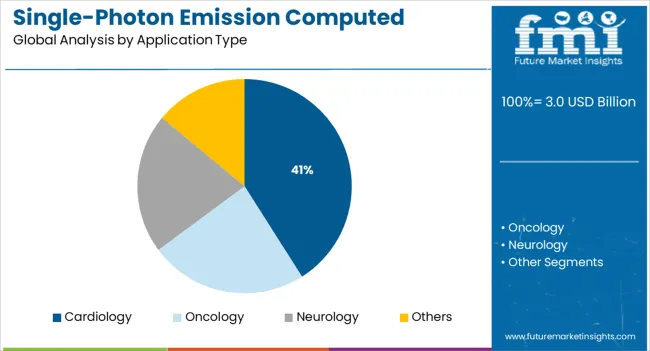
Cardiology applications are expected to contribute 41.0% of the total market revenue in 2025, positioning this segment as the leading diagnostic area. The segment’s growth is being propelled by the rising global prevalence of cardiovascular diseases and the increasing emphasis on early risk assessment and management.
SPECT enables myocardial perfusion imaging, which remains a gold standard for detecting coronary artery disease and assessing cardiac function. The cost-effectiveness and accessibility of SPECT systems make them highly suitable for both outpatient and inpatient settings.
Additionally, growing awareness around preventive cardiac screening and expanded reimbursement support in several regions have further driven adoption. As population aging and sedentary lifestyles contribute to the cardiovascular disease burden, cardiology is expected to remain the core application area for SPECT imaging.
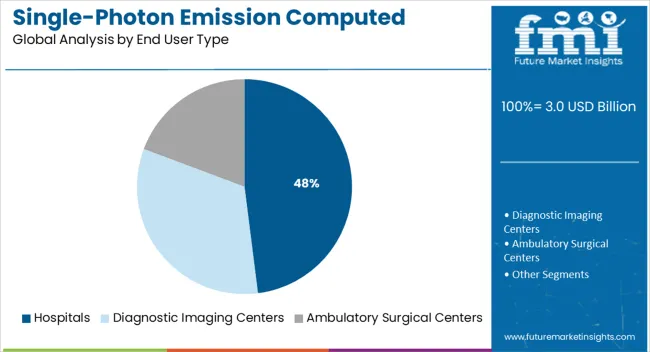
Hospitals are forecast to account for 48.0% of the total market revenue in 2025, making them the largest end-user segment. This leadership is being attributed to the comprehensive diagnostic infrastructure, skilled nuclear medicine workforce, and increasing availability of radiopharmaceuticals in hospital-based imaging departments.
Hospitals are also more likely to adopt hybrid imaging platforms like SPECT/CT, owing to the high volume of complex diagnostic procedures performed in these settings. Centralized procurement models, strong clinical research capabilities, and access to emergency and specialized care services make hospitals the primary adoption centers for advanced imaging systems.
The growing burden of chronic and acute conditions, along with evolving clinical guidelines emphasizing evidence-based imaging, further strengthens the hospital segment’s role in driving the overall market.
The global single-photon emission computed tomography market expanded at a CAGR of 5.4% during the historic period from 2012 to 2024. However, with the growing demand for effective diagnostic techniques, the overall sales of single-photon emission computed tomography products are likely to grow at 6.9% CAGR through 2035.
Demand for single-photon emission computed tomography scanners in cancer diagnosis has increased significantly over the past few years and the trend is likely to continue during the forecast period. The technology offers a sophisticated diagnostic tool that helps in early disease diagnosis coupled with the capability to detect disease progression at each stage.
Cancer is one of the leading causes of death in many countries around the globe, accounting for nearly 2.8 million deaths in 2024, or nearly one in six deaths.
Industry experts have noted that the diagnostic accuracy of single-photon emission computed tomography scanners in certain clinical oncological examinations such as lung cancer, prostate cancer, colorectal cancer, melanoma, and several other cancers is higher than other diagnostic imaging techniques.
Manufacturers are concentrating on integrating several technological advancements into their single-photon emission computed tomography scanning machines, including higher storage capacity and increased efficiency about faster scanning times.
From a business perspective, increased data storage will enable physicians to archive more information from patients' prior scans, track tumor development over the course of a patient's disease prognosis, and perform more scans per day, increasing the financial viability of single-photon emission computed tomography scanners in the nuclear medicine industry.
Growing Application of Single-Photon Emission Computed Tomography in Various Medical Fields and Advancements in radiopharmacy to Boost Market
Globally, single-photon emission computed tomography (SPECT) and X-ray transmission computed tomography (CT) scan hybrid imaging is becoming more popular. With the exact attenuation correction and fusion imaging that this cutting-edge technology offers, diagnostic sensitivity, and specificity are increased.
By defining prognostic and treatment monitoring capabilities and metabolic information provided by traditional nuclear imaging methods, the combination of SPECT and CT aids in improved disease staging. As a result, SPECT/CT has increasingly been used in clinical tests, particularly in the areas of musculoskeletal, cardiology, endocrinology, cancer, infection, and others.
Due to their use in creating a customized treatment plan for individualized treatment, multimodality imaging techniques will further change diagnostic imaging procedures in the future.
The practice of nuclear medicine has changed dramatically over the past ten years as a result of amazing developments in radiopharmacy, instrumentation, and information technology, all of which have played significant roles in fostering the field's expansion.
The field of nuclear medicine has been revived by new technologies like PET/CT and SPECT/CT. It is also anticipated that the development of novel radiopharmaceuticals and other hybrid modalities, like SPECT/MRI, would spur the development of new diagnostic and therapeutic uses.
All the above scenarios offer a great opportunity for market growth during the forecast period from 2025 to 2035.
The expansion of the single-photon emission computed tomography market over the projection period may be constrained by the lower availability and insufficient supply of molecular isotopes, which are necessary for diagnostic imaging devices.
For instance, there have been numerous supply shortages for technetium and molybdenum during the past few years, which are used in the bulk of SPECT operations in cardiology. Due to aging and safety concerns, the Canadian reactors that supply the molecular isotopes were permanently shut down in 2020, which limited the supply.
The field of nuclear medicine imaging has reached milestones with the advent of hybrid/fusion scanners which are paving the way to a new era in the field of imaging.
The introduction of new radiation detector systems in nuclear medicine imaging has led to a multifold increase in sensitivity and energy resolution. With the use of CZT (cadmium zinc telluride) detectors, SPECT/CT is likely to become organ-specific.
Similarly, the higher price of SPECT devices, such as SPECT-CT, SPECT-MRI, and the integration and combination of various diagnostics and imaging devices is usually a major cost restraint for the single-photon emission computed tomography market.
Only professionals who are trained within the healthcare domain for day-to-day operations and maintenance can work on single-photon emission computed tomography devices. Globally, the demand for SPECT devices is increasing. The shortage of trained specialists and professionals will hamper the growth of the global single-photon emission computed tomography market over the forecast period.
These factors cumulatively propose a negative effect on the developmental growth of the single-photon emission computed tomography market.
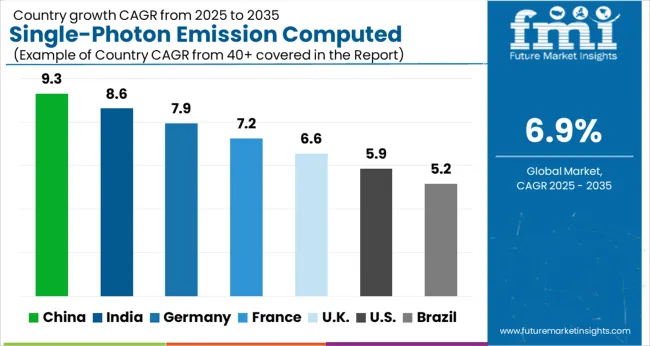
Presence of Favourable Reimbursement Policies Boosting Market in the USA
The USA holds approximately 38.0% share in the global single-photon emission computed tomography market in 2024 and is projected to grow at a robust pace during the forecast period.
Favorable reimbursement for nuclear medicine devices and treatment is increasing in North America which is expected to boost the growth of the United States of America single-photon emission computed tomography market.
The percentage of the total payor mix from private/self-pay revenue increased from 66.5% in 2020 to 67.4% in 2024. The Medicare percentage decreased from 21.8% to 20.5%.
Rapid Expansion of Healthcare Infrastructure Generating demand in China
With a market share of over 5.3% in 2024 in the global market, China's single-photon emission computed tomography market is anticipated to grow at a healthy pace throughout the forecast period.
This expansion is attributed to the country's fast-developing medical infrastructure, an increase in scientific research on the diagnosis, treatment, and follow-up of chronic illnesses, as well as significant support from the public and commercial sectors for cancer research.
Rising Geriatric Population Driving Market in Germany
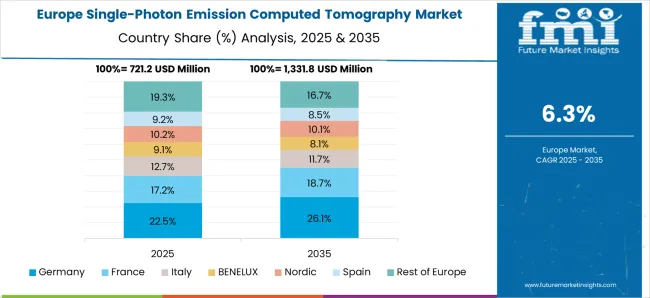
As per FMI, Germany is set to hold a market share of nearly 5.0% in the global single-photon emission computed tomography market during the forecast period owing to an increase in the elderly population, increased prevalence of cancer, clinical usage of diagnostics techniques that use radiopharmaceuticals and increasing funding from the government.
40-59-year-olds make up the largest age group in Germany, at 2.8 million people. The most recent figures from 2024 confirm that the next-largest age group was 65 years and older, at 18.44 million.
Demand to Remain High for Single Imaging Cameras
The single imaging gamma cameras segment held a market share of about 75.5% in the global market in 2024 and it is expected to grow at a CAGR of 6.3% throughout the forecast period.
The most used imaging tool in nuclear medicine is the gamma camera, often known as a scintillation camera. It allows the capture of both dynamic and static images of the area of interest in the human body. Thus single-imaging gamma cameras are ahead of other products in the single-photon emission computed tomography market.
Growing Popularity of SPECT in Cardiology to Generate Maximum Revenues
Based on application, the cardiology segment held a revenue share of around 36.6% in the global single photon emission computed tomography market in 2024 and is expected to expand at a moderate growth rate over the forecast period.
Cardiologists utilize single-photon emission computed tomography to see how the blood flows through various areas of the heart. Doctors can see where and how well blood flows into and around the heart by injecting a radioactive tracer (such as technetium or sestamibi) that has been marked with gamma cameras.
In this ailment, medical professionals determine whether a patient's heart has been negatively affected by conditions such as hypertension, coronary artery disease, atherosclerosis (artery hardening), valvular diseases like mitral valve prolapse, congenital bicuspid valves brought on by infection in early childhood, etc.
Most of the SPECT Product Sales Remain Concentrated in Hospitals
The hospital's segment held a 56.9% market share in the single-photon emission computed tomography market in 2024 and it is expected to grow at a CAGR of 7.6% during the forecast period, owing to the easy access and availability of SPECT products across hospitals for cardiology and oncology treatments.
The SPECT market will boost due to a large number of patients being admitted to the hospital for seeking treatment. The availability of advanced medical equipment with improved efficiency and technology along with trained staff and healthcare professionals add to the high growth of this segment.
Similarly, the presence of advanced medical equipment attracts a large number of patients to come to hospitals to seek treatment and get maximum satisfaction and relief. Thus hospitals are ahead of other end users in the single-photon emission computed tomography market.
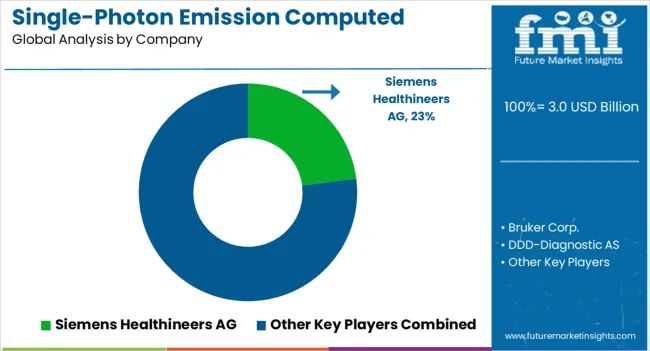
To establish a dominant position in the market, major players in the single-photon emission computed tomography market are aggressively concentrating on partnerships, product launches, and expansion.
For instance
| Attribute | Details |
|---|---|
| Estimated Market Size (2025) | USD 3.0 billion |
| Projected Market Size (2035) | USD 5.8 billion |
| Anticipated Growth Rate (2025 to 2035) | 6.9% |
| Forecast Period | 2012 to 2024 |
| Historical Data Available for | 2025 to 2035 |
| Market Analysis | USD Million for Value |
| Key Regions Covered | North America; Latin America; Europe; South Asia; East Asia; Oceania; and Middle East & Africa |
| Key Countries Covered | USA, Canada, Brazil, Mexico, Argentina, UK, Germany, Italy, Russia, Spain, France, BENELUX, Nordic Countries, Russia, India, Thailand, Indonesia, Malaysia, Vietnam, Philippines Japan, China, South Korea, Australia, New Zealand, Turkey, GCC Countries, North Africa, Israel, North Africa, and South Africa |
| Key Market Segments Covered | Product, Application, End User, and Region |
| Key Companies Profiled | Bruker Corp.; DDD-Diagnostic AS; Digmed Corp.; General Electric Co.; Mediso Ltd.; MiE GmbH; MILabs BV; Siemens Healthineers AG; Spectrum Dynamics Medical Inc.; GE Healthcare; CardiArc; Beijing Hamamatsu Photon Techniques INC.; SHENZHEN BASDA MEDICAL APPARATUS CO., LTD.; PNPMed; NuCare Inc. |
| Report Coverage | Market Forecast, Company Share Analysis, Competition Intelligence, Drivers, Restraints, Opportunities and Threats Analysis, Market Dynamics and Challenges, and Strategic Growth Initiatives |
The global single-photon emission computed tomography market is estimated to be valued at USD 3.0 billion in 2025.
The market size for the single-photon emission computed tomography market is projected to reach USD 5.8 billion by 2035.
The single-photon emission computed tomography market is expected to grow at a 6.9% CAGR between 2025 and 2035.
The key product types in single-photon emission computed tomography market are spect/ct and single imaging gamma cameras.
In terms of application type, cardiology segment to command 41.0% share in the single-photon emission computed tomography market in 2025.


Full Research Suite comprises of:
Market outlook & trends analysis
Interviews & case studies
Strategic recommendations
Vendor profiles & capabilities analysis
5-year forecasts
8 regions and 60+ country-level data splits
Market segment data splits
12 months of continuous data updates
DELIVERED AS:
PDF EXCEL ONLINE
Emissions Management Market Size and Share Forecast Outlook 2025 to 2035
Emission Control Catalyst for Small Engines Market - Size, Share, and Forecast 2025 to 2035
Motorcycle Emission Control Catalyst Market Growth - Trends & Forecast 2025 to 2035
Emission Control Catalyst Market Growth – Trends & Forecast 2024-2034
Emission Monitoring Software Market
Emission Monitoring Systems Market
Zero Emission Aircraft Market Size and Share Forecast Outlook 2025 to 2035
Zero Emission Vehicle Market Growth - Trends & Forecast 2025 to 2035
Marine Emission Control Catalyst Market - Size, Share, and Forecast 2025 to 2035
Optical Emission Spectroscopy Market Report – Trends 2019-2027
Vehicle Emission Testers Market
The Positron Emission Tomography (PET) Scanners Market is segmented by Full-ring PET Scanner and Partial-ring PET Scanner from 2025 to 2035
Automotive Emission Test Equipment Market Size and Share Forecast Outlook 2025 to 2035
Continuous Emission Monitoring System Market Growth - Trends & Forecast 2025 to 2035
Otoacoustic Emissions Hearing Screener Market Size and Share Forecast Outlook 2025 to 2035
Angle-Resolved Photoemission Spectroscopy Market Size and Share Forecast Outlook 2025 to 2035
Mobile Tomography Market Size and Share Forecast Outlook 2025 to 2035
Photoacoustic Tomography Market Size and Share Forecast Outlook 2025 to 2035
Optical Coherence Tomography Market Insights – Size, Trends & Forecast 2025–2035
Computed Tomography Market Size and Share Forecast Outlook 2025 to 2035

Thank you!
You will receive an email from our Business Development Manager. Please be sure to check your SPAM/JUNK folder too.
Chat With
MaRIA