Emissions Management Market Size and Share Forecast Outlook 2025 to 2035

The Emissions Management Market is estimated to be valued at USD 7.7 billion in 2025 and is projected to reach USD 15.5 billion by 2035, registering a compound annual growth rate (CAGR) of 7.2% over the forecast period.
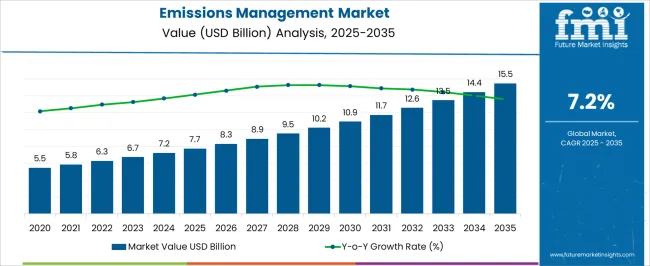
Quick Stats for Emissions Management Market

  • Emissions Management Market Value (2025): USD 7.7 billion
  • Emissions Management Market Forecast Value (2035): USD 15.5 billion
  • Emissions Management Market Forecast CAGR: 7.2%
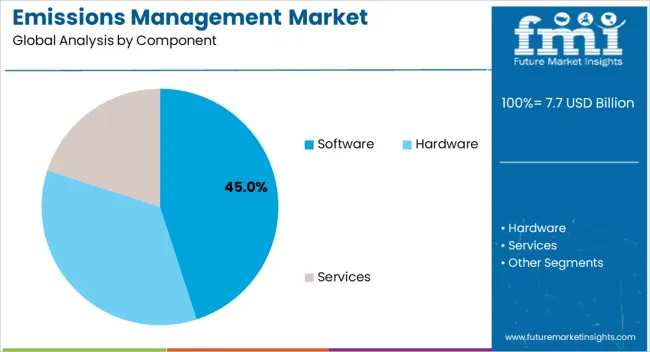
  • Leading Segment in Emissions Management Market in 2025: Software (45.0%)
  • Key Growth Regions in Emissions Management Market: North America, Asia-Pacific, Europe
  • Top Key Players in Emissions Management Market: General Electric, CECO Environmental, Fujian Longking Co. Ltd, Hamon Corporation, Ducon Technologies Inc., Thermax Ltd, CONFORMiT, Accuvio Software, iSystain, Johnson Matthey, Intelex Technologies, Babcock & Wilcox Co. Enablon, AMEC Foster Wheeler (John Wood Group), ERA Environmental, Mitsubishi Hitachi Power Systems Ltd., Teck Resources

Emissions Management Market Market Value Analysis

Emissions Management Market Key Takeaways

Metric Value
Emissions Management Market Estimated Value in (2025 E) USD 7.7 billion
Emissions Management Market Forecast Value in (2035 F) USD 15.5 billion
Forecast CAGR (2025 to 2035) 7.2%

Why is the Emissions Management Market Growing?

The Emissions Management market is experiencing steady growth driven by increasing regulatory pressure on environmental compliance, the adoption of sustainability initiatives, and rising corporate focus on carbon footprint reduction. The market is shaped by the need for real-time monitoring, reporting, and analytics to meet emission standards across industries, particularly in energy, manufacturing, and transportation sectors.

Growing investments in digital transformation and environmental management systems are accelerating the adoption of software-based monitoring solutions, while organizations are increasingly prioritizing automation, data accuracy, and predictive insights to optimize emissions reduction strategies. The future outlook is strengthened by the convergence of cloud computing, Internet of Things, and AI-based analytics, which enable organizations to enhance operational efficiency while ensuring compliance.

Companies are expected to expand their use of integrated emissions management platforms that can monitor multiple sources and provide actionable insights for sustainability initiatives As environmental regulations continue to tighten globally and stakeholder expectations for sustainable operations rise, the market is positioned for consistent growth with software-driven solutions becoming increasingly central to organizational strategy.

Segmental Analysis:

The emissions management market is segmented by component, deployment, end-user, vertical, and geographic regions. By component, emissions management market is divided into Software, Hardware, and Services. In terms of deployment, emissions management market is classified into On-Premise and Cloud. Based on end-user, emissions management market is segmented into Large Enterprisers and Small And Medium Enterprises. By vertical, emissions management market is segmented into Oil & Gas, Food & Beverages, Power Generation, Chemical & Mining, Leather & Textile, Coal & Mining, and Others. Regionally, the emissions management industry is classified into North America, Latin America, Western Europe, Eastern Europe, Balkan & Baltic Countries, Russia & Belarus, Central Asia, East Asia, South Asia & Pacific, and the Middle East & Africa.
Insights into the Software Component Segment

Emissions Management Market Analysis By Component

The software component is projected to hold 45.0% of the Emissions Management market revenue share in 2025, making it the leading component. This dominance is driven by the flexibility and scalability offered by software solutions, which allow organizations to monitor, analyze, and report emissions in real time without frequent hardware upgrades. Adoption is further accelerated by the need for comprehensive data management, automated compliance reporting, and integration with existing enterprise resource planning systems.

The software component supports predictive analytics, scenario modeling, and decision-making processes that enable organizations to proactively manage emissions and optimize operational performance. The ability to update and expand functionalities through software releases rather than hardware replacement has reinforced its value proposition.

Additionally, software platforms offer customization options tailored to specific industry requirements, allowing large enterprises to align their sustainability strategies with organizational goals efficiently The increasing emphasis on corporate social responsibility and environmental accountability has further bolstered the adoption of software-driven solutions, making this component the primary driver of market growth.
Insights into the On-Premise Deployment Segment

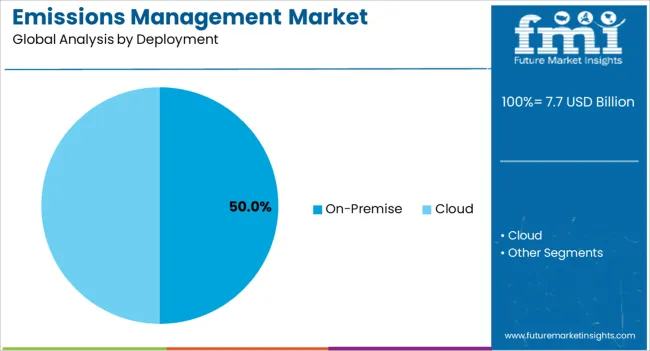
Emissions Management Market Analysis By Deployment

On-premise deployment is expected to account for 50.0% of the Emissions Management market in 2025, representing the leading deployment model. This prevalence is attributed to organizations’ preference for retaining direct control over sensitive emissions data, ensuring security, and customizing system architecture to meet specific operational needs. On-premise solutions allow organizations to integrate emissions monitoring directly with their existing IT infrastructure, supporting advanced analytics and reporting without relying on external networks.

Adoption is supported by the demand for high data integrity, real-time monitoring, and rapid response to regulatory audits or compliance requirements. Enterprises with complex operations or multi-site facilities find on-premise deployment advantageous because it offers scalability and configurability tailored to organizational workflows.

Furthermore, organizations in heavily regulated industries often require on-premise systems to satisfy compliance and internal governance policies As digital infrastructure in large organizations evolves, on-premise deployment continues to attract preference due to its security, customization, and operational efficiency, making it a key contributor to market growth.
Insights into the Large Enterprise End-User Segment

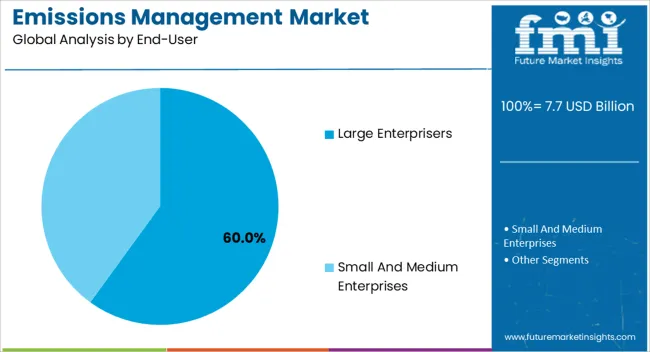
Emissions Management Market Analysis By End User

The large enterprise segment is anticipated to hold 60.0% of the Emissions Management market revenue share in 2025, positioning it as the dominant end-user category. This leadership is driven by the scale and complexity of operations in large organizations, which require robust monitoring and reporting systems to comply with stringent environmental regulations.

Adoption is fueled by the need to consolidate emissions data across multiple sites and processes, automate compliance reporting, and generate actionable insights to reduce environmental impact while improving operational efficiency. Large enterprises benefit from the integration of software-based emissions management platforms with broader sustainability strategies, including carbon accounting, energy optimization, and ESG reporting.

Investments in advanced analytics, AI-enabled forecasting, and enterprise-wide data management have further strengthened adoption, as these organizations are able to leverage technology to meet corporate sustainability goals and demonstrate regulatory compliance The rising focus on reputational risk management, stakeholder transparency, and global operational efficiency ensures continued growth of the large enterprise segment as the primary consumer of emissions management solutions.

Market Overview

Emissions Management Market Overview

The global management of atmospheric emission is creating new market opportunities for the emission management solution providers. The evolution of advanced emission control technologies such as catalytic converters, particulate filters, traps & adsorbers, and substrates are playing a crucial role in driving the growth of emissions management market.

Most of the countries are adopting emissions management for emission control through various sources in for environmental analysis. Also, emissions management provide complete emission management and streamline the process of collecting and calculating the emission data.

The emissions management helps companies to manage air quality requirements from advanced emission source modeling and calculation, to emissions forecasting and scenario analysis. Several innovations and technological advances in emission control and environmental control have generated the need for emissions management adoption across various countries.

In parallel, government policies for emission control in most of the countries is projected to drive the growth of the emission management market worldwide.
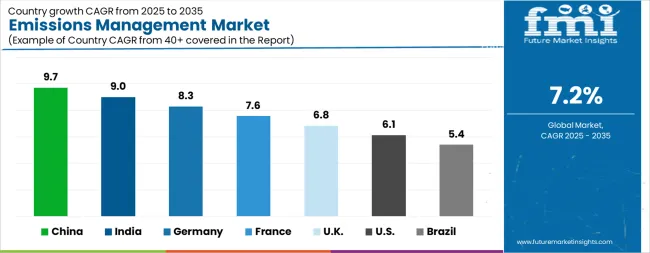
Analysis of Emissions Management Market By Key Countries

Emissions Management Market Cagr Analysis By Country

Country CAGR
China 9.7%
India 9.0%
Germany 8.3%
France 7.6%
UK 6.8%
USA 6.1%
Brazil 5.4%

Country-wise Analysis

The Emissions Management Market is expected to register a CAGR of 7.2% during the forecast period, exhibiting varied country level momentum. China leads with the highest CAGR of 9.7%, followed by India at 9.0%. Developed markets such as Germany, France, and the UK continue to expand steadily, while the USA is likely to grow at consistent rates. Brazil posts the lowest CAGR at 5.4%, yet still underscores a broadly positive trajectory for the global Emissions Management Market. In 2024, Germany held a dominant revenue in the Western Europe market and is expected to grow with a CAGR of 8.3%. The USA Emissions Management Market is estimated to be valued at USD 2.7 billion in 2025 and is anticipated to reach a valuation of USD 4.9 billion by 2035. Sales are projected to rise at a CAGR of 6.1% over the forecast period between 2025 and 2035. While Japan and South Korea markets are estimated to be valued at USD 354.3 million and USD 235.2 million respectively in 2025.
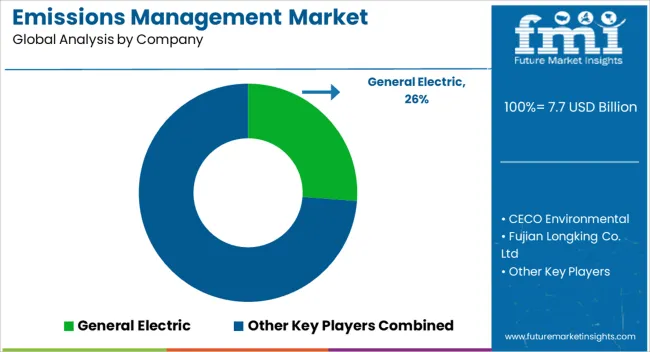
Key Players in the Emissions Management Market

Emissions Management Market Analysis By Company

  • General Electric
  • CECO Environmental
  • Fujian Longking Co. Ltd
  • Hamon Corporation
  • Ducon Technologies Inc.
  • Thermax Ltd
  • CONFORMiT
  • Accuvio Software
  • iSystain
  • Johnson Matthey
  • Intelex Technologies
  • Babcock & Wilcox Co. Enablon
  • AMEC Foster Wheeler (John Wood Group)
  • ERA Environmental
  • Mitsubishi Hitachi Power Systems Ltd.
  • Teck Resources

Scope of the Report

Item Value
Quantitative Units USD 7.7 Billion
Component Software, Hardware, and Services
Deployment On-Premise and Cloud
End-User Large Enterprisers and Small And Medium Enterprises
Vertical Oil & Gas, Food & Beverages, Power Generation, Chemical & Mining, Leather & Textile, Coal & Mining, and Others
Regions Covered North America, Europe, Asia-Pacific, Latin America, Middle East & Africa
Country Covered United States, Canada, Germany, France, United Kingdom, China, Japan, India, Brazil, South Africa
Key Companies Profiled General Electric, CECO Environmental, Fujian Longking Co. Ltd, Hamon Corporation, Ducon Technologies Inc., Thermax Ltd, CONFORMiT, Accuvio Software, iSystain, Johnson Matthey, Intelex Technologies, Babcock & Wilcox Co. Enablon, AMEC Foster Wheeler (John Wood Group), ERA Environmental, Mitsubishi Hitachi Power Systems Ltd., and Teck Resources

Emissions Management Market by Segments

Component:

  • Software
  • Hardware
  • Services

Deployment:

  • On-Premise
  • Cloud

End-User:

  • Large Enterprisers
  • Small And Medium Enterprises

Vertical:

  • Oil & Gas
  • Food & Beverages
  • Power Generation
  • Chemical & Mining
  • Leather & Textile
  • Coal & Mining
  • Others

Region:

  • North America
    • USA
    • Canada
    • Mexico
  • Latin America
    • Brazil
    • Chile
    • Rest of Latin America
  • Western Europe
    • Germany
    • UK
    • Italy
    • Spain
    • France
    • Nordic
    • BENELUX
    • Rest of Western Europe
  • Eastern Europe
    • Russia
    • Poland
    • Hungary
    • Balkan & Baltic
    • Rest of Eastern Europe
  • East Asia
    • China
    • Japan
    • South Korea
  • South Asia and Pacific
    • India
    • ASEAN
    • Australia & New Zealand
    • Rest of South Asia and Pacific
  • Middle East & Africa
    • Kingdom of Saudi Arabia
    • Other GCC Countries
    • Turkiye
    • South Africa
    • Other African Union
    • Rest of Middle East & Africa

Table of Content

  1. Executive Summary
    • Global Market Outlook
    • Demand-side Trends
    • Supply-side Trends
    • Technology Roadmap Analysis
    • Analysis and Recommendations
  2. Market Overview
    • Market Coverage / Taxonomy
    • Market Definition / Scope / Limitations
  3. Market Background
    • Market Dynamics
      • Drivers
      • Restraints
      • Opportunity
      • Trends
    • Scenario Forecast
      • Demand in Optimistic Scenario
      • Demand in Likely Scenario
      • Demand in Conservative Scenario
    • Opportunity Map Analysis
    • Product Life Cycle Analysis
    • Supply Chain Analysis
    • Investment Feasibility Matrix
    • Value Chain Analysis
    • PESTLE and Porter’s Analysis
    • Regulatory Landscape
    • Regional Parent Market Outlook
    • Production and Consumption Statistics
    • Import and Export Statistics
  4. Global Market Analysis 2020 to 2024 and Forecast, 2025 to 2035
    • Historical Market Size Value (USD Million) Analysis, 2020 to 2024
    • Current and Future Market Size Value (USD Million) Projections, 2025 to 2035
      • Y-o-Y Growth Trend Analysis
      • Absolute $ Opportunity Analysis
  5. Global Market Pricing Analysis 2020 to 2024 and Forecast 2025 to 2035
  6. Global Market Analysis 2020 to 2024 and Forecast 2025 to 2035, By Component
    • Introduction / Key Findings
    • Historical Market Size Value (USD Million) Analysis By Component , 2020 to 2024
    • Current and Future Market Size Value (USD Million) Analysis and Forecast By Component , 2025 to 2035
      • Software
      • Hardware
      • Services
    • Y-o-Y Growth Trend Analysis By Component , 2020 to 2024
    • Absolute $ Opportunity Analysis By Component , 2025 to 2035
  7. Global Market Analysis 2020 to 2024 and Forecast 2025 to 2035, By Deployment
    • Introduction / Key Findings
    • Historical Market Size Value (USD Million) Analysis By Deployment, 2020 to 2024
    • Current and Future Market Size Value (USD Million) Analysis and Forecast By Deployment, 2025 to 2035
      • On-Premise
      • Cloud
    • Y-o-Y Growth Trend Analysis By Deployment, 2020 to 2024
    • Absolute $ Opportunity Analysis By Deployment, 2025 to 2035
  8. Global Market Analysis 2020 to 2024 and Forecast 2025 to 2035, By End-User
    • Introduction / Key Findings
    • Historical Market Size Value (USD Million) Analysis By End-User, 2020 to 2024
    • Current and Future Market Size Value (USD Million) Analysis and Forecast By End-User, 2025 to 2035
      • Large Enterprisers
      • Small And Medium Enterprises
    • Y-o-Y Growth Trend Analysis By End-User, 2020 to 2024
    • Absolute $ Opportunity Analysis By End-User, 2025 to 2035
  9. Global Market Analysis 2020 to 2024 and Forecast 2025 to 2035, By Vertical
    • Introduction / Key Findings
    • Historical Market Size Value (USD Million) Analysis By Vertical, 2020 to 2024
    • Current and Future Market Size Value (USD Million) Analysis and Forecast By Vertical, 2025 to 2035
      • Oil & Gas
      • Food & Beverages
      • Power Generation
      • Chemical & Mining
      • Leather & Textile
      • Coal & Mining
      • Others
    • Y-o-Y Growth Trend Analysis By Vertical, 2020 to 2024
    • Absolute $ Opportunity Analysis By Vertical, 2025 to 2035
  10. Global Market Analysis 2020 to 2024 and Forecast 2025 to 2035, By Region
    • Introduction
    • Historical Market Size Value (USD Million) Analysis By Region, 2020 to 2024
    • Current Market Size Value (USD Million) Analysis and Forecast By Region, 2025 to 2035
      • North America
      • Latin America
      • Western Europe
      • Eastern Europe
      • East Asia
      • South Asia and Pacific
      • Middle East & Africa
    • Market Attractiveness Analysis By Region
  11. North America Market Analysis 2020 to 2024 and Forecast 2025 to 2035, By Country
    • Historical Market Size Value (USD Million) Trend Analysis By Market Taxonomy, 2020 to 2024
    • Market Size Value (USD Million) Forecast By Market Taxonomy, 2025 to 2035
      • By Country
        • USA
        • Canada
        • Mexico
      • By Component
      • By Deployment
      • By End-User
      • By Vertical
    • Market Attractiveness Analysis
      • By Country
      • By Component
      • By Deployment
      • By End-User
      • By Vertical
    • Key Takeaways
  12. Latin America Market Analysis 2020 to 2024 and Forecast 2025 to 2035, By Country
    • Historical Market Size Value (USD Million) Trend Analysis By Market Taxonomy, 2020 to 2024
    • Market Size Value (USD Million) Forecast By Market Taxonomy, 2025 to 2035
      • By Country
        • Brazil
        • Chile
        • Rest of Latin America
      • By Component
      • By Deployment
      • By End-User
      • By Vertical
    • Market Attractiveness Analysis
      • By Country
      • By Component
      • By Deployment
      • By End-User
      • By Vertical
    • Key Takeaways
  13. Western Europe Market Analysis 2020 to 2024 and Forecast 2025 to 2035, By Country
    • Historical Market Size Value (USD Million) Trend Analysis By Market Taxonomy, 2020 to 2024
    • Market Size Value (USD Million) Forecast By Market Taxonomy, 2025 to 2035
      • By Country
        • Germany
        • UK
        • Italy
        • Spain
        • France
        • Nordic
        • BENELUX
        • Rest of Western Europe
      • By Component
      • By Deployment
      • By End-User
      • By Vertical
    • Market Attractiveness Analysis
      • By Country
      • By Component
      • By Deployment
      • By End-User
      • By Vertical
    • Key Takeaways
  14. Eastern Europe Market Analysis 2020 to 2024 and Forecast 2025 to 2035, By Country
    • Historical Market Size Value (USD Million) Trend Analysis By Market Taxonomy, 2020 to 2024
    • Market Size Value (USD Million) Forecast By Market Taxonomy, 2025 to 2035
      • By Country
        • Russia
        • Poland
        • Hungary
        • Balkan & Baltic
        • Rest of Eastern Europe
      • By Component
      • By Deployment
      • By End-User
      • By Vertical
    • Market Attractiveness Analysis
      • By Country
      • By Component
      • By Deployment
      • By End-User
      • By Vertical
    • Key Takeaways
  15. East Asia Market Analysis 2020 to 2024 and Forecast 2025 to 2035, By Country
    • Historical Market Size Value (USD Million) Trend Analysis By Market Taxonomy, 2020 to 2024
    • Market Size Value (USD Million) Forecast By Market Taxonomy, 2025 to 2035
      • By Country
        • China
        • Japan
        • South Korea
      • By Component
      • By Deployment
      • By End-User
      • By Vertical
    • Market Attractiveness Analysis
      • By Country
      • By Component
      • By Deployment
      • By End-User
      • By Vertical
    • Key Takeaways
  16. South Asia and Pacific Market Analysis 2020 to 2024 and Forecast 2025 to 2035, By Country
    • Historical Market Size Value (USD Million) Trend Analysis By Market Taxonomy, 2020 to 2024
    • Market Size Value (USD Million) Forecast By Market Taxonomy, 2025 to 2035
      • By Country
        • India
        • ASEAN
        • Australia & New Zealand
        • Rest of South Asia and Pacific
      • By Component
      • By Deployment
      • By End-User
      • By Vertical
    • Market Attractiveness Analysis
      • By Country
      • By Component
      • By Deployment
      • By End-User
      • By Vertical
    • Key Takeaways
  17. Middle East & Africa Market Analysis 2020 to 2024 and Forecast 2025 to 2035, By Country
    • Historical Market Size Value (USD Million) Trend Analysis By Market Taxonomy, 2020 to 2024
    • Market Size Value (USD Million) Forecast By Market Taxonomy, 2025 to 2035
      • By Country
        • Kingdom of Saudi Arabia
        • Other GCC Countries
        • Turkiye
        • South Africa
        • Other African Union
        • Rest of Middle East & Africa
      • By Component
      • By Deployment
      • By End-User
      • By Vertical
    • Market Attractiveness Analysis
      • By Country
      • By Component
      • By Deployment
      • By End-User
      • By Vertical
    • Key Takeaways
  18. Key Countries Market Analysis
    • USA
      • Pricing Analysis
      • Market Share Analysis, 2024
        • By Component
        • By Deployment
        • By End-User
        • By Vertical
    • Canada
      • Pricing Analysis
      • Market Share Analysis, 2024
        • By Component
        • By Deployment
        • By End-User
        • By Vertical
    • Mexico
      • Pricing Analysis
      • Market Share Analysis, 2024
        • By Component
        • By Deployment
        • By End-User
        • By Vertical
    • Brazil
      • Pricing Analysis
      • Market Share Analysis, 2024
        • By Component
        • By Deployment
        • By End-User
        • By Vertical
    • Chile
      • Pricing Analysis
      • Market Share Analysis, 2024
        • By Component
        • By Deployment
        • By End-User
        • By Vertical
    • Germany
      • Pricing Analysis
      • Market Share Analysis, 2024
        • By Component
        • By Deployment
        • By End-User
        • By Vertical
    • UK
      • Pricing Analysis
      • Market Share Analysis, 2024
        • By Component
        • By Deployment
        • By End-User
        • By Vertical
    • Italy
      • Pricing Analysis
      • Market Share Analysis, 2024
        • By Component
        • By Deployment
        • By End-User
        • By Vertical
    • Spain
      • Pricing Analysis
      • Market Share Analysis, 2024
        • By Component
        • By Deployment
        • By End-User
        • By Vertical
    • France
      • Pricing Analysis
      • Market Share Analysis, 2024
        • By Component
        • By Deployment
        • By End-User
        • By Vertical
    • India
      • Pricing Analysis
      • Market Share Analysis, 2024
        • By Component
        • By Deployment
        • By End-User
        • By Vertical
    • ASEAN
      • Pricing Analysis
      • Market Share Analysis, 2024
        • By Component
        • By Deployment
        • By End-User
        • By Vertical
    • Australia & New Zealand
      • Pricing Analysis
      • Market Share Analysis, 2024
        • By Component
        • By Deployment
        • By End-User
        • By Vertical
    • China
      • Pricing Analysis
      • Market Share Analysis, 2024
        • By Component
        • By Deployment
        • By End-User
        • By Vertical
    • Japan
      • Pricing Analysis
      • Market Share Analysis, 2024
        • By Component
        • By Deployment
        • By End-User
        • By Vertical
    • South Korea
      • Pricing Analysis
      • Market Share Analysis, 2024
        • By Component
        • By Deployment
        • By End-User
        • By Vertical
    • Russia
      • Pricing Analysis
      • Market Share Analysis, 2024
        • By Component
        • By Deployment
        • By End-User
        • By Vertical
    • Poland
      • Pricing Analysis
      • Market Share Analysis, 2024
        • By Component
        • By Deployment
        • By End-User
        • By Vertical
    • Hungary
      • Pricing Analysis
      • Market Share Analysis, 2024
        • By Component
        • By Deployment
        • By End-User
        • By Vertical
    • Kingdom of Saudi Arabia
      • Pricing Analysis
      • Market Share Analysis, 2024
        • By Component
        • By Deployment
        • By End-User
        • By Vertical
    • Turkiye
      • Pricing Analysis
      • Market Share Analysis, 2024
        • By Component
        • By Deployment
        • By End-User
        • By Vertical
    • South Africa
      • Pricing Analysis
      • Market Share Analysis, 2024
        • By Component
        • By Deployment
        • By End-User
        • By Vertical
  19. Market Structure Analysis
    • Competition Dashboard
    • Competition Benchmarking
    • Market Share Analysis of Top Players
      • By Regional
      • By Component
      • By Deployment
      • By End-User
      • By Vertical
  20. Competition Analysis
    • Competition Deep Dive
      • General Electric
        • Overview
        • Product Portfolio
        • Profitability by Market Segments (Product/Age /Sales Channel/Region)
        • Sales Footprint
        • Strategy Overview
          • Marketing Strategy
          • Product Strategy
          • Channel Strategy
      • CECO Environmental
      • Fujian Longking Co. Ltd
      • Hamon Corporation
      • Ducon Technologies Inc.
      • Thermax Ltd
      • CONFORMiT
      • Accuvio Software
      • iSystain
      • Johnson Matthey
      • Intelex Technologies
      • Babcock & Wilcox Co. Enablon
      • AMEC Foster Wheeler (John Wood Group)
      • ERA Environmental
      • Mitsubishi Hitachi Power Systems Ltd.
      • Teck Resources
  21. Assumptions & Acronyms Used
  22. Research Methodology

List of Tables

  • Table 1: Global Market Value (USD Million) Forecast by Region, 2020 to 2035
  • Table 2: Global Market Value (USD Million) Forecast by Component , 2020 to 2035
  • Table 3: Global Market Value (USD Million) Forecast by Deployment, 2020 to 2035
  • Table 4: Global Market Value (USD Million) Forecast by End-User, 2020 to 2035
  • Table 5: Global Market Value (USD Million) Forecast by Vertical, 2020 to 2035
  • Table 6: North America Market Value (USD Million) Forecast by Country, 2020 to 2035
  • Table 7: North America Market Value (USD Million) Forecast by Component , 2020 to 2035
  • Table 8: North America Market Value (USD Million) Forecast by Deployment, 2020 to 2035
  • Table 9: North America Market Value (USD Million) Forecast by End-User, 2020 to 2035
  • Table 10: North America Market Value (USD Million) Forecast by Vertical, 2020 to 2035
  • Table 11: Latin America Market Value (USD Million) Forecast by Country, 2020 to 2035
  • Table 12: Latin America Market Value (USD Million) Forecast by Component , 2020 to 2035
  • Table 13: Latin America Market Value (USD Million) Forecast by Deployment, 2020 to 2035
  • Table 14: Latin America Market Value (USD Million) Forecast by End-User, 2020 to 2035
  • Table 15: Latin America Market Value (USD Million) Forecast by Vertical, 2020 to 2035
  • Table 16: Western Europe Market Value (USD Million) Forecast by Country, 2020 to 2035
  • Table 17: Western Europe Market Value (USD Million) Forecast by Component , 2020 to 2035
  • Table 18: Western Europe Market Value (USD Million) Forecast by Deployment, 2020 to 2035
  • Table 19: Western Europe Market Value (USD Million) Forecast by End-User, 2020 to 2035
  • Table 20: Western Europe Market Value (USD Million) Forecast by Vertical, 2020 to 2035
  • Table 21: Eastern Europe Market Value (USD Million) Forecast by Country, 2020 to 2035
  • Table 22: Eastern Europe Market Value (USD Million) Forecast by Component , 2020 to 2035
  • Table 23: Eastern Europe Market Value (USD Million) Forecast by Deployment, 2020 to 2035
  • Table 24: Eastern Europe Market Value (USD Million) Forecast by End-User, 2020 to 2035
  • Table 25: Eastern Europe Market Value (USD Million) Forecast by Vertical, 2020 to 2035
  • Table 26: East Asia Market Value (USD Million) Forecast by Country, 2020 to 2035
  • Table 27: East Asia Market Value (USD Million) Forecast by Component , 2020 to 2035
  • Table 28: East Asia Market Value (USD Million) Forecast by Deployment, 2020 to 2035
  • Table 29: East Asia Market Value (USD Million) Forecast by End-User, 2020 to 2035
  • Table 30: East Asia Market Value (USD Million) Forecast by Vertical, 2020 to 2035
  • Table 31: South Asia and Pacific Market Value (USD Million) Forecast by Country, 2020 to 2035
  • Table 32: South Asia and Pacific Market Value (USD Million) Forecast by Component , 2020 to 2035
  • Table 33: South Asia and Pacific Market Value (USD Million) Forecast by Deployment, 2020 to 2035
  • Table 34: South Asia and Pacific Market Value (USD Million) Forecast by End-User, 2020 to 2035
  • Table 35: South Asia and Pacific Market Value (USD Million) Forecast by Vertical, 2020 to 2035
  • Table 36: Middle East & Africa Market Value (USD Million) Forecast by Country, 2020 to 2035
  • Table 37: Middle East & Africa Market Value (USD Million) Forecast by Component , 2020 to 2035
  • Table 38: Middle East & Africa Market Value (USD Million) Forecast by Deployment, 2020 to 2035
  • Table 39: Middle East & Africa Market Value (USD Million) Forecast by End-User, 2020 to 2035
  • Table 40: Middle East & Africa Market Value (USD Million) Forecast by Vertical, 2020 to 2035

List of Figures

  • Figure 1: Global Market Pricing Analysis
  • Figure 2: Global Market Value (USD Million) Forecast 2020-2035
  • Figure 3: Global Market Value Share and BPS Analysis by Component , 2025 and 2035
  • Figure 4: Global Market Y-o-Y Growth Comparison by Component , 2025-2035
  • Figure 5: Global Market Attractiveness Analysis by Component
  • Figure 6: Global Market Value Share and BPS Analysis by Deployment, 2025 and 2035
  • Figure 7: Global Market Y-o-Y Growth Comparison by Deployment, 2025-2035
  • Figure 8: Global Market Attractiveness Analysis by Deployment
  • Figure 9: Global Market Value Share and BPS Analysis by End-User, 2025 and 2035
  • Figure 10: Global Market Y-o-Y Growth Comparison by End-User, 2025-2035
  • Figure 11: Global Market Attractiveness Analysis by End-User
  • Figure 12: Global Market Value Share and BPS Analysis by Vertical, 2025 and 2035
  • Figure 13: Global Market Y-o-Y Growth Comparison by Vertical, 2025-2035
  • Figure 14: Global Market Attractiveness Analysis by Vertical
  • Figure 15: Global Market Value (USD Million) Share and BPS Analysis by Region, 2025 and 2035
  • Figure 16: Global Market Y-o-Y Growth Comparison by Region, 2025-2035
  • Figure 17: Global Market Attractiveness Analysis by Region
  • Figure 18: North America Market Incremental Dollar Opportunity, 2025-2035
  • Figure 19: Latin America Market Incremental Dollar Opportunity, 2025-2035
  • Figure 20: Western Europe Market Incremental Dollar Opportunity, 2025-2035
  • Figure 21: Eastern Europe Market Incremental Dollar Opportunity, 2025-2035
  • Figure 22: East Asia Market Incremental Dollar Opportunity, 2025-2035
  • Figure 23: South Asia and Pacific Market Incremental Dollar Opportunity, 2025-2035
  • Figure 24: Middle East & Africa Market Incremental Dollar Opportunity, 2025-2035
  • Figure 25: North America Market Value Share and BPS Analysis by Country, 2025 and 2035
  • Figure 26: North America Market Value Share and BPS Analysis by Component , 2025 and 2035
  • Figure 27: North America Market Y-o-Y Growth Comparison by Component , 2025-2035
  • Figure 28: North America Market Attractiveness Analysis by Component
  • Figure 29: North America Market Value Share and BPS Analysis by Deployment, 2025 and 2035
  • Figure 30: North America Market Y-o-Y Growth Comparison by Deployment, 2025-2035
  • Figure 31: North America Market Attractiveness Analysis by Deployment
  • Figure 32: North America Market Value Share and BPS Analysis by End-User, 2025 and 2035
  • Figure 33: North America Market Y-o-Y Growth Comparison by End-User, 2025-2035
  • Figure 34: North America Market Attractiveness Analysis by End-User
  • Figure 35: North America Market Value Share and BPS Analysis by Vertical, 2025 and 2035
  • Figure 36: North America Market Y-o-Y Growth Comparison by Vertical, 2025-2035
  • Figure 37: North America Market Attractiveness Analysis by Vertical
  • Figure 38: Latin America Market Value Share and BPS Analysis by Country, 2025 and 2035
  • Figure 39: Latin America Market Value Share and BPS Analysis by Component , 2025 and 2035
  • Figure 40: Latin America Market Y-o-Y Growth Comparison by Component , 2025-2035
  • Figure 41: Latin America Market Attractiveness Analysis by Component
  • Figure 42: Latin America Market Value Share and BPS Analysis by Deployment, 2025 and 2035
  • Figure 43: Latin America Market Y-o-Y Growth Comparison by Deployment, 2025-2035
  • Figure 44: Latin America Market Attractiveness Analysis by Deployment
  • Figure 45: Latin America Market Value Share and BPS Analysis by End-User, 2025 and 2035
  • Figure 46: Latin America Market Y-o-Y Growth Comparison by End-User, 2025-2035
  • Figure 47: Latin America Market Attractiveness Analysis by End-User
  • Figure 48: Latin America Market Value Share and BPS Analysis by Vertical, 2025 and 2035
  • Figure 49: Latin America Market Y-o-Y Growth Comparison by Vertical, 2025-2035
  • Figure 50: Latin America Market Attractiveness Analysis by Vertical
  • Figure 51: Western Europe Market Value Share and BPS Analysis by Country, 2025 and 2035
  • Figure 52: Western Europe Market Value Share and BPS Analysis by Component , 2025 and 2035
  • Figure 53: Western Europe Market Y-o-Y Growth Comparison by Component , 2025-2035
  • Figure 54: Western Europe Market Attractiveness Analysis by Component
  • Figure 55: Western Europe Market Value Share and BPS Analysis by Deployment, 2025 and 2035
  • Figure 56: Western Europe Market Y-o-Y Growth Comparison by Deployment, 2025-2035
  • Figure 57: Western Europe Market Attractiveness Analysis by Deployment
  • Figure 58: Western Europe Market Value Share and BPS Analysis by End-User, 2025 and 2035
  • Figure 59: Western Europe Market Y-o-Y Growth Comparison by End-User, 2025-2035
  • Figure 60: Western Europe Market Attractiveness Analysis by End-User
  • Figure 61: Western Europe Market Value Share and BPS Analysis by Vertical, 2025 and 2035
  • Figure 62: Western Europe Market Y-o-Y Growth Comparison by Vertical, 2025-2035
  • Figure 63: Western Europe Market Attractiveness Analysis by Vertical
  • Figure 64: Eastern Europe Market Value Share and BPS Analysis by Country, 2025 and 2035
  • Figure 65: Eastern Europe Market Value Share and BPS Analysis by Component , 2025 and 2035
  • Figure 66: Eastern Europe Market Y-o-Y Growth Comparison by Component , 2025-2035
  • Figure 67: Eastern Europe Market Attractiveness Analysis by Component
  • Figure 68: Eastern Europe Market Value Share and BPS Analysis by Deployment, 2025 and 2035
  • Figure 69: Eastern Europe Market Y-o-Y Growth Comparison by Deployment, 2025-2035
  • Figure 70: Eastern Europe Market Attractiveness Analysis by Deployment
  • Figure 71: Eastern Europe Market Value Share and BPS Analysis by End-User, 2025 and 2035
  • Figure 72: Eastern Europe Market Y-o-Y Growth Comparison by End-User, 2025-2035
  • Figure 73: Eastern Europe Market Attractiveness Analysis by End-User
  • Figure 74: Eastern Europe Market Value Share and BPS Analysis by Vertical, 2025 and 2035
  • Figure 75: Eastern Europe Market Y-o-Y Growth Comparison by Vertical, 2025-2035
  • Figure 76: Eastern Europe Market Attractiveness Analysis by Vertical
  • Figure 77: East Asia Market Value Share and BPS Analysis by Country, 2025 and 2035
  • Figure 78: East Asia Market Value Share and BPS Analysis by Component , 2025 and 2035
  • Figure 79: East Asia Market Y-o-Y Growth Comparison by Component , 2025-2035
  • Figure 80: East Asia Market Attractiveness Analysis by Component
  • Figure 81: East Asia Market Value Share and BPS Analysis by Deployment, 2025 and 2035
  • Figure 82: East Asia Market Y-o-Y Growth Comparison by Deployment, 2025-2035
  • Figure 83: East Asia Market Attractiveness Analysis by Deployment
  • Figure 84: East Asia Market Value Share and BPS Analysis by End-User, 2025 and 2035
  • Figure 85: East Asia Market Y-o-Y Growth Comparison by End-User, 2025-2035
  • Figure 86: East Asia Market Attractiveness Analysis by End-User
  • Figure 87: East Asia Market Value Share and BPS Analysis by Vertical, 2025 and 2035
  • Figure 88: East Asia Market Y-o-Y Growth Comparison by Vertical, 2025-2035
  • Figure 89: East Asia Market Attractiveness Analysis by Vertical
  • Figure 90: South Asia and Pacific Market Value Share and BPS Analysis by Country, 2025 and 2035
  • Figure 91: South Asia and Pacific Market Value Share and BPS Analysis by Component , 2025 and 2035
  • Figure 92: South Asia and Pacific Market Y-o-Y Growth Comparison by Component , 2025-2035
  • Figure 93: South Asia and Pacific Market Attractiveness Analysis by Component
  • Figure 94: South Asia and Pacific Market Value Share and BPS Analysis by Deployment, 2025 and 2035
  • Figure 95: South Asia and Pacific Market Y-o-Y Growth Comparison by Deployment, 2025-2035
  • Figure 96: South Asia and Pacific Market Attractiveness Analysis by Deployment
  • Figure 97: South Asia and Pacific Market Value Share and BPS Analysis by End-User, 2025 and 2035
  • Figure 98: South Asia and Pacific Market Y-o-Y Growth Comparison by End-User, 2025-2035
  • Figure 99: South Asia and Pacific Market Attractiveness Analysis by End-User
  • Figure 100: South Asia and Pacific Market Value Share and BPS Analysis by Vertical, 2025 and 2035
  • Figure 101: South Asia and Pacific Market Y-o-Y Growth Comparison by Vertical, 2025-2035
  • Figure 102: South Asia and Pacific Market Attractiveness Analysis by Vertical
  • Figure 103: Middle East & Africa Market Value Share and BPS Analysis by Country, 2025 and 2035
  • Figure 104: Middle East & Africa Market Value Share and BPS Analysis by Component , 2025 and 2035
  • Figure 105: Middle East & Africa Market Y-o-Y Growth Comparison by Component , 2025-2035
  • Figure 106: Middle East & Africa Market Attractiveness Analysis by Component
  • Figure 107: Middle East & Africa Market Value Share and BPS Analysis by Deployment, 2025 and 2035
  • Figure 108: Middle East & Africa Market Y-o-Y Growth Comparison by Deployment, 2025-2035
  • Figure 109: Middle East & Africa Market Attractiveness Analysis by Deployment
  • Figure 110: Middle East & Africa Market Value Share and BPS Analysis by End-User, 2025 and 2035
  • Figure 111: Middle East & Africa Market Y-o-Y Growth Comparison by End-User, 2025-2035
  • Figure 112: Middle East & Africa Market Attractiveness Analysis by End-User
  • Figure 113: Middle East & Africa Market Value Share and BPS Analysis by Vertical, 2025 and 2035
  • Figure 114: Middle East & Africa Market Y-o-Y Growth Comparison by Vertical, 2025-2035
  • Figure 115: Middle East & Africa Market Attractiveness Analysis by Vertical
  • Figure 116: Global Market - Tier Structure Analysis
  • Figure 117: Global Market - Company Share Analysis

Frequently Asked Questions

How big is the emissions management market in 2025?

The global emissions management market is estimated to be valued at USD 7.7 billion in 2025.

What will be the size of emissions management market in 2035?

The market size for the emissions management market is projected to reach USD 15.5 billion by 2035.

How much will be the emissions management market growth between 2025 and 2035?

The emissions management market is expected to grow at a 7.2% CAGR between 2025 and 2035.

What are the key product types in the emissions management market?

The key product types in emissions management market are software, hardware and services.

Which deployment segment to contribute significant share in the emissions management market in 2025?

In terms of deployment, on-premise segment to command 50.0% share in the emissions management market in 2025.

Explore Similar Insights

Future Market Insights

Emissions Management Market

Chat With MaRIA

Chat With

MaRIA

Hi There, I am MaRIA, Your Market Research Intelligence Assistant. How may I help you?