The waste management carbon credit market is expected to grow from USD 14.7 billion in 2025 to USD 64.4 billion by 2035, reflecting a 15.9% CAGR and generating an absolute dollar opportunity of USD 49.7 billion. Growth is driven by increasing regulatory pressure on carbon emissions, corporate commitments to net-zero targets, and the expansion of waste-to-energy and recycling initiatives. Carbon credits derived from waste management projects provide financial incentives for reducing greenhouse gas emissions, promoting investment in advanced treatment, landfill gas capture, and circular economy initiatives. Rising participation from emerging markets and adoption by multinational corporations further support market expansion. The elasticity of growth versus macroeconomic indicators highlights the market's sensitivity to broader economic conditions. During periods of economic expansion, industrial activity, urbanization, and waste generation increase, leading to higher demand for carbon credit generation projects and trading.
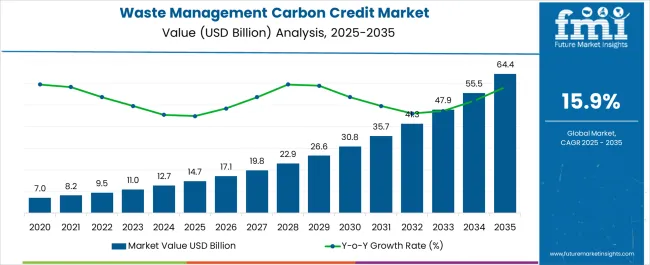 Conversely, during economic slowdowns or recessions, industrial activity may contract, reducing immediate demand for carbon credits, although regulatory compliance requirements help mitigate extreme fluctuations. Policy interventions, such as carbon pricing mechanisms and government incentives, also influence elasticity by stabilizing market growth even during periods of weaker macroeconomic conditions. Regional elasticity varies, with Europe and North America exhibiting moderate responsiveness due to their mature regulatory frameworks. Asia Pacific and Latin America demonstrate higher elasticity, reflecting rapid industrialization and increasing participation in carbon markets. The USD 49.7 billion opportunity underscores the strong growth potential of waste management carbon credits, with expansion closely tied to economic trends and regulatory enforcement.
| Metric | Value |
|---|---|
| Waste Management Carbon Credit Market Estimated Value in (2025 E) | USD 14.7 billion |
| Waste Management Carbon Credit Market Forecast Value in (2035 F) | USD 64.4 billion |
| Forecast CAGR (2025 to 2035) | 15.9% |
The waste management carbon credit market is driven by five primary parent markets with specific shares. Municipal solid waste management leads with 35%, as emissions reductions from landfills and waste-to-energy projects generate tradable carbon credits. Industrial waste contributes 25%, where companies capture methane and reduce greenhouse gas emissions from manufacturing and processing facilities. Agriculture and organic waste account for 15%, leveraging composting and anaerobic digestion to minimize emissions. Recycling and material recovery represent 15%, producing credits through reduced landfill usage and energy savings. Renewable energy from waste holds 10%, supporting bioenergy projects that offset carbon emissions.
These segments collectively shape global demand for carbon credits. Recent developments in the waste management carbon credit market focus on sustainability, verification, and digitalization. Companies are implementing advanced methane capture, anaerobic digestion, and waste-to-energy technologies to increase credit generation. Blockchain and digital tracking platforms are enhancing transparency, verification, and trading efficiency of carbon credits. Strategic partnerships between municipalities, private firms, and environmental organizations are expanding project scale and market participation. Regulatory incentives, voluntary carbon markets, and corporate net-zero commitments are driving adoption. These trends are promoting innovation, improving environmental impact, and supporting the growth of the waste management carbon credit market globally.
The waste management carbon credit market is expanding rapidly, driven by increasing global emphasis on climate change mitigation and the monetization of emission reduction activities. Carbon credits generated from waste management projects, such as landfill gas capture, waste-to-energy conversion, and advanced recycling, are gaining recognition in both compliance and voluntary markets.
The current scenario reflects strong participation from corporate buyers seeking to offset emissions and meet sustainability targets, alongside growing interest from governments in incentivizing waste sector decarbonization. Rising carbon credit prices, stricter environmental regulations, and expanding verification standards are further bolstering market growth.
The integration of digital monitoring and blockchain-based tracking systems is enhancing transparency and market confidence. Looking ahead, the market is expected to gain further traction as circular economy initiatives and waste-to-value strategies become central to climate action frameworks.
The waste management carbon credit market is segmented by type, and geographic regions. By type, waste management carbon credit market is divided into Voluntary and Compliance. Regionally, the waste management carbon credit industry is classified into North America, Latin America, Western Europe, Eastern Europe, Balkan & Baltic Countries, Russia & Belarus, Central Asia, East Asia, South Asia & Pacific, and the Middle East & Africa.
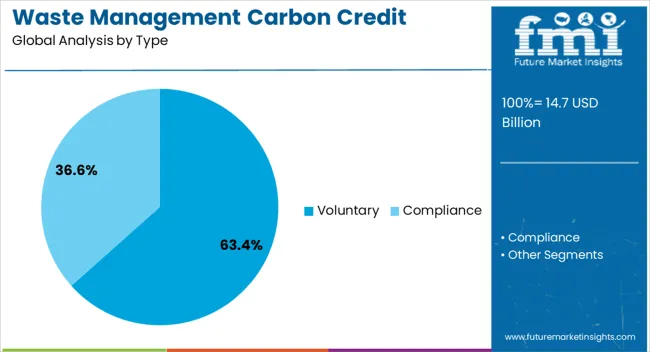
The voluntary segment leads the type category, accounting for approximately 63.4% share of the waste management carbon credit market. This dominance is fueled by increasing participation from private companies, NGOs, and individuals in purchasing credits beyond regulatory requirements.
The segment benefits from its flexibility, allowing buyers to select projects that align with corporate sustainability strategies or brand values. Voluntary credits from waste management projects are particularly attractive due to their tangible environmental and community benefits, enhancing reputational value for purchasers.
Growing consumer awareness of corporate climate commitments and the emergence of premium credit categories, such as those with social co-benefits, are expected to further support the voluntary segment’s growth trajectory.
The waste management carbon credit market is growing as governments and corporations target greenhouse gas reduction and carbon neutrality. Asia Pacific holds approximately 35% of demand, driven by landfill gas capture and biogas projects in China, India, and Southeast Asia. North America emphasizes industrial and municipal waste-to-energy initiatives, while Europe focuses on landfill diversion and organic waste processing. Carbon credits provide monetization opportunities for reducing methane and CO2 emissions. Increasing regulatory compliance, voluntary carbon offset programs, and corporate sustainability commitments are driving adoption across municipal, industrial, and commercial waste sectors globally.
Government regulations and corporate sustainability mandates are key drivers of the waste management carbon credit market. North America and Europe implement strict emissions reduction targets for municipal and industrial operations, encouraging landfill gas capture, anaerobic digestion, and waste-to-energy projects. Asia Pacific is expanding waste management infrastructure, with carbon credit incentives promoting methane reduction and energy recovery. Corporations are leveraging carbon credits to meet voluntary and compliance-based sustainability targets, including Scope 1 and Scope 2 emissions. Innovative technologies such as biogas upgrading and advanced composting systems enable higher credit generation. Rising awareness of environmental responsibility and financial incentives for carbon mitigation are driving global market adoption.
Asia Pacific countries are investing in municipal solid waste-to-energy plants and biogas projects, generating carbon credits while addressing energy needs. Europe emphasizes organic waste composting, anaerobic digestion, and landfill diversion initiatives for carbon credit generation. North America is expanding food waste management programs and industrial waste treatment projects integrated with energy recovery systems. Emerging markets in Latin America and the Middle East offer untapped potential for generating tradable credits. Companies providing technology solutions, monitoring services, and certification for carbon offset projects are positioned to capture expanding opportunities in global waste management sectors.
Trends in the market include digital verification, blockchain-enabled carbon credit tracking, and integration with smart waste management systems. IoT-enabled sensors monitor landfill gas emissions, composting conditions, and anaerobic digestion performance, ensuring accurate carbon credit reporting. Blockchain technology enhances transparency, traceability, and trust in credit transactions, particularly in voluntary markets. Asia Pacific is adopting real-time monitoring systems for large-scale waste-to-energy projects, while Europe and North America emphasize third-party verification and standardization. Integration with smart city and smart grid infrastructure allows utilities and municipalities to optimize waste collection, energy recovery, and credit generation. These trends are increasing operational efficiency and market credibility globally.
The market faces restraints due to the high costs of project certification, monitoring, and verification. Establishing carbon credit eligibility requires detailed emissions tracking, audits, and third-party validation, which can be expensive for smaller municipalities and private operators. Variations in regional regulatory frameworks, accounting standards, and credit pricing mechanisms create uncertainty for project developers. In emerging economies, limited technical expertise and infrastructure gaps slow project deployment. Market players must invest in cost-efficient monitoring systems, standardized protocols, and advisory services to mitigate these challenges and expand carbon credit generation across municipal, industrial, and commercial waste management projects globally.
| Countries | CAGR |
|---|---|
| China | 21.5% |
| India | 19.9% |
| Germany | 18.3% |
| France | 16.7% |
| UK | 15.1% |
| USA | 13.5% |
| Brazil | 11.9% |
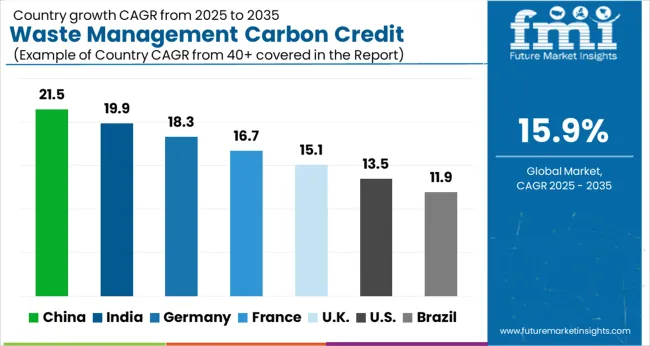
The waste management carbon credit market is projected to grow at a global CAGR of 15.9%, driven by increased focus on carbon reduction, sustainable waste handling, and regulatory support for emission trading. China leads with 21.5%, a 1.35× multiple of the global benchmark, fueled by BRICS-driven industrial emissions management, waste-to-energy initiatives, and government-backed carbon credit programs. India follows at 19.9%, a 1.25× multiple, reflecting rising industrial activity, municipal waste management projects, and renewable energy adoption. Germany records 18.3%, a 1.15× multiple, shaped by OECD-focused environmental regulations, emission trading schemes, and advanced recycling technologies.
The United Kingdom posts 15.1%, slightly below the global rate, supported by regulatory incentives and commercial carbon offset programs. The United States stands at 13.5%, 0.85× the benchmark, with adoption concentrated in industrial sectors and corporate carbon management initiatives. BRICS nations drive volume expansion, OECD countries prioritize efficiency and compliance, and ASEAN contributes through growing waste management infrastructure. This report includes insights on 40+ countries; the top markets are shown here for reference.
The waste management carbon credit market in China is projected to grow at a CAGR of 21.5%, driven by government policies promoting carbon neutrality, industrial emission reductions, and sustainable waste treatment initiatives. Key players such as China Everbright International, Beijing Capital Environmental Protection, and Suez are supplying carbon credit services linked to landfill gas recovery, waste-to-energy, and recycling projects. Adoption is concentrated in urban municipal waste management, industrial waste treatment, and large-scale recycling facilities. Technological trends include advanced biogas recovery, methane capture, and smart monitoring systems for emissions reduction. Regulatory incentives, combined with corporate carbon reduction targets, reinforce the growth of carbon credit trading and associated waste management projects.
The waste management carbon credit market in India is expected to grow at a CAGR of 19.9%, supported by increasing municipal solid waste generation, industrial waste management initiatives, and government-backed carbon trading programs. Leading providers including Ramky Enviro Engineers, IL&FS Environmental, and Thermax supply carbon credit solutions from landfill gas capture, waste-to-energy, and recycling projects. Adoption is concentrated in urban centers, industrial hubs, and large-scale waste processing plants. Technological trends include methane capture, energy-efficient waste-to-energy systems, and smart monitoring platforms. Policies encouraging carbon trading, renewable energy integration, and emissions reduction targets further boost market adoption across India.
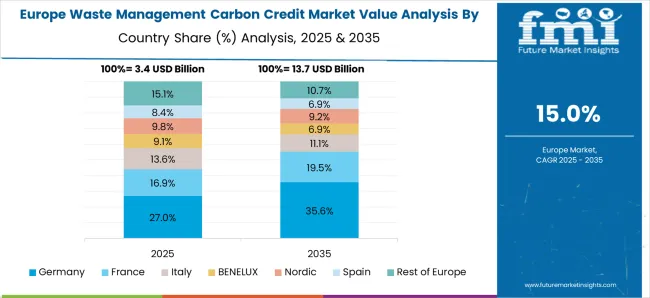
The waste management carbon credit market in Germany is projected to grow at a CAGR of 18.3%, driven by stringent emission regulations, circular economy initiatives, and advanced waste treatment infrastructure. Companies such as Veolia, Remondis, and SUEZ are providing carbon credit solutions linked to biogas recovery, recycling, and waste-to-energy projects. Adoption is concentrated in industrial waste, municipal waste, and large-scale recycling facilities. Technological trends include methane capture, anaerobic digestion, and smart emissions monitoring systems. Government policies supporting emissions reduction, renewable energy, and carbon credit trading reinforce adoption, while industrial and municipal efforts to meet sustainability targets strengthen market growth.
The waste management carbon credit market in the United Kingdom is expected to grow at a CAGR of 15.1%, supported by landfill diversion policies, renewable energy initiatives, and government-backed carbon trading programs. Suppliers including Veolia, Biffa, and SUEZ provide carbon credit services through methane capture, waste-to-energy, and recycling projects. Adoption is concentrated in municipal solid waste management, industrial waste, and energy-from-waste facilities. Technological trends include smart monitoring, anaerobic digestion, and emissions capture systems. Policies promoting carbon neutrality, renewable energy integration, and emissions reduction targets accelerate growth, while increasing demand for carbon credit trading strengthens adoption.
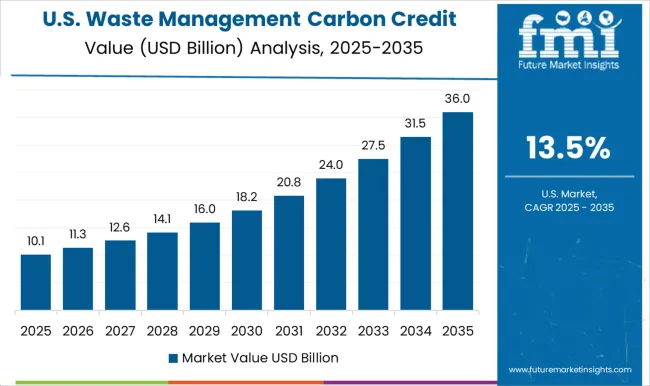
The waste management carbon credit market in the United States is projected to grow at a CAGR of 13.5%, driven by industrial emissions reduction programs, landfill gas capture, and renewable energy initiatives. Leading providers such as Waste Management Inc., Covanta, and Veolia offer carbon credit solutions through biogas recovery, anaerobic digestion, and energy-from-waste projects. Adoption is concentrated in municipal and industrial waste treatment facilities. Technological trends include smart monitoring, methane capture, and waste-to-energy systems. Federal and state policies supporting carbon credit trading, renewable energy, and emissions reduction targets encourage market growth, while increasing industrial and municipal participation reinforces demand.
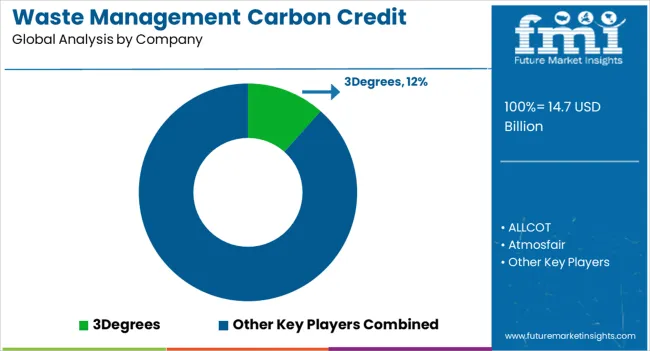
Competition in the waste management carbon credit market is driven by global sustainability consultancies, project developers, and certification providers, focusing on verified emissions reductions, transparency, and compliance. South Pole, 3Degrees, and Climate Impact Partners lead with extensive project portfolios, emphasizing waste-to-energy, landfill gas, and recycling initiatives in their brochures. ALLCOT, Atmosfair, and CarbonClear target regional and sector-specific projects, highlighting verified carbon reductions and alignment with international standards. ClimeCo LLC., EcoAct, and Ecosecurities focus on advisory and brokerage services, promoting verified credits from sustainable waste management projects.
Green Mountain Energy Company and Sterling Planet Inc. combine renewable energy programs with carbon offset solutions, appealing to corporate and consumer markets. PwC emphasizes consultancy services and verification expertise, providing assurance and credibility. Suez integrates operational waste management solutions with carbon credit generation, showcasing measurable environmental impact. Brochures highlight project type, certification standards, emission reductions, and pricing models, enabling buyers to assess credibility and value. Marketing materials play a central role in competition, combining technical data, certification details, and project outcomes to support purchase decisions. Frequent updates reflect evolving regulatory frameworks, new project certifications, and emerging market opportunities. Larger firms leverage global networks and brand credibility, while smaller players emphasize niche project expertise, agility, and rapid deployment.
| Item | Value |
|---|---|
| Quantitative Units | USD 14.7 Billion |
| Type | Voluntary and Compliance |
| Regions Covered | North America, Europe, Asia-Pacific, Latin America, Middle East & Africa |
| Country Covered | United States, Canada, Germany, France, United Kingdom, China, Japan, India, Brazil, South Africa |
| Key Companies Profiled | 3Degrees, ALLCOT, Atmosfair, CarbonClear, Climate Impact Partners, ClimeCo LLC., EcoAct, Ecosecurities, Green Mountain Energy Company, PwC, South Pole, Sterling Planet Inc., and Suez |
| Additional Attributes | Dollar sales by snack type and end use, demand dynamics across retail, foodservice, and online channels, regional trends in health-conscious consumption, innovation in functional ingredients, portion control, and packaging, environmental impact of sourcing and waste, and emerging use cases in plant-based, protein-rich, and on-the-go nutrition products. |
The global waste management carbon credit market is estimated to be valued at USD 14.7 billion in 2025.
The market size for the waste management carbon credit market is projected to reach USD 64.4 billion by 2035.
The waste management carbon credit market is expected to grow at a 15.9% CAGR between 2025 and 2035.
The key product types in waste management carbon credit market are voluntary and compliance.
In terms of , segment to command 0.0% share in the waste management carbon credit market in 2025.


Our Research Products

The "Full Research Suite" delivers actionable market intel, deep dives on markets or technologies, so clients act faster, cut risk, and unlock growth.

The Leaderboard benchmarks and ranks top vendors, classifying them as Established Leaders, Leading Challengers, or Disruptors & Challengers.

Locates where complements amplify value and substitutes erode it, forecasting net impact by horizon

We deliver granular, decision-grade intel: market sizing, 5-year forecasts, pricing, adoption, usage, revenue, and operational KPIs—plus competitor tracking, regulation, and value chains—across 60 countries broadly.

Spot the shifts before they hit your P&L. We track inflection points, adoption curves, pricing moves, and ecosystem plays to show where demand is heading, why it is changing, and what to do next across high-growth markets and disruptive tech

Real-time reads of user behavior. We track shifting priorities, perceptions of today’s and next-gen services, and provider experience, then pace how fast tech moves from trial to adoption, blending buyer, consumer, and channel inputs with social signals (#WhySwitch, #UX).

Partner with our analyst team to build a custom report designed around your business priorities. From analysing market trends to assessing competitors or crafting bespoke datasets, we tailor insights to your needs.
Supplier Intelligence
Discovery & Profiling
Capacity & Footprint
Performance & Risk
Compliance & Governance
Commercial Readiness
Who Supplies Whom
Scorecards & Shortlists
Playbooks & Docs
Category Intelligence
Definition & Scope
Demand & Use Cases
Cost Drivers
Market Structure
Supply Chain Map
Trade & Policy
Operating Norms
Deliverables
Buyer Intelligence
Account Basics
Spend & Scope
Procurement Model
Vendor Requirements
Terms & Policies
Entry Strategy
Pain Points & Triggers
Outputs
Pricing Analysis
Benchmarks
Trends
Should-Cost
Indexation
Landed Cost
Commercial Terms
Deliverables
Brand Analysis
Positioning & Value Prop
Share & Presence
Customer Evidence
Go-to-Market
Digital & Reputation
Compliance & Trust
KPIs & Gaps
Outputs
Full Research Suite comprises of:
Market outlook & trends analysis
Interviews & case studies
Strategic recommendations
Vendor profiles & capabilities analysis
5-year forecasts
8 regions and 60+ country-level data splits
Market segment data splits
12 months of continuous data updates
DELIVERED AS:
PDF EXCEL ONLINE
Waste Heat Power Generation Boiler Market Size and Share Forecast Outlook 2025 to 2035
Waste Wood Recycling Market Size and Share Forecast Outlook 2025 to 2035
Waste-derived Pyrolysis Oil Market Size and Share Forecast Outlook 2025 to 2035
Wastewater Heavy Metal Treatment Agent Market Size and Share Forecast Outlook 2025 to 2035
Wastewater Treatment Aerators Market Size and Share Forecast Outlook 2025 to 2035
Waste Heat To Power Market Size and Share Forecast Outlook 2025 to 2035
Waste to Energy Market Growth - Trends & Forecast 2025 to 2035
Waste Recycling Services Market by Application, Product Type, and Region - Growth, Trends, and Forecast 2025 to 2035
Waste Wrap Film Market
Waste Management Market Size and Share Forecast Outlook 2025 to 2035
E-Waste Management Market Growth - Trends & Forecast 2025 to 2035
AI Waste Sorting Robots Market Forecast and Outlook 2025 to 2035
Oily Waste Can Market Size and Share Forecast Outlook 2025 to 2035
Zero-Waste Packaging Technologies Market Size and Share Forecast Outlook 2025 to 2035
Zero-Waste Refill Packaging Market Analysis - Size, Share, and Forecast Outlook 2025 to 2035
APAC Waste Heat Recovery Systems Market Size and Share Forecast Outlook 2025 to 2035
Food Waste Shredder Market Size and Share Forecast Outlook 2025 to 2035
Food Waste Disposal Equipment Market Size and Share Forecast Outlook 2025 to 2035
Food Waste Composting Machine Market Size and Share Forecast Outlook 2025 to 2035
Food Waste-Derived Protein Market Size and Share Forecast Outlook 2025 to 2035

Thank you!
You will receive an email from our Business Development Manager. Please be sure to check your SPAM/JUNK folder too.
Chat With
MaRIA