Zero-Waste Packaging Technologies Market Size and Share Forecast Outlook 2025 to 2035

A valuation of USD 2,203.4 million is projected for the Zero-Waste Packaging Technologies Market in 2025, with the figure anticipated to climb to USD 6,905.7 million by 2035. This represents an increase of USD 4,702.3 million, equal to a 212% expansion over the decade. The overall trajectory reflects a CAGR of 12.1%, signaling more than a threefold increase in market size by the end of the forecast horizon.
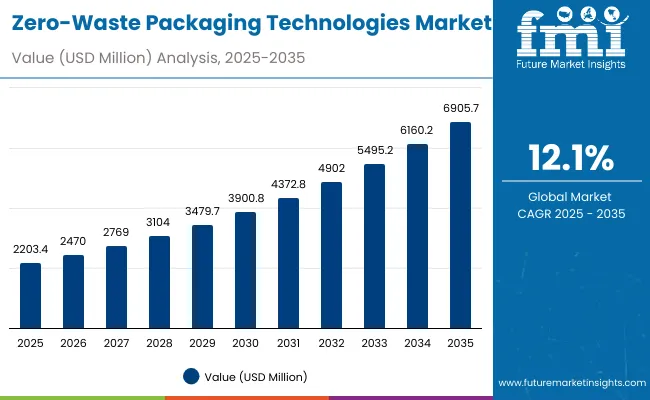
Quick Stats for Zero-Waste Packaging Technologies Market

  • Zero-Waste Packaging Technologies Market Value (2025): USD 2,203.4 million
  • Zero-Waste Packaging Technologies Market Forecast Value (2035): USD 6,905.7 million
  • Zero-Waste Packaging Technologies Market Forecast CAGR (2025 to 2035): 12.1%
  • Leading Segment in 2025 (Format): Others (55.6%)
  • Key Growth Regions: Asia-Pacific, North America, Europe
  • Top Key Players: Terra Cycle Loop, Lush, Ethique, Unilever, L’Oréal, Procter & Gamble, Albéa, AptarGroup, Ecologic Brands, Beauty Kitchen

Zero Waste Packaging Technologies Market

Zero-Waste Packaging Technologies Market Key Takeaways

Metric Value
Zero-Waste Packaging Technologies Market Estimated Value in (2025E) USD 2,203.4 million
Zero-Waste Packaging Technologies Market Forecast Value in (2035F) USD 6,905.7 million
Forecast CAGR (2025 to 2035) 12.10%

During the initial five-year phase from 2025 to 2030, the market is expected to grow from USD 2,203.4 million to USD 3,900.8 million, contributing USD 1,697.4 million. This period is anticipated to account for 36% of the total decade growth. Momentum in this phase is expected to be fueled by strong adoption of refill pods, dissolvable sachets, and reusable systems across mainstream categories. Others by format, representing 55.6% share, and Others by channel with 53.5% share, are projected to dominate, supported by collaborative retail models and innovative supply-chain integration.

The second half of the decade from 2030 to 2035 is forecasted to contribute USD 3,004.9 million, which equals 64% of total growth, as the market advances from USD 3,900.8 million to USD 6,905.7 million. This acceleration is anticipated to be reinforced by large-scale deployment of loop systems, regulatory pressure on single-use packaging, and the scaling of home-compostable solutions. By 2035, mainstream adoption is expected to consolidate the dominance of Others across both format and channel segments, reflecting strong resilience and long-term sustainability appeal.

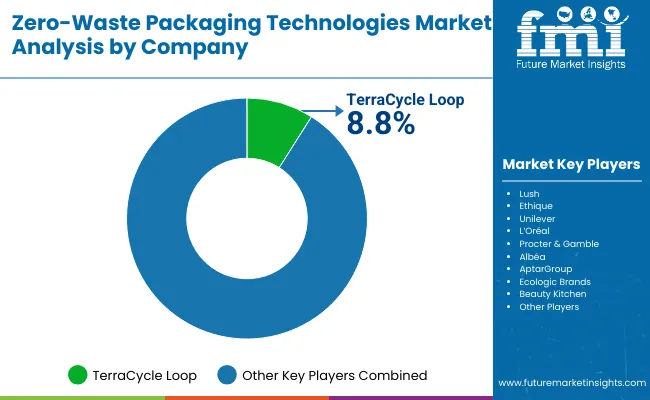
From 2020 to 2024, the groundwork for growth in zero-waste packaging was established as sustainability regulations tightened and consumer expectations for eco-friendly solutions increased. By 2025, the market is projected to reach USD 2,203.4 million, setting the stage for an era of rapid expansion. Competitive dynamics are expected to remain fragmented, with TerraCycle Loop holding 8.8% share while the majority of value is distributed among diversified players.

By 2035, demand is forecasted to climb to USD 6,905.7 million, supported by a CAGR of 12.1%. Asia-Pacific, particularly China and India, is anticipated to deliver the highest growth momentum, while North America and Europe are projected to remain strong innovation hubs. Market advantage is expected to be redefined by ecosystem strength, closed-loop integration, and consumer engagement platforms rather than by packaging formats alone. Traditional packaging approaches are likely to give way to circular models that emphasize scalability, affordability, and measurable sustainability impact.

Why The Zero-Waste Packaging Technologies Market is growing?

Growth in the Zero-Waste Packaging Technologies Market is being driven by rising consumer demand for sustainable alternatives and increasing regulatory pressures to reduce single-use plastics. Strong emphasis has been placed on refillable, compostable, and reusable packaging systems, which are being adopted across industries ranging from personal care to food and beverages. Expansion is being reinforced by the adoption of refill pods, dissolvable sachets, and compostable formats that align with evolving circular economy principles.

Innovation in closed-loop supply chains is anticipated to accelerate adoption as major brands incorporate zero-waste solutions into mainstream portfolios. Investment in infrastructure such as in-store refill stations and mail-back systems is being scaled to improve accessibility and consumer convenience. Rapid uptake in Asia-Pacific, particularly in China and India, is expected to reshape competitive positioning, while North America and Europe are projected to act as innovation hubs. Market momentum is anticipated to remain robust as sustainability becomes a core purchasing driver.

Segmental Analysis

The Zero-Waste Packaging Technologies Market has been segmented across multiple dimensions to highlight adoption trends and identify growth opportunities. Segmentation by channel provides insights into how consumers are accessing zero-waste solutions through direct-to-consumer models and wider distribution networks. Segmentation by customer type examines how mass brands and niche players are embracing sustainability-driven packaging innovation. Segmentation by format explores the growing use of refill systems and alternative packaging types that eliminate waste at source. This structured approach allows deeper understanding of market direction and competitive advantage. Future expansion is expected to be defined by the balance between scale-driven adoption by mainstream brands and innovation-led contributions from smaller players.
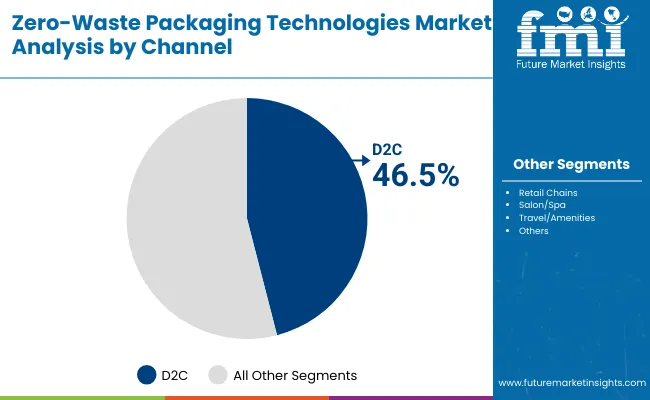
Insights into the Channel Segment with Others Leading in Market Share

Zero Waste Packaging Technologies Market By Channel

Segment Market Value Share, 2025
D2C 46.5%
Others 53.5%

The channel segment is expected to demonstrate strong diversification, with Others holding 53.5% share in 2025, equal to USD 1,179.6 million. This dominance is anticipated to be supported by extensive partnerships with retailers and supply-chain systems that integrate refill and reuse models. D2C, valued at USD 1,022.2 million, is projected to benefit from brand-controlled consumer experiences, driving deeper engagement and loyalty. Increasing online adoption and direct brand interaction are likely to accelerate D2C growth in the coming years. The long-term outlook suggests that both channels will remain vital, with Others delivering scale advantages while D2C fosters innovation and personalized sustainability experiences.
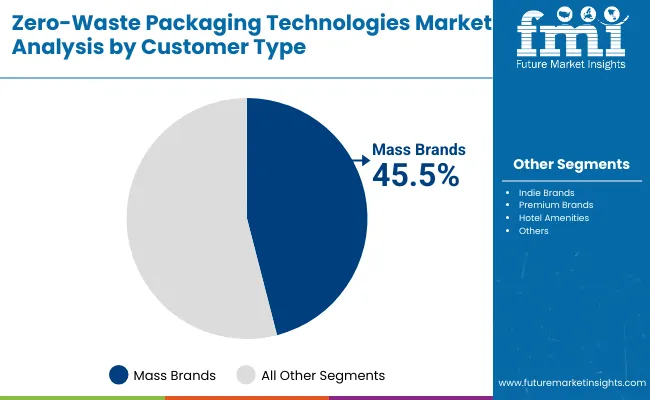
Insights into the Customer Type Segment with Others Holding a Larger Share

Zero Waste Packaging Technologies Market By Customer Type

Segment Market Value Share, 2025
Mass brands 45.5%
Others 54.5%

The customer type segment is forecasted to be led by Others with 54.5% share in 2025, representing USD 1,201.85 million. This reflects the growing adoption by independent, niche, and premium brands that are prioritizing sustainable identity as a core differentiator. Mass brands are projected to contribute 45.5% (USD 1,000.4 million), supported by their capacity to scale zero-waste solutions across wide consumer bases. Over time, mass brands are expected to drive affordability and accessibility, while Others will sustain innovation and early adoption of new formats. Market balance is likely to shift as mainstream players expand their sustainability commitments, creating an ecosystem where both segments collectively accelerate overall growth.
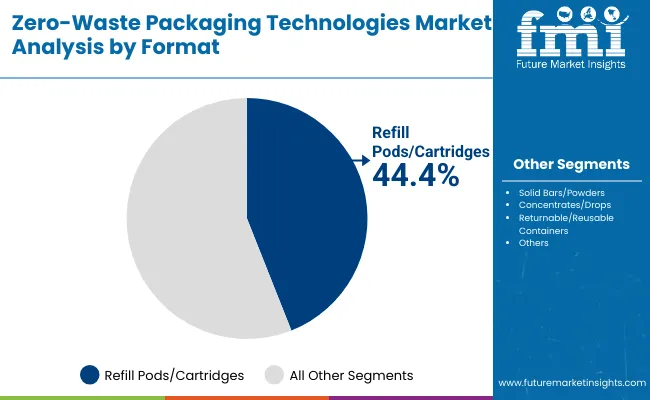
Insights into the Format Segment with Others Dominating Adoption

Zero Waste Packaging Technologies Market By Format

Segment Market Value Share, 2025
Refill pods/cartridges 44.4%
Others 55.6%

The format segment is projected to be dominated by Others in 2025, capturing 55.6% share worth USD 1,224.11 million. This growth is anticipated to be driven by diverse formats such as powders, dissolvable sachets, and reusable containers that expand consumer choice while minimizing waste. Refill pods and cartridges are expected to contribute 44.4% (USD 977.8 million), reflecting strong penetration in personal care and household product categories. Increasing consumer familiarity with refill systems is likely to strengthen this segment further over time. The evolution of format choices is expected to redefine packaging norms, with innovation in compostable and reusable options sustaining long-term market adoption.

What are the Drivers, Restraints, and Key Trends of the Zero-Waste Packaging Technologies Market?

Adoption of zero-waste packaging is being reshaped by shifting consumer expectations, regulatory frameworks, and technological innovations. While systemic challenges persist in scaling infrastructure and cost efficiency, evolving industry priorities are projected to accelerate the transition toward sustainable, circular packaging ecosystems globally.

Regulatory Convergence on Circular Economy Standards

The driver most significantly shaping this market is regulatory convergence on circular economy principles. Packaging producers are being required to align with extended producer responsibility (EPR) frameworks, mandating lifecycle accountability and measurable waste reduction. Such alignment is anticipated to create standardization across markets, simplifying compliance for global brands while intensifying the need for innovation. Government-led incentives for compostable materials and bans on single-use plastics are expected to accelerate adoption. In this environment, companies that invest in modular packaging systems and closed-loop logistics are forecasted to establish long-term cost advantages, while late adopters risk regulatory penalties and reputational erosion.

Infrastructure Gaps in Refill and Reuse Systems

A major restraint arises from infrastructure gaps that limit refill and reuse adoption at scale. While consumer willingness has strengthened, insufficient accessibility to refill stations and inconsistent reverse logistics systems are constraining widespread usage. The absence of standardized return frameworks across retail networks adds operational complexity and inflates costs. This challenge is particularly acute in emerging markets where infrastructure investment lags behind policy ambitions. Unless these bottlenecks are addressed, scalability will remain uneven, slowing the pace of transition. However, collaboration between packaging innovators, retailers, and municipal systems is projected to be decisive in overcoming this barrier, unlocking untapped growth potential.
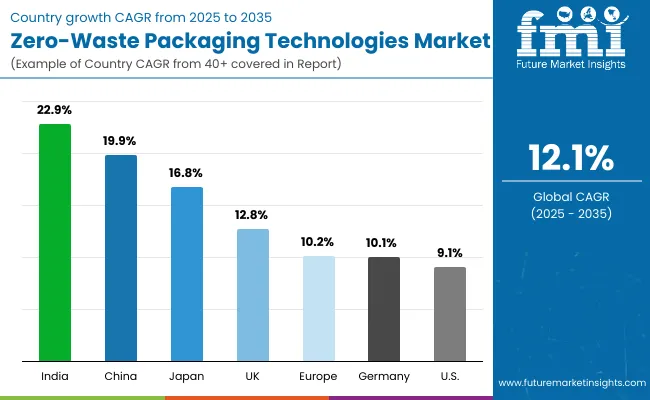
Analysis of Zero-Waste Packaging Technologies Market By Key Countries

Country Zero Waste Packaging Technologies Market

Countries CAGR
China 19.9%
USA 9.1%
India 22.9%
UK 12.8%
Germany 10.1%
Japan 16.8%

The Zero-Waste Packaging Technologies Market demonstrates varied adoption across countries, shaped by policy frameworks, consumer awareness, and infrastructure maturity. Asia-Pacific is forecasted to emerge as the strongest growth hub, anchored by India at a CAGR of 22.9% and China at 19.9% during 2025-2035. India’s trajectory is expected to be powered by regulatory support, heightened consumer acceptance, and the expansion of organized retail networks that are embedding refill and reuse systems into mainstream distribution. China’s growth outlook is reinforced by large-scale government initiatives on sustainability, rapid digitalization of supply chains, and the influence of leading domestic brands embracing zero-waste commitments.

Japan, with a projected CAGR of 16.8%, is anticipated to benefit from advanced recycling infrastructure and consumer-driven demand for premium sustainable packaging solutions. In Europe, the UK and Germany are projected to grow at 12.8% and 10.1% respectively, driven by stringent compliance standards, circular economy directives, and strong participation from multinational consumer goods companies. North America reflects a more moderate trajectory, with the USA expected to grow at 9.1%. Growth in the USA is likely to be led by technology-driven collaborations and corporate sustainability strategies rather than regulatory enforcement. Collectively, these markets illustrate a transition toward global convergence in zero-waste adoption, though at varied speeds.
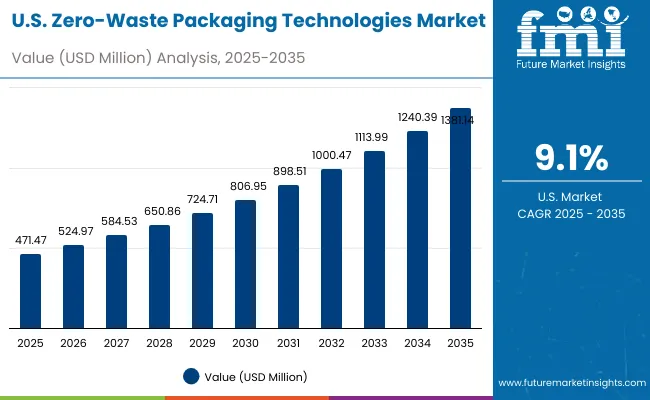
Sales Outlook for Zero-Waste Packaging Technologies in the United States

Usa Zero Waste Packaging Technologies Market

Year USA Zero-Waste Packaging Technologies Market (USD Million)
2025 471.47
2026 524.97
2027 584.53
2028 650.86
2029 724.71
2030 806.95
2031 898.51
2032 1,000.47
2033 1,113.99
2034 1,240.39
2035 1,381.14

The Zero-Waste Packaging Technologies Market in the United States is projected to grow at a CAGR of 11.0%, driven by the scaling of refill systems, reusable containers, and compostable packaging formats. Retail collaborations have recorded consistent year-on-year expansion, particularly among consumer goods companies integrating closed-loop packaging models. The food and beverage sector has been incorporating refillable stations into mainstream outlets, while personal care and household product categories are embedding zero-waste packaging into subscription and direct-to-consumer channels. Innovation is also expanding in e-commerce, where sustainable packaging formats are being integrated to address rising consumer demand for environmentally responsible solutions. Advancements in digital traceability and supply chain automation are creating opportunities for ecosystem partnerships across industries.

  • Retail and consumer goods collaborations are shaping adoption of refillable and reusable systems.
  • Food and beverage players are embedding zero-waste packaging into in-store and online formats.
  • Digital traceability platforms are enabling scalable integration of sustainable packaging models.

Growth and Expansion Outlook for Zero-Waste Packaging Technologies Market in the United Kingdom

The Zero-Waste Packaging Technologies Market in the UK is projected to expand at a CAGR of 12.8% between 2025 and 2035, supported by sustainability commitments and regulatory compliance with circular economy directives. Retailers have been integrating refill stations into mainstream supermarkets, enabling scalable adoption. Premium brands have been adopting reusable and compostable formats to reinforce eco-conscious consumer engagement. E-commerce platforms are expected to accelerate uptake by promoting waste-free delivery systems. Policy enforcement is anticipated to push manufacturers toward eco-friendly innovations, ensuring consistent market growth.

  • Supermarket-led refill models are reinforcing mainstream accessibility.
  • Premium brands are adopting compostable packaging for stronger positioning.
  • Online channels are embedding sustainable delivery packaging systems.
  • Policy frameworks are mandating alignment with circular economy goals.

Growth and Expansion Outlook for Zero-Waste Packaging Technologies Market in India

The Zero-Waste Packaging Technologies Market in India is forecasted to grow at the highest rate globally, registering a CAGR of 22.9% from 2025 to 2035. Expansion is being fueled by government-led sustainability initiatives and rising urban consumption. Organized retail chains have been piloting reusable and refill-based packaging, while small-scale enterprises are innovating with dissolvable and home-compostable alternatives. A strong cultural emphasis on reducing waste is expected to complement this trajectory, creating fertile ground for scaling. Infrastructure improvements and digital commerce integration are projected to strengthen accessibility across urban and semi-urban regions.

  • Organized retail networks are embedding refill and reuse systems.
  • SMEs are innovating with dissolvable and compostable packaging.
  • Policy-driven sustainability mandates are accelerating transformation.
  • E-commerce channels are expanding consumer access to zero-waste options.

Sales Outlook For Zero-Waste Packaging Technologies in China

The Zero-Waste Packaging Technologies Market in China is projected to achieve a CAGR of 19.9% through 2035, driven by government regulations and strong consumer acceptance of sustainable solutions. Leading domestic brands are aligning with zero-waste commitments, reinforcing large-scale adoption. Expansion is being powered by investments in circular supply chain systems and widespread availability of refill stations across metropolitan areas. E-commerce and subscription-based models are expected to integrate zero-waste packaging to meet sustainability demands. Continuous technological innovation in biodegradable and compostable materials is anticipated to accelerate market penetration.
  • Domestic brands are embedding zero-waste commitments across portfolios.
  • Circular supply chain investments are enabling large-scale adoption.
  • Urban refill infrastructure is expanding rapidly.
  • Technological advances in compostables are driving material innovation.

In-depth Analysis of Zero-Waste Packaging Technologies in Germany

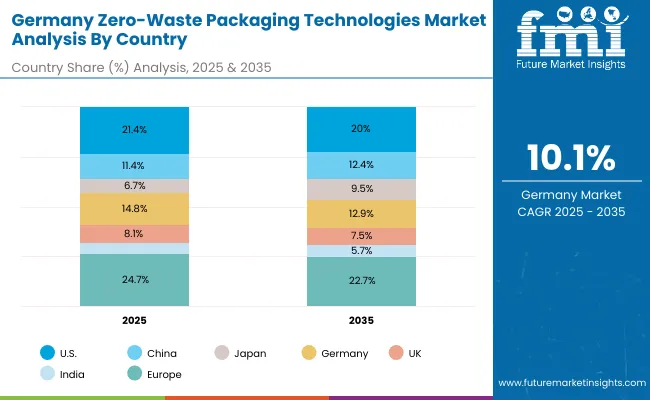
Germany Zero Waste Packaging Technologies Market By Country

Countries 2025
USA 21.4%
China 11.4%
Japan 6.7%
Germany 14.8%
UK 8.1%
India 5.1%
Countries 2035
USA 20.0%
China 12.4%
Japan 9.5%
Germany 12.9%
UK 7.5%
India 5.7%

The Zero-Waste Packaging Technologies Market in Germany is expected to expand at a CAGR of 10.1% during 2025-2035, supported by stringent EU circular economy directives and consumer-driven sustainability preferences. Multinational consumer goods companies are adopting closed-loop packaging systems to comply with regulatory standards. Strong recycling infrastructure is anticipated to accelerate the integration of reusable packaging formats. Growth is being reinforced by widespread retailer participation in refill and return schemes. Collaboration between packaging innovators and manufacturing industries is projected to advance adoption of next-generation zero-waste technologies.
  • EU compliance mandates are strengthening adoption of closed-loop systems.
  • Recycling infrastructure is supporting reusable packaging expansion.
  • Retailer engagement is driving refill and return program accessibility.
  • Industrial collaborations are fostering innovation in sustainable packaging.

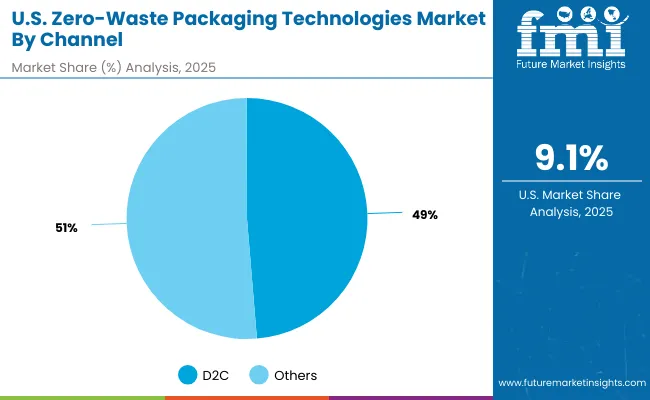
Growth Outlook for Zero-Waste Packaging Technologies Market in USA

Usa Zero Waste Packaging Technologies Market By Channel

Segment Market Value Share, 2025
D2C 48.7%
Others 51.3%

The Zero-Waste Packaging Technologies Market in the United States is projected at USD 471.47 million in 2025. Others contribute 51.3%, while D2C holds 48.7%, which illustrates a nearly balanced channel distribution. This marginal dominance of Others reflects the embedded role of retail and third-party networks in scaling refill and reuse models across supermarkets, convenience stores, and specialty outlets. D2C has been positioned as a strong parallel channel, supported by subscription models and e-commerce-driven consumer engagement. As digital retail ecosystems mature, opportunities are anticipated for hybrid adoption, where direct brand control complements retail partnerships to accelerate mainstream zero-waste accessibility. Integration of digital traceability tools is expected to strengthen consumer confidence and further expand D2C adoption. Over the long term, the interplay between scale-oriented retail channels and innovation-led direct-to-consumer platforms is projected to define market leadership.
  • The USA market is valued at USD 471.47 million in 2025.
  • Others lead slightly with 51.3% versus D2C at 48.7%.
  • Retail collaborations anchor scale, while D2C builds brand engagement.
  • Hybrid adoption is expected to shape long-term competitive advantage.

Opportunity Analysis of China Zero-Waste Packaging Technologies Market

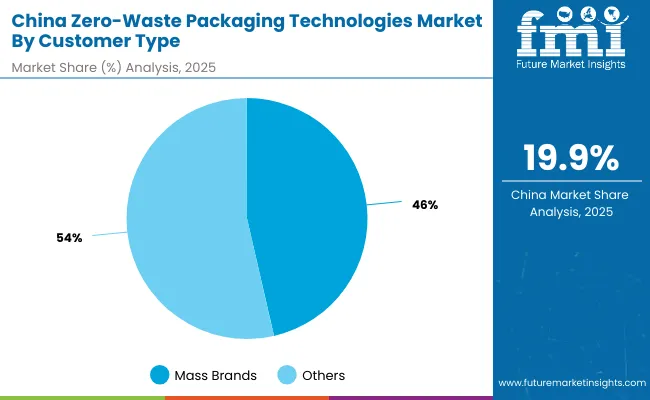
China Zero Waste Packaging Technologies Market By Customer Type

Segment Market Value Share, 2025
Mass brands 46.4%
Others 53.6%

The Zero-Waste Packaging Technologies Market in China is projected at USD 251.50 million in 2025. Others contribute 53.6%, while Mass brands hold 46.4%, reflecting a slightly higher adoption among independent, niche, and premium players. This dominance of Others highlights the speed with which emerging brands are aligning with zero-waste values to attract environmentally conscious consumers in urban markets. Mass brands are nonetheless positioned strongly, with their scale expected to drive affordability and accessibility across diverse consumer bases. Policy mandates and government incentives for sustainable packaging are anticipated to further reinforce adoption across both groups. Over time, integration of smart packaging systems, digital traceability, and home-compostable materials is projected to strengthen customer confidence and accelerate adoption. The balance between scale-driven expansion by Mass brands and innovation-driven adoption by Others is expected to create a dynamic growth environment in China.
  • The China market is valued at USD 251.50 million in 2025.
  • Others lead with 53.6% share, compared to 46.4% for Mass brands.
  • Niche and premium brands are accelerating zero-waste innovation.
  • Government mandates and consumer demand are shaping adoption patterns.

Competitive Landscape of Zero-Waste Packaging Technologies Market

Zero Waste Packaging Technologies Market By Company

Company Global Value Share 2025
TerraCycle Loop 8.8%
Others 91.2%

The Zero-Waste Packaging Technologies Market is moderately fragmented, with global leaders, mid-sized innovators, and niche-focused specialists competing across regions. Prominent players such as Terra Cycle Loop, Unilever, L’Oréal, and Procter & Gamble are recognized as global leaders, leveraging scale, brand influence, and supply chain integration to accelerate adoption. Terra Cycle Loop, in particular, has emerged as the most dominant player, holding 8.8% global market share in 2024, while the remainder of the market is divided among diversified multinational corporations and emerging innovators.

Mid-sized innovators including Ethique, Lush, Albéa, and AptarGroup are strengthening their presence through product innovation and eco-centric brand positioning. These companies are introducing refill pods, dissolvable packaging, and reusable container solutions to align with evolving consumer expectations. Their strategies are increasingly built around affordability, accessibility, and customization, making them highly competitive in fast-growing segments.

Specialist providers such as Ecologic Brands and Beauty Kitchen are focusing on niche adoption models, particularly compostable containers and refill-based solutions, often gaining traction through strong regional partnerships.

Competitive differentiation is shifting from traditional packaging functionality toward closed-loop ecosystems, digital traceability, and circular logistics models. Over the forecast horizon, partnerships, innovation in compostable materials, and hybrid distribution strategies are expected to define long-term market positioning.

Key Developments in Zero-Waste Packaging Technologies Market

  • On February 11, 2025, the European Union’s Packaging and Packaging Waste Regulation (PPWR), EU 2025/40 officially entered into force.
  • On May 27, 2025, the second edition of the Blueprint for High-Performing, Adaptable Local Packaging Reuse Systems was launched by Zero Waste Europe at the Reuse Economy Expo in Paris.

Scope of the Report

Item Value
Quantitative Units USD 2,203.4 million (2025E) - USD 6,905.7 million (2035F)
By Channel D2C (USD 1,022.2 million, 46.5% share in 2025), Others (USD 1,179.6 million, 53.5% share in 2025)
By Customer Type Mass brands (USD 1,000.4 million, 45.5% share in 2025), Others (USD 1,201.9 million, 54.5% share in 2025)
By Format Refill pods/cartridges (USD 977.8 million, 44.4% share in 2025), Others (USD 1,224.1 million, 55.6% share in 2025)
By Material PCR/biopolymers, Paper-composite, Aluminum, Glass
By System In-store refill stations, Mail-back/Loop systems, Home-compostable packs, Dissolvable sachets
End-use Industry Food & Beverages, Personal Care & Cosmetics, Household Products, Hospitality, Retail Chains, Healthcare Packaging, Travel & Amenities
Regions Covered North America, Europe, Asia-Pacific, Latin America, Middle East & Africa
Countries Covered United States, Canada, Germany, United Kingdom, France, China, Japan, India, Brazil, South Africa
Key Companies Profiled TerraCycle Loop, Unilever, L’Oréal, Procter & Gamble, Albéa, AptarGroup, Ecologic Brands, Beauty Kitchen, Ethique, Lush
Additional Attributes Dollar sales by channel, customer type, and format; adoption trends in refill/reuse systems; regulatory-driven demand for compostable packaging; growth in refill stations and mail-back systems; integration of digital traceability platforms; regional trends influenced by circular economy policies; innovations in dissolvable and home-compostable packaging materials.

Key Segments

By Format:

  • Refill pods/cartridges
  • Solid bars/powders
  • Concentrates/drops
  • Returnable/reusable containers

By Material:

  • PCR/biopolymers
  • Paper-composite
  • Aluminum
  • Glass

By System:

  • In-store refill stations
  • Mail-back/Loop systems
  • Home-compostable packs
  • Dissolvable sachets
  • Customer Type
  • Mass brands
  • Indie brands
  • Premium brands
  • Hotel amenities

By Channel:

  • D2C
  • Retail chains
  • Salon/spa
  • Travel/amenities

By Region:

  • North America
  • Latin America
  • Europe
  • East Asia
  • South Asia & Pacific
  • Middle East and Africa

Table of Content

  1. Executive Summary
    • Global Market Outlook
    • Demand-side Trends
    • Supply-side Trends
    • Technology Roadmap Analysis
    • Analysis and Recommendations
  2. Market Overview
    • Market Coverage / Taxonomy
    • Market Definition / Scope / Limitations
  3. Market Background
    • Market Dynamics
      • Drivers
      • Restraints
      • Opportunity
      • Trends
    • Scenario Forecast
      • Demand in Optimistic Scenario
      • Demand in Likely Scenario
      • Demand in Conservative Scenario
    • Opportunity Map Analysis
    • Product Life Cycle Analysis
    • Supply Chain Analysis
    • Investment Feasibility Matrix
    • Value Chain Analysis
    • PESTLE and Porter’s Analysis
    • Regulatory Landscape
    • Regional Parent Market Outlook
    • Production and Consumption Statistics
    • Import and Export Statistics
  4. Global Market Analysis 2020 to 2024 and Forecast, 2025 to 2035
    • Historical Market Size Value (USD Million) Analysis, 2020 to 2024
    • Current and Future Market Size Value (USD Million) Projections, 2025 to 2035
      • Y-o-Y Growth Trend Analysis
      • Absolute $ Opportunity Analysis
  5. Global Market Pricing Analysis 2020 to 2024 and Forecast 2025 to 2035
  6. Global Market Analysis 2020 to 2024 and Forecast 2025 to 2035, By Format
    • Introduction / Key Findings
    • Historical Market Size Value (USD Million) Analysis By Format, 2020 to 2024
    • Current and Future Market Size Value (USD Million) Analysis and Forecast By Format, 2025 to 2035
      • Refill pods/cartridges
      • Solid bars/powders
      • Concentrates/drops
      • Returnable/reusable containers
    • Y-o-Y Growth Trend Analysis By Format, 2020 to 2024
    • Absolute $ Opportunity Analysis By Format, 2025 to 2035
  7. Global Market Analysis 2020 to 2024 and Forecast 2025 to 2035, By Material
    • Introduction / Key Findings
    • Historical Market Size Value (USD Million) Analysis By Material, 2020 to 2024
    • Current and Future Market Size Value (USD Million) Analysis and Forecast By Material, 2025 to 2035
      • PCR/biopolymers
      • Paper–composite
      • Aluminum
      • Glass
    • Y-o-Y Growth Trend Analysis By Material, 2020 to 2024
    • Absolute $ Opportunity Analysis By Material, 2025 to 2035
  8. Global Market Analysis 2020 to 2024 and Forecast 2025 to 2035, By System
    • Introduction / Key Findings
    • Historical Market Size Value (USD Million) Analysis By System, 2020 to 2024
    • Current and Future Market Size Value (USD Million) Analysis and Forecast By System, 2025 to 2035
      • In-store refill stations
      • Mail-back/Loop systems
      • Home-compostable packs
      • Dissolvable sachets
      • Customer Type
      • Mass brands
      • Indie brands
      • Premium brands
      • Hotel amenities
    • Y-o-Y Growth Trend Analysis By System, 2020 to 2024
    • Absolute $ Opportunity Analysis By System, 2025 to 2035
  9. Global Market Analysis 2020 to 2024 and Forecast 2025 to 2035, By Channel
    • Introduction / Key Findings
    • Historical Market Size Value (USD Million) Analysis By Channel, 2020 to 2024
    • Current and Future Market Size Value (USD Million) Analysis and Forecast By Channel, 2025 to 2035
      • D2C
      • Retail chains
      • Salon/spa
      • Travel/amenities
    • Y-o-Y Growth Trend Analysis By Channel, 2020 to 2024
    • Absolute $ Opportunity Analysis By Channel, 2025 to 2035
  10. Global Market Analysis 2020 to 2024 and Forecast 2025 to 2035, By Region
    • Introduction
    • Historical Market Size Value (USD Million) Analysis By Region, 2020 to 2024
    • Current Market Size Value (USD Million) Analysis and Forecast By Region, 2025 to 2035
      • North America
      • Latin America
      • Europe
      • East Asia
      • South Asia & Pacific
      • Middle East and Africa
    • Market Attractiveness Analysis By Region
  11. North America Market Analysis 2020 to 2024 and Forecast 2025 to 2035, By Country
    • Historical Market Size Value (USD Million) Trend Analysis By Market Taxonomy, 2020 to 2024
    • Market Size Value (USD Million) Forecast By Market Taxonomy, 2025 to 2035
      • By Country
        • USA
        • Canada
      • By Format
      • By Material
      • By System
      • By Channel
    • Market Attractiveness Analysis
      • By Country
      • By Format
      • By Material
      • By System
      • By Channel
    • Key Takeaways
  12. Latin America Market Analysis 2020 to 2024 and Forecast 2025 to 2035, By Country
    • Historical Market Size Value (USD Million) Trend Analysis By Market Taxonomy, 2020 to 2024
    • Market Size Value (USD Million) Forecast By Market Taxonomy, 2025 to 2035
      • By Country
        • Brazil
        • Mexico
        • Colombia
        • Rest of Latin America
      • By Format
      • By Material
      • By System
      • By Channel
    • Market Attractiveness Analysis
      • By Country
      • By Format
      • By Material
      • By System
      • By Channel
    • Key Takeaways
  13. Europe Market Analysis 2020 to 2024 and Forecast 2025 to 2035, By Country
    • Historical Market Size Value (USD Million) Trend Analysis By Market Taxonomy, 2020 to 2024
    • Market Size Value (USD Million) Forecast By Market Taxonomy, 2025 to 2035
      • By Country
        • Germany
        • U.K.
        • France
        • Italy
        • Spain
        • Belgium
        • Netherlands
        • Nordic
        • Switzerland
        • Russia
        • Poland
        • Rest of Europe
      • By Format
      • By Material
      • By System
      • By Channel
    • Market Attractiveness Analysis
      • By Country
      • By Format
      • By Material
      • By System
      • By Channel
    • Key Takeaways
  14. East Asia Market Analysis 2020 to 2024 and Forecast 2025 to 2035, By Country
    • Historical Market Size Value (USD Million) Trend Analysis By Market Taxonomy, 2020 to 2024
    • Market Size Value (USD Million) Forecast By Market Taxonomy, 2025 to 2035
      • By Country
        • China
        • Japan
        • South Korea
      • By Format
      • By Material
      • By System
      • By Channel
    • Market Attractiveness Analysis
      • By Country
      • By Format
      • By Material
      • By System
      • By Channel
    • Key Takeaways
  15. South Asia & Pacific Market Analysis 2020 to 2024 and Forecast 2025 to 2035, By Country
    • Historical Market Size Value (USD Million) Trend Analysis By Market Taxonomy, 2020 to 2024
    • Market Size Value (USD Million) Forecast By Market Taxonomy, 2025 to 2035
      • By Country
        • India
        • Thailand
        • Malaysia
        • Indonesia
        • Singapore
        • Vietnam
        • Australia
        • New Zealand
        • Rest of South Asia
      • By Format
      • By Material
      • By System
      • By Channel
    • Market Attractiveness Analysis
      • By Country
      • By Format
      • By Material
      • By System
      • By Channel
    • Key Takeaways
  16. Middle East and Africa Market Analysis 2020 to 2024 and Forecast 2025 to 2035, By Country
    • Historical Market Size Value (USD Million) Trend Analysis By Market Taxonomy, 2020 to 2024
    • Market Size Value (USD Million) Forecast By Market Taxonomy, 2025 to 2035
      • By Country
        • Turkey
        • UAE
        • Saudi Arabia
        • Israel
        • Other GCC Countries
        • North Africa
        • South Africa
      • By Format
      • By Material
      • By System
      • By Channel
    • Market Attractiveness Analysis
      • By Country
      • By Format
      • By Material
      • By System
      • By Channel
    • Key Takeaways
  17. Key Countries Market Analysis
    • U.S.
      • Pricing Analysis
      • Market Share Analysis, 2024
        • By Format
        • By Material
        • By System
        • By Channel
    • Canada
      • Pricing Analysis
      • Market Share Analysis, 2024
        • By Format
        • By Material
        • By System
        • By Channel
    • Mexico
      • Pricing Analysis
      • Market Share Analysis, 2024
        • By Format
        • By Material
        • By System
        • By Channel
    • Brazil
      • Pricing Analysis
      • Market Share Analysis, 2024
        • By Format
        • By Material
        • By System
        • By Channel
    • Chile
      • Pricing Analysis
      • Market Share Analysis, 2024
        • By Format
        • By Material
        • By System
        • By Channel
    • Germany
      • Pricing Analysis
      • Market Share Analysis, 2024
        • By Format
        • By Material
        • By System
        • By Channel
    • U.K.
      • Pricing Analysis
      • Market Share Analysis, 2024
        • By Format
        • By Material
        • By System
        • By Channel
    • Italy
      • Pricing Analysis
      • Market Share Analysis, 2024
        • By Format
        • By Material
        • By System
        • By Channel
    • Spain
      • Pricing Analysis
      • Market Share Analysis, 2024
        • By Format
        • By Material
        • By System
        • By Channel
    • France
      • Pricing Analysis
      • Market Share Analysis, 2024
        • By Format
        • By Material
        • By System
        • By Channel
    • India
      • Pricing Analysis
      • Market Share Analysis, 2024
        • By Format
        • By Material
        • By System
        • By Channel
    • ASEAN
      • Pricing Analysis
      • Market Share Analysis, 2024
        • By Format
        • By Material
        • By System
        • By Channel
    • Australia & New Zealand
      • Pricing Analysis
      • Market Share Analysis, 2024
        • By Format
        • By Material
        • By System
        • By Channel
    • China
      • Pricing Analysis
      • Market Share Analysis, 2024
        • By Format
        • By Material
        • By System
        • By Channel
    • Japan
      • Pricing Analysis
      • Market Share Analysis, 2024
        • By Format
        • By Material
        • By System
        • By Channel
    • South Korea
      • Pricing Analysis
      • Market Share Analysis, 2024
        • By Format
        • By Material
        • By System
        • By Channel
    • Russia
      • Pricing Analysis
      • Market Share Analysis, 2024
        • By Format
        • By Material
        • By System
        • By Channel
    • Poland
      • Pricing Analysis
      • Market Share Analysis, 2024
        • By Format
        • By Material
        • By System
        • By Channel
    • Hungary
      • Pricing Analysis
      • Market Share Analysis, 2024
        • By Format
        • By Material
        • By System
        • By Channel
    • Kingdom of Saudi Arabia
      • Pricing Analysis
      • Market Share Analysis, 2024
        • By Format
        • By Material
        • By System
        • By Channel
    • Turkiye
      • Pricing Analysis
      • Market Share Analysis, 2024
        • By Format
        • By Material
        • By System
        • By Channel
    • South Africa
      • Pricing Analysis
      • Market Share Analysis, 2024
        • By Format
        • By Material
        • By System
        • By Channel
  18. Market Structure Analysis
    • Competition Dashboard
    • Competition Benchmarking
    • Market Share Analysis of Top Players
      • By Regional
      • By Format
      • By Material
      • By System
      • By Channel
  19. Competition Analysis
    • Competition Deep Dive
      • TerraCycle Loop
        • Overview
        • Product Portfolio
        • Profitability by Market Segments (Product/Age /Sales Channel/Region)
        • Sales Footprint
        • Strategy Overview
        • Lush
        • Ethique
        • Unilever
        • L’Oréal
        • Procter & Gamble
        • Albéa
        • AptarGroup
        • Ecologic Brands
        • Beauty Kitchen
    • Assumptions & Acronyms Used
    • Research Methodology

List of Tables

  • Table 1: Global Market Value (USD Million) Forecast by Region, 2020-2035
  • Table 2: Global Market Value (USD Million) Forecast by Format, 2020-2035
  • Table 3: Global Market Value (USD Million) Forecast by Material, 2020-2035
  • Table 4: Global Market Value (USD Million) Forecast by System, 2020-2035
  • Table 5: Global Market Value (USD Million) Forecast by Channel, 2020-2035
  • Table 6: North America Market Value (USD Million) Forecast by Country, 2020-2035
  • Table 7: North America Market Value (USD Million) Forecast by Format, 2020-2035
  • Table 8: North America Market Value (USD Million) Forecast by Material, 2020-2035
  • Table 9: North America Market Value (USD Million) Forecast by System, 2020-2035
  • Table 10: North America Market Value (USD Million) Forecast by Channel, 2020-2035
  • Table 11: Latin America Market Value (USD Million) Forecast by Country, 2020-2035
  • Table 12: Latin America Market Value (USD Million) Forecast by Format, 2020-2035
  • Table 13: Latin America Market Value (USD Million) Forecast by Material, 2020-2035
  • Table 14: Latin America Market Value (USD Million) Forecast by System, 2020-2035
  • Table 15: Latin America Market Value (USD Million) Forecast by Channel, 2020-2035
  • Table 16: Europe Market Value (USD Million) Forecast by Country, 2020-2035
  • Table 17: Europe Market Value (USD Million) Forecast by Format, 2020-2035
  • Table 18: Europe Market Value (USD Million) Forecast by Material, 2020-2035
  • Table 19: Europe Market Value (USD Million) Forecast by System, 2020-2035
  • Table 20: Europe Market Value (USD Million) Forecast by Channel, 2020-2035
  • Table 21: East Asia Market Value (USD Million) Forecast by Country, 2020-2035
  • Table 22: East Asia Market Value (USD Million) Forecast by Format, 2020-2035
  • Table 23: East Asia Market Value (USD Million) Forecast by Material, 2020-2035
  • Table 24: East Asia Market Value (USD Million) Forecast by System, 2020-2035
  • Table 25: East Asia Market Value (USD Million) Forecast by Channel, 2020-2035
  • Table 26: South Asia & Pacific Market Value (USD Million) Forecast by Country, 2020-2035
  • Table 27: South Asia & Pacific Market Value (USD Million) Forecast by Format, 2020-2035
  • Table 28: South Asia & Pacific Market Value (USD Million) Forecast by Material, 2020-2035
  • Table 29: South Asia & Pacific Market Value (USD Million) Forecast by System, 2020-2035
  • Table 30: South Asia & Pacific Market Value (USD Million) Forecast by Channel, 2020-2035
  • Table 31: Middle East and Africa Market Value (USD Million) Forecast by Country, 2020-2035
  • Table 32: Middle East and Africa Market Value (USD Million) Forecast by Format, 2020-2035
  • Table 33: Middle East and Africa Market Value (USD Million) Forecast by Material, 2020-2035
  • Table 34: Middle East and Africa Market Value (USD Million) Forecast by System, 2020-2035
  • Table 35: Middle East and Africa Market Value (USD Million) Forecast by Channel, 2020-2035

List of Figures

  • Figure 1: Global Market Pricing Analysis
  • Figure 2: Global Market Value (USD Million) Forecast 2020-2035
  • Figure 3: Global Market Value Share and BPS Analysis by Format, 2025 and 2035
  • Figure 4: Global Market Y-o-Y Growth Comparison by Format, 2025-2035
  • Figure 5: Global Market Attractiveness Analysis by Format
  • Figure 6: Global Market Value Share and BPS Analysis by Material, 2025 and 2035
  • Figure 7: Global Market Y-o-Y Growth Comparison by Material, 2025-2035
  • Figure 8: Global Market Attractiveness Analysis by Material
  • Figure 9: Global Market Value Share and BPS Analysis by System, 2025 and 2035
  • Figure 10: Global Market Y-o-Y Growth Comparison by System, 2025-2035
  • Figure 11: Global Market Attractiveness Analysis by System
  • Figure 12: Global Market Value Share and BPS Analysis by Channel, 2025 and 2035
  • Figure 13: Global Market Y-o-Y Growth Comparison by Channel, 2025-2035
  • Figure 14: Global Market Attractiveness Analysis by Channel
  • Figure 15: Global Market Value (USD Million) Share and BPS Analysis by Region, 2025 and 2035
  • Figure 16: Global Market Y-o-Y Growth Comparison by Region, 2025-2035
  • Figure 17: Global Market Attractiveness Analysis by Region
  • Figure 18: North America Market Incremental $ Opportunity, 2025-2035
  • Figure 19: Latin America Market Incremental $ Opportunity, 2025-2035
  • Figure 20: Europe Market Incremental $ Opportunity, 2025-2035
  • Figure 21: East Asia Market Incremental $ Opportunity, 2025-2035
  • Figure 22: South Asia & Pacific Market Incremental $ Opportunity, 2025-2035
  • Figure 23: Middle East and Africa Market Incremental $ Opportunity, 2025-2035
  • Figure 24: North America Market Value Share and BPS Analysis by Country, 2025 and 2035
  • Figure 25: North America Market Value Share and BPS Analysis by Format, 2025 and 2035
  • Figure 26: North America Market Y-o-Y Growth Comparison by Format, 2025-2035
  • Figure 27: North America Market Attractiveness Analysis by Format
  • Figure 28: North America Market Value Share and BPS Analysis by Material, 2025 and 2035
  • Figure 29: North America Market Y-o-Y Growth Comparison by Material, 2025-2035
  • Figure 30: North America Market Attractiveness Analysis by Material
  • Figure 31: North America Market Value Share and BPS Analysis by System, 2025 and 2035
  • Figure 32: North America Market Y-o-Y Growth Comparison by System, 2025-2035
  • Figure 33: North America Market Attractiveness Analysis by System
  • Figure 34: North America Market Value Share and BPS Analysis by Channel, 2025 and 2035
  • Figure 35: North America Market Y-o-Y Growth Comparison by Channel, 2025-2035
  • Figure 36: North America Market Attractiveness Analysis by Channel
  • Figure 37: Latin America Market Value Share and BPS Analysis by Country, 2025 and 2035
  • Figure 38: Latin America Market Value Share and BPS Analysis by Format, 2025 and 2035
  • Figure 39: Latin America Market Y-o-Y Growth Comparison by Format, 2025-2035
  • Figure 40: Latin America Market Attractiveness Analysis by Format
  • Figure 41: Latin America Market Value Share and BPS Analysis by Material, 2025 and 2035
  • Figure 42: Latin America Market Y-o-Y Growth Comparison by Material, 2025-2035
  • Figure 43: Latin America Market Attractiveness Analysis by Material
  • Figure 44: Latin America Market Value Share and BPS Analysis by System, 2025 and 2035
  • Figure 45: Latin America Market Y-o-Y Growth Comparison by System, 2025-2035
  • Figure 46: Latin America Market Attractiveness Analysis by System
  • Figure 47: Latin America Market Value Share and BPS Analysis by Channel, 2025 and 2035
  • Figure 48: Latin America Market Y-o-Y Growth Comparison by Channel, 2025-2035
  • Figure 49: Latin America Market Attractiveness Analysis by Channel
  • Figure 50: Europe Market Value Share and BPS Analysis by Country, 2025 and 2035
  • Figure 51: Europe Market Value Share and BPS Analysis by Format, 2025 and 2035
  • Figure 52: Europe Market Y-o-Y Growth Comparison by Format, 2025-2035
  • Figure 53: Europe Market Attractiveness Analysis by Format
  • Figure 54: Europe Market Value Share and BPS Analysis by Material, 2025 and 2035
  • Figure 55: Europe Market Y-o-Y Growth Comparison by Material, 2025-2035
  • Figure 56: Europe Market Attractiveness Analysis by Material
  • Figure 57: Europe Market Value Share and BPS Analysis by System, 2025 and 2035
  • Figure 58: Europe Market Y-o-Y Growth Comparison by System, 2025-2035
  • Figure 59: Europe Market Attractiveness Analysis by System
  • Figure 60: Europe Market Value Share and BPS Analysis by Channel, 2025 and 2035
  • Figure 61: Europe Market Y-o-Y Growth Comparison by Channel, 2025-2035
  • Figure 62: Europe Market Attractiveness Analysis by Channel
  • Figure 63: East Asia Market Value Share and BPS Analysis by Country, 2025 and 2035
  • Figure 64: East Asia Market Value Share and BPS Analysis by Format, 2025 and 2035
  • Figure 65: East Asia Market Y-o-Y Growth Comparison by Format, 2025-2035
  • Figure 66: East Asia Market Attractiveness Analysis by Format
  • Figure 67: East Asia Market Value Share and BPS Analysis by Material, 2025 and 2035
  • Figure 68: East Asia Market Y-o-Y Growth Comparison by Material, 2025-2035
  • Figure 69: East Asia Market Attractiveness Analysis by Material
  • Figure 70: East Asia Market Value Share and BPS Analysis by System, 2025 and 2035
  • Figure 71: East Asia Market Y-o-Y Growth Comparison by System, 2025-2035
  • Figure 72: East Asia Market Attractiveness Analysis by System
  • Figure 73: East Asia Market Value Share and BPS Analysis by Channel, 2025 and 2035
  • Figure 74: East Asia Market Y-o-Y Growth Comparison by Channel, 2025-2035
  • Figure 75: East Asia Market Attractiveness Analysis by Channel
  • Figure 76: South Asia & Pacific Market Value Share and BPS Analysis by Country, 2025 and 2035
  • Figure 77: South Asia & Pacific Market Value Share and BPS Analysis by Format, 2025 and 2035
  • Figure 78: South Asia & Pacific Market Y-o-Y Growth Comparison by Format, 2025-2035
  • Figure 79: South Asia & Pacific Market Attractiveness Analysis by Format
  • Figure 80: South Asia & Pacific Market Value Share and BPS Analysis by Material, 2025 and 2035
  • Figure 81: South Asia & Pacific Market Y-o-Y Growth Comparison by Material, 2025-2035
  • Figure 82: South Asia & Pacific Market Attractiveness Analysis by Material
  • Figure 83: South Asia & Pacific Market Value Share and BPS Analysis by System, 2025 and 2035
  • Figure 84: South Asia & Pacific Market Y-o-Y Growth Comparison by System, 2025-2035
  • Figure 85: South Asia & Pacific Market Attractiveness Analysis by System
  • Figure 86: South Asia & Pacific Market Value Share and BPS Analysis by Channel, 2025 and 2035
  • Figure 87: South Asia & Pacific Market Y-o-Y Growth Comparison by Channel, 2025-2035
  • Figure 88: South Asia & Pacific Market Attractiveness Analysis by Channel
  • Figure 89: Middle East and Africa Market Value Share and BPS Analysis by Country, 2025 and 2035
  • Figure 90: Middle East and Africa Market Value Share and BPS Analysis by Format, 2025 and 2035
  • Figure 91: Middle East and Africa Market Y-o-Y Growth Comparison by Format, 2025-2035
  • Figure 92: Middle East and Africa Market Attractiveness Analysis by Format
  • Figure 93: Middle East and Africa Market Value Share and BPS Analysis by Material, 2025 and 2035
  • Figure 94: Middle East and Africa Market Y-o-Y Growth Comparison by Material, 2025-2035
  • Figure 95: Middle East and Africa Market Attractiveness Analysis by Material
  • Figure 96: Middle East and Africa Market Value Share and BPS Analysis by System, 2025 and 2035
  • Figure 97: Middle East and Africa Market Y-o-Y Growth Comparison by System, 2025-2035
  • Figure 98: Middle East and Africa Market Attractiveness Analysis by System
  • Figure 99: Middle East and Africa Market Value Share and BPS Analysis by Channel, 2025 and 2035
  • Figure 100: Middle East and Africa Market Y-o-Y Growth Comparison by Channel, 2025-2035
  • Figure 101: Middle East and Africa Market Attractiveness Analysis by Channel
  • Figure 102: Global Market - Tier Structure Analysis
  • Figure 103: Global Market - Company Share Analysis

Frequently Asked Questions

How big is the Zero-Waste Packaging Technologies Market in 2025?

The global Zero-Waste Packaging Technologies Market is estimated to be valued at USD 2,203.4 million in 2025.

What will be the size of the Zero-Waste Packaging Technologies Market in 2035?

The market size for the Zero-Waste Packaging Technologies Market is projected to reach USD 6,905.7 million by 2035.

How much will the Zero-Waste Packaging Technologies Market grow between 2025 and 2035?

The Zero-Waste Packaging Technologies Market is expected to expand at a CAGR of 12.1% between 2025 and 2035.

What are the key product types in the Zero-Waste Packaging Technologies Market?

The key product types in this market include refill pods and cartridges, dissolvable sachets, compostable packs, and reusable containers.

Which format segment will contribute a significant share in the Zero-Waste Packaging Technologies Market in 2025?

In terms of format, the “Others” category, which includes powders, dissolvable sachets, and reusable containers, is projected to command 55.6% share in 2025.

Explore Similar Insights

Future Market Insights

Zero-Waste Packaging Technologies Market

Chat With

MaRIA

Hi There, I am MaRIA, Your Market Research Intelligence Assistant. How may I help you?