Food Waste Shredder Market
Find Out with FMI Why Governments Are Prioritizing the Use of Food Waste Shredders across the UK, France, Belgium, Germany, Korea, and 30+ Countries!
Food Waste Shredder Market by Product, Type, Use, Application & Region | Forecast 2023 to 2033
Food Waste Shredder Market Outlook (2023 to 2033)
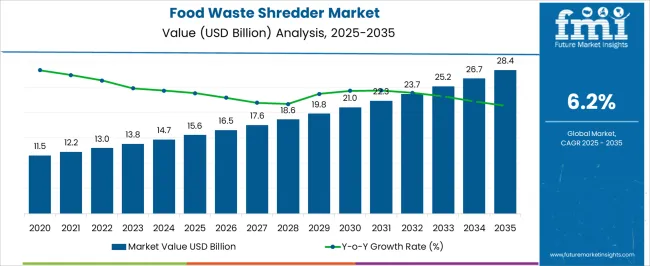
During the projected period (2023 to 2033), the global food waste shredder market is expected to grow at a CAGR of 6.2%. The food waste shredder market size is projected to reach a valuation of US$ 25,184 million by the end of 2033 from US$ 13,800 million in 2023.
Increased focus on food waste control and prevention has resulted in the rising adoption of severe rules, as well as grants, funding, and subsidies for the acquisition of recycling equipment. The global food waste shredder market is likely to develop at a fast pace with the implementation of stringent norms to control food waste.
Food waste as a renewable energy source is another important component in the global market for food waste shredders. Methane is produced from food waste and is utilized to power various treatment units. A large part of food waste litter is recycled and utilized to make organic fertilizers or animal feeds, which is fueling the global food waste shredder market. In addition, the development of improved waste disposal procedures, coupled with the need to develop alternative energy sources, would present the profit potential for the food waste shredder market to grow in the next ten years.
Underdeveloped countries, on the other hand, do not place a high priority on proper waste management and treatment, resulting in the rising incidence of chronic illness. Africa and Asia continue to face issues such as population growth, internal politics, financial support, & a lack of reliable technical competence, knowledge, and assistance. In the forecast period, these regions are likely to witness moderate growth in the food waste shredder market.
Moreover, the ongoing advancement of waste management solutions to enhance the operation of metal food waste shredding machines is another crucial factor that is likely to augment the market. The progression of recycling operation technologies due to the reduction of mineral commodity ore grades is also projected to boost the market.
Increasing concerns over food waste across the globe and rising trade of food & food ingredients between numerous countries are projected to push the development of new supply chains. It is further expected to result in the increasing generation of food waste. High demand for exotic food items such as imported products, premium coffee, and tropical fruits is another vital factor that is anticipated to augment the market in the evaluation period.
Attributes |
Key Statistics |
Global Food Waste Shredder Market Estimated Size (2023E) |
US$ 13,800 Million |
Projected Market Valuation (2033F) |
US$ 25,184 Million |
Value-based CAGR (2023 to 2033) |
6.2% |
Market Share of North America |
28% |
Don't pay for what you don't need
Customize your report by selecting specific countries or regions and save 30%!
2018 to 2022 Global Food Waste Shredder Market Outlook Compared to 2023 to 2033 Demand Forecast
During the historical period between 2018 to 2022, the global food waste shredder market showcased considerable growth at a CAGR of 4.1%. Growth is mainly attributed to the generation of large quantities of food waste, including food service providers, wholesalers, retailers, and food processing facilities. These end-use industries are required to report the waste disposal methods, origin, and volume of waste to the respective governments. These would further help policymakers to remain informed about the sources and volume of food waste in addition to enabling businesses to evaluate the cost of their waste.
As per the Food and Agriculture Organization of the United Nations (FAO), the global volume of food wastage is projected at 1.6 billion tons of primary product equivalents. The total food wastage for the edible part of this accounts for nearly 1.3 billion tons. Also, 1.4 billion hectares of land, or about 28% of the world's agricultural area is annually used for producing food that is either wasted or lost. Thus, food waste management is becoming crucial nowadays to protect the environment and increase sustainability, which would push the global food waste shredder market in the forecast period.
Country-wise Insights
How are US-based Food Waste Shredder Companies Faring?
“Initiatives to Reduce Food Waste in the US to Push Sales of Organic Waste Shredders”
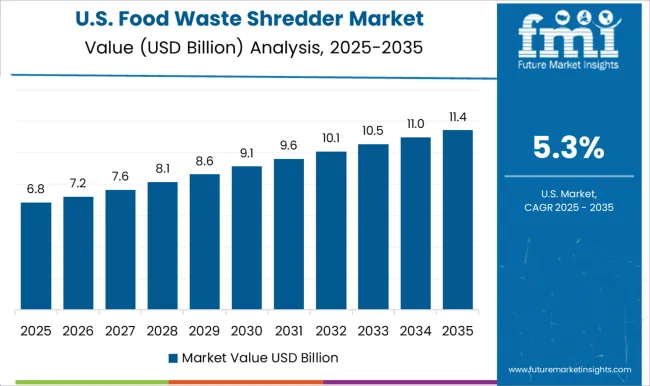
The amount of food thrown out by Americans each year is growing at a fast pace. According to the Environmental Protection Agency (EPA), around 63 million tons of wasted food were produced in the commercial, residential, and institutional sectors in 2018, with animal feed, composting, biochemical/bio-based materials processing, land application, anaerobic digestion/digestion, donation, and wastewater/sewer treatment accounting for about 32%. An increasing number of attempts to reduce food waste, as well as the need to divert the waste away from landfills and incinerators, would also spur the U.S. food waste shredder market in the next ten years.
Why is the Demand for Food Waste Shredders Surging in Australia?
“Domestic and Industrial Applications of Food Waste Shredder Machines to Grow in Australia”
Australia has established a goal to cut food waste in half by 2030, in line with the United Nations' Sustainable Development Goal. The National Food Waste Strategy, Roadmap, and the National Waste Policy Action Plan lay out the steps that must be performed to reduce food waste in the country. As a result, the use of food waste shredders is likely to increase in domestic and industrial applications across Australia.
How are German Food Waste Shredder Manufacturers Progressing?
“Urgent Need to Conserve Resources in Germany to Propel the Demand for Food Waste Recycling Machines”
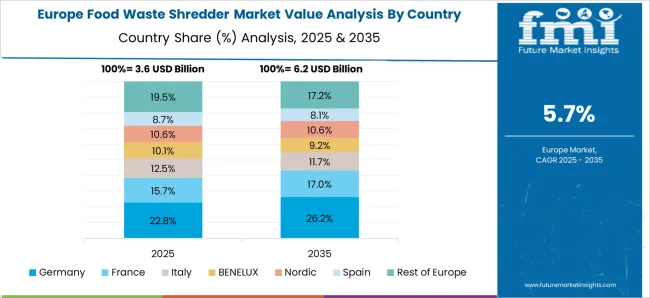
Food waste is generated in Germany at a rate of roughly 12 million tons per year (as of 2015). As per an expert’s opinion from the Federal Ministry of Food and Agriculture (BMEL) scientific advisory boards on agricultural, food, and forest policies, if food waste in domestic households was reduced by 50%, gas emissions in Germany would be decreased by six million tons of CO2. Anyone who contributes to the conservation of resources and climate stewardship by decreasing food waste is doing so actively. The market for food waste shredders is expected to grow at a rapid pace in Germany during the forecast period owing to the above-mentioned factors.
Find your sweet spots for generating winning opportunities in this market.
Talk to AnalystCategory-wise Insights
Which is the Leading Application of Food Waste Shredders?
“Demand for Vegetable Waste Crusher Machines to Surge by the End of 2033”
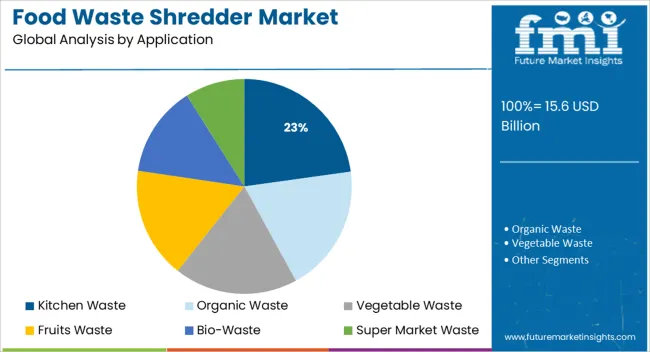
Based on application, the vegetable waste segment is projected to remain at the forefront in the global food waste shredder market. An increasing number of restaurants and fast-food chains is expected to drive the demand for food waste shredders in the next decade across the globe.
Governments of various countries across the globe are also implementing numerous food waste management initiatives such as the Stop Wasting Food movement in Denmark and Love Food Hate Waste in the UK Besides, a global partnership between Messe Düsseldorf, FAO, and the United Nations Environment Program (UNEP) named Think Eat Save in support of the UN Secretary-General’s Zero Hunger Challenge is expected to spur awareness about food waste management. Such initiatives are projected to augur well for the segment.
Competitive Landscape
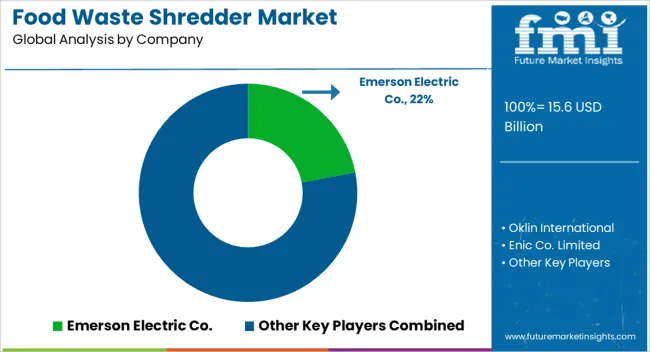
The global food waste shredder market is highly fragmented with the presence of a large number of local and regional players. Mergers & acquisitions, collaborations, expansions, and partnerships are some of the marketing tactics that are being used by significant companies. In addition, leading corporations are investing huge sums in research and development activities to expand their geographic presence.
For instance,
- Maeko created a machine in 2021 that smashes food waste and produces bio-organic manure in an anaerobic atmosphere in one day. It has a bio-enzyme filter system that degrades all types of food waste and eliminates odors. In addition, its industrial composters can be found in hotels, restaurants, schools, stores, and even private households.
- The Zera Food Recycler, developed by WLabs, is a kitchen appliance that can convert food waste into fertilizer in less than 24 hours. It converts about 95% of household waste into homegrown fertilizer by using a fully automated process.
- For commercial and industrial applications, Oklin International launched the GG500s model series. It comes with cutting-edge features that streamline operations for effective waste reduction results. Food waste input is made simple by the bin lifter system and the infrared camera system, which keep operators informed about the composting process.
Get the data you need at a Fraction of the cost
Personalize your report by choosing insights you need
and save 40%!
Scope of the Food Waste Shredder Market Report
Attribute |
Details |
Estimated Market Size (2023) |
US$ 13,800 Million |
Projected Market Valuation (2033) |
US$ 25,184 Million |
Value-based CAGR (2023 to 2033) |
6.2% |
Forecast Period |
2023 to 2033 |
Historical Data Available for |
2018 to 2022 |
Market Analysis |
Value (US$ Million) |
Key Regions Covered |
|
Key Countries Covered |
|
Key Segments Covered |
|
Key Companies Profiled |
|
Report Coverage |
Market Forecast, Company Share Analysis, Competitive Landscape, DROT Analysis, Market Dynamics and Challenges, and Strategic Growth Initiatives |
Food Waste Shredder Market Outlook by Category
By Capacity:
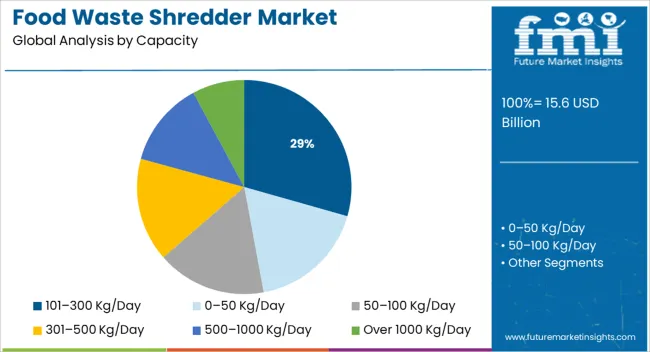
- 0-50 Kg/Day
- 50-100 Kg/Day
- 101-300 Kg/Day
- 301-500 Kg/Day
- 500-1000 Kg/Day
- Over 1000 Kg/Day
By Product:
- Single Shaft Shredder
- Two Shaft Shredder
- Three Shaft Shredder
- Four Shaft Shredder
By Use:
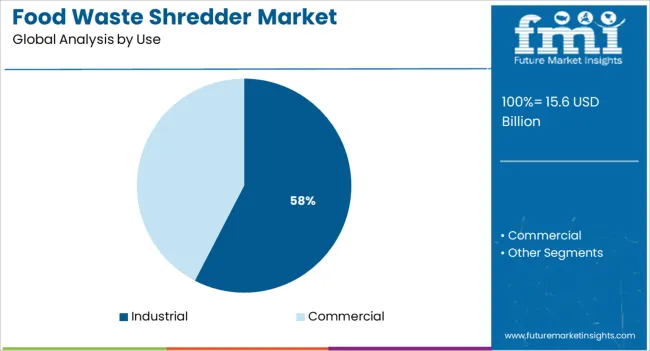
- Commercial
- Industrial
By Application:
- Organic Waste
- Vegetable Waste
- Fruits Waste
- Bio-Waste
- Kitchen Waste
- Super Market Waste
By Region:
- North America
- Latin America
- Europe
- East Asia
- South Asia
- Oceania
- Middle East & Africa (MEA)
Frequently Asked Questions
How big is the food waste shredder market?
The food waste shredder market size is expected to reach US$ 13,800 Million by the end of 2023.
At what rate is the food waste shredder market expected to rise?
The food waste shredder market is expected to rise at a CAGR of 6.2%.
What is the North America food waste shredder market outlook?
The North American food waste shredder market holds nearly 28% of the global share.
Which are the major countries driving demand in the food waste shredder market?
The US, India, China, the UK, Germany, and Italy are the major countries driving demand in the food waste shredder market.
At what rate will the China food waste shredder market grow?
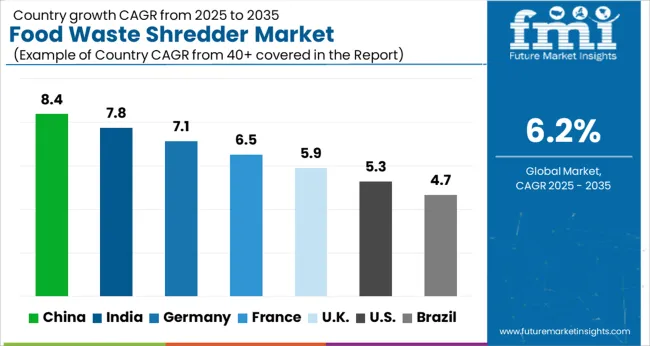
The China food waste shredder market is projected to grow at a CAGR of around 6.57% over the next ten years.
At what rate will the Germany food waste shredder market grow?
The German food waste shredder market is projected to grow at a CAGR of around 4.11% over the next ten years.
How will the Europe food waste shredder market progress in the forecast period?
The Europe food waste shredder market is set to account for 33% of the share in the forecast period.
Who are the top 5 players operating in the food waste shredder market?
BioHiTech Global, Emerson Electric Co., KCS Engineering, Oklin International, and Enic Co. Limited are the top 5 players operating in the food waste shredder market.
What is the demand outlook forecast for the food waste shredder market?
The global food waste shredder market is expected to surpass US$ 25,184 Million by the end of 2033.
Table of Content
1. Executive Summary | Food Waste Shredder Market 1.1. Global Market Outlook 1.2. Demand-side Trends 1.3. Supply-side Trends 1.4. Technology Roadmap Analysis 1.5. Analysis and Recommendations 2. Market Overview 2.1. Market Coverage / Taxonomy 2.2. Market Definition / Scope / Limitations 3. Market Background 3.1. Market Dynamics 3.1.1. Drivers 3.1.2. Restraints 3.1.3. Opportunity 3.1.4. Trends 3.2. Scenario Forecast 3.2.1. Demand in Optimistic Scenario 3.2.2. Demand in Likely Scenario 3.2.3. Demand in Conservative Scenario 3.3. Product launches & Recent Developments 3.4. Product Life Cycle Analysis 3.5. Value Chain Analysis 3.5.1. Supply Side Participants and their Roles 3.5.1.1. Producers 3.5.1.2. Mid-Level Participants (Traders / Agents / Brokers) 3.5.1.3. Wholesalers and Distributors 3.5.2. % of Operating Margin Analysis 3.5.3. List of Raw Material Suppliers 3.5.4. List of Existing and Potential Buyers 3.6. Global Market - Pricing Analysis 3.6.1. Price Point Assessment by Region 3.6.2. Price Point Assessment by Product 3.6.3. Price Forecast till 2032 3.6.4. Factors affecting Pricing 3.7. Forecast Factors - Relevance & Impact 3.8. Regulatory Landscape 3.8.1. Packaging & Labelling Regulations 3.8.2. Certifications and Certifying Agency Overview 3.8.3. Import/Export Policies 3.9. Regional Parent Market Outlook 3.10. Consumers Survey Analysis 3.11. Macro-Economic Factors 3.12. Product Claims & Nutritional Information scanned by Buyers 4. Global Market Analysis 2018 to 2022 and Forecast, 2023 to 2033 4.1. Historical Market Size Value (US$ Million) & Volume (MT) Analysis, 2018 to 2022 4.2. Current and Future Market Size Value (US$ Million) & Volume (MT) Projections, 2023 to 2033 4.2.1. Y-o-Y Growth Trend Analysis 4.2.2. Absolute $ Opportunity Analysis 5. Global Market Analysis 2018 to 2022 and Forecast 2023 to 2033, By Capacity 5.1. Introduction / Key Findings 5.2. Historical Market Size Value (US$ Million) & Volume (MT) Analysis By Capacity, 2018 to 2022 5.3. Current and Future Market Size Value (US$ Million) & Volume (MT) Analysis and Forecast By Capacity, 2023 to 2033 5.3.1. 0-50 Kg/Day 5.3.2. 50-100 Kg/Day 5.3.3. 101-300 Kg/Day 5.3.4. 301-500 Kg/Day 5.3.5. 500-1000 Kg/Day 5.3.6. Over 1000 Kg/Day 5.4. Y-o-Y Growth Trend Analysis By Capacity, 2018 to 2022 5.5. Absolute $ Opportunity Analysis By Capacity, 2023 to 2033 6. Global Market Analysis 2018 to 2022 and Forecast 2023 to 2033, By Product 6.1. Introduction / Key Findings 6.2. Historical Market Size Value (US$ Million) & Volume (MT) Analysis By Product, 2018 to 2022 6.3. Current and Future Market Size Value (US$ Million) & Volume (MT) Analysis and Forecast By Product, 2023 to 2033 6.3.1. Single Shaft Shredder 6.3.2. Two Shaft Shredder 6.3.3. Three Shaft Shredder 6.3.4. Four-Shaft Shredder 6.4. Y-o-Y Growth Trend Analysis By Product, 2018 to 2022 6.5. Absolute $ Opportunity Analysis By Product, 2023 to 2033 7. Global Market Analysis 2018 to 2022 and Forecast 2023 to 2033, By Use 7.1. Introduction / Key Findings 7.2. Historical Market Size Value (US$ Million) & Volume (MT) Analysis By Use, 2018 to 2022 7.3. Current and Future Market Size Value (US$ Million) & Volume (MT) Analysis and Forecast By Use, 2023 to 2033 7.3.1. Commercial 7.3.2. Industrial 7.4. Y-o-Y Growth Trend Analysis By Use, 2018 to 2022 7.5. Absolute $ Opportunity Analysis By Use, 2023 to 2033 8. Global Market Analysis 2018 to 2022 and Forecast 2023 to 2033, By Application 8.1. Introduction / Key Findings 8.2. Historical Market Size Value (US$ Million) & Volume (MT) Analysis By Application, 2018 to 2022 8.3. Current and Future Market Size Value (US$ Million) & Volume (MT) Analysis and Forecast By Application, 2023 to 2033 8.3.1. Organic Waste 8.3.2. Vegetable Waste 8.3.3. Fruits Waste 8.3.4. Bio-Waste 8.3.5. Kitchen Waste 8.3.6. Super Market Waste 8.4. Y-o-Y Growth Trend Analysis By Application, 2018 to 2022 8.5. Absolute $ Opportunity Analysis By Application, 2023 to 2033 9. Global Market Analysis 2018 to 2022 and Forecast 2023 to 2033, By Region 9.1. Introduction 9.2. Historical Market Size Value (US$ Million) & Volume (MT) Analysis By Region, 2018 to 2022 9.3. Current Market Size Value (US$ Million) & Volume (MT) Analysis and Forecast By Region, 2023 to 2033 9.3.1. North America 9.3.2. Latin America 9.3.3. Europe 9.3.4. East Asia 9.3.5. South Asia 9.3.6. Oceania 9.3.7. Middle East & Africa (MEA) 9.4. Market Attractiveness Analysis By Region 10. North America Market Analysis 2018 to 2022 and Forecast 2023 to 2033, By Country 10.1. Historical Market Size Value (US$ Million) & Volume (MT) Trend Analysis By Market Taxonomy, 2018 to 2022 10.2. Market Size Value (US$ Million) & Volume (MT) Forecast By Market Taxonomy, 2023 to 2033 10.2.1. By Country 10.2.1.1. The US 10.2.1.2. Canada 10.2.2. By Capacity 10.2.3. By Product 10.2.4. By Use 10.2.5. By Application 10.3. Market Attractiveness Analysis 10.3.1. By Country 10.3.2. By Capacity 10.3.3. By Product 10.3.4. By Use 10.3.5. By Application 10.4. Key Takeaways 11. Latin America Market Analysis 2018 to 2022 and Forecast 2023 to 2033, By Country 11.1. Historical Market Size Value (US$ Million) & Volume (MT) Trend Analysis By Market Taxonomy, 2018 to 2022 11.2. Market Size Value (US$ Million) & Volume (MT) Forecast By Market Taxonomy, 2023 to 2033 11.2.1. By Country 11.2.1.1. Brazil 11.2.1.2. Mexico 11.2.1.3. Argentina 11.2.1.4. Chile 11.2.1.5. Peru 11.2.1.6. Rest of Latin America 11.2.2. By Capacity 11.2.3. By Product 11.2.4. By Use 11.2.5. By Application 11.3. Market Attractiveness Analysis 11.3.1. By Country 11.3.2. By Capacity 11.3.3. By Product 11.3.4. By Use 11.3.5. By Application 11.4. Key Takeaways 12. Europe Market Analysis 2018 to 2022 and Forecast 2023 to 2033, By Country 12.1. Historical Market Size Value (US$ Million) & Volume (MT) Trend Analysis By Market Taxonomy, 2018 to 2022 12.2. Market Size Value (US$ Million) & Volume (MT) Forecast By Market Taxonomy, 2023 to 2033 12.2.1. By Country 12.2.1.1. Germany 12.2.1.2. Italy 12.2.1.3. France 12.2.1.4. The UK 12.2.1.5. Spain 12.2.1.6. Russia 12.2.1.7. BENELUX 12.2.1.8. Poland 12.2.1.9. Nordic Countries 12.2.1.10. Rest of Europe 12.2.2. By Capacity 12.2.3. By Product 12.2.4. By Use 12.2.5. By Application 12.3. Market Attractiveness Analysis 12.3.1. By Country 12.3.2. By Capacity 12.3.3. By Product 12.3.4. By Use 12.3.5. By Application 12.4. Key Takeaways 13. East Asia Market Analysis 2018 to 2022 and Forecast 2023 to 2033, By Country 13.1. Historical Market Size Value (US$ Million) & Volume (MT) Trend Analysis By Market Taxonomy, 2018 to 2022 13.2. Market Size Value (US$ Million) & Volume (MT) Forecast By Market Taxonomy, 2023 to 2033 13.2.1. By Country 13.2.1.1. China 13.2.1.2. Japan 13.2.1.3. South Korea 13.2.2. By Capacity 13.2.3. By Product 13.2.4. By Use 13.2.5. By Application 13.3. Market Attractiveness Analysis 13.3.1. By Country 13.3.2. By Capacity 13.3.3. By Product 13.3.4. By Use 13.3.5. By Application 13.4. Key Takeaways 14. South Asia Market Analysis 2018 to 2022 and Forecast 2023 to 2033, By Country 14.1. Historical Market Size Value (US$ Million) & Volume (MT) Trend Analysis By Market Taxonomy, 2018 to 2022 14.2. Market Size Value (US$ Million) & Volume (MT) Forecast By Market Taxonomy, 2023 to 2033 14.2.1. By Country 14.2.1.1. India 14.2.1.2. Thailand 14.2.1.3. Malaysia 14.2.1.4. Indonesia 14.2.1.5. Rest of South Asia 14.2.2. By Capacity 14.2.3. By Product 14.2.4. By Use 14.2.5. By Application 14.3. Market Attractiveness Analysis 14.3.1. By Country 14.3.2. By Capacity 14.3.3. By Product 14.3.4. By Use 14.3.5. By Application 14.4. Key Takeaways 15. Oceania Market Analysis 2018 to 2022 and Forecast 2023 to 2033, By Country 15.1. Historical Market Size Value (US$ Million) & Volume (MT) Trend Analysis By Market Taxonomy, 2018 to 2022 15.2. Market Size Value (US$ Million) & Volume (MT) Forecast By Market Taxonomy, 2023 to 2033 15.2.1. By Country 15.2.1.1. Australia 15.2.1.2. New Zealand 15.2.2. By Capacity 15.2.3. By Product 15.2.4. By Use 15.2.5. By Application 15.3. Market Attractiveness Analysis 15.3.1. By Country 15.3.2. By Capacity 15.3.3. By Product 15.3.4. By Use 15.3.5. By Application 15.4. Key Takeaways 16. MEA Market Analysis 2018 to 2022 and Forecast 2023 to 2033, By Country 16.1. Historical Market Size Value (US$ Million) & Volume (MT) Trend Analysis By Market Taxonomy, 2018 to 2022 16.2. Market Size Value (US$ Million) & Volume (MT) Forecast By Market Taxonomy, 2023 to 2033 16.2.1. By Country 16.2.1.1. GCC Countries 16.2.1.2. South Africa 16.2.1.3. Central Africa 16.2.1.4. North Africa 16.2.2. By Capacity 16.2.3. By Product 16.2.4. By Use 16.2.5. By Application 16.3. Market Attractiveness Analysis 16.3.1. By Country 16.3.2. By Capacity 16.3.3. By Product 16.3.4. By Use 16.3.5. By Application 16.4. Key Takeaways 17. Key Countries Market Analysis 17.1. The US 17.1.1. Pricing Analysis 17.1.2. Market Share Analysis, 2022 17.1.2.1. By Capacity 17.1.2.2. By Product 17.1.2.3. By Use 17.1.2.4. By Application 17.2. Canada 17.2.1. Pricing Analysis 17.2.2. Market Share Analysis, 2022 17.2.2.1. By Capacity 17.2.2.2. By Product 17.2.2.3. By Use 17.2.2.4. By Application 17.3. Brazil 17.3.1. Pricing Analysis 17.3.2. Market Share Analysis, 2022 17.3.2.1. By Capacity 17.3.2.2. By Product 17.3.2.3. By Use 17.3.2.4. By Application 17.4. Mexico 17.4.1. Pricing Analysis 17.4.2. Market Share Analysis, 2022 17.4.2.1. By Capacity 17.4.2.2. By Product 17.4.2.3. By Use 17.4.2.4. By Application 17.5. Argentina 17.5.1. Pricing Analysis 17.5.2. Market Share Analysis, 2022 17.5.2.1. By Capacity 17.5.2.2. By Product 17.5.2.3. By Use 17.5.2.4. By Application 17.6. Chile 17.6.1. Pricing Analysis 17.6.2. Market Share Analysis, 2022 17.6.2.1. By Capacity 17.6.2.2. By Product 17.6.2.3. By Use 17.6.2.4. By Application 17.7. Peru 17.7.1. Pricing Analysis 17.7.2. Market Share Analysis, 2022 17.7.2.1. By Capacity 17.7.2.2. By Product 17.7.2.3. By Use 17.7.2.4. By Application 17.8. Germany 17.8.1. Pricing Analysis 17.8.2. Market Share Analysis, 2022 17.8.2.1. By Capacity 17.8.2.2. By Product 17.8.2.3. By Use 17.8.2.4. By Application 17.9. Italy 17.9.1. Pricing Analysis 17.9.2. Market Share Analysis, 2022 17.9.2.1. By Capacity 17.9.2.2. By Product 17.9.2.3. By Use 17.9.2.4. By Application 17.10. France 17.10.1. Pricing Analysis 17.10.2. Market Share Analysis, 2022 17.10.2.1. By Capacity 17.10.2.2. By Product 17.10.2.3. By Use 17.10.2.4. By Application 17.11. Spain 17.11.1. Pricing Analysis 17.11.2. Market Share Analysis, 2022 17.11.2.1. By Capacity 17.11.2.2. By Product 17.11.2.3. By Use 17.11.2.4. By Application 17.12. The UK 17.12.1. Pricing Analysis 17.12.2. Market Share Analysis, 2022 17.12.2.1. By Capacity 17.12.2.2. By Product 17.12.2.3. By Use 17.12.2.4. By Application 17.13. Russia 17.13.1. Pricing Analysis 17.13.2. Market Share Analysis, 2022 17.13.2.1. By Capacity 17.13.2.2. By Product 17.13.2.3. By Use 17.13.2.4. By Application 17.14. Poland 17.14.1. Pricing Analysis 17.14.2. Market Share Analysis, 2022 17.14.2.1. By Capacity 17.14.2.2. By Product 17.14.2.3. By Use 17.14.2.4. By Application 17.15. BENELUX 17.15.1. Pricing Analysis 17.15.2. Market Share Analysis, 2022 17.15.2.1. By Capacity 17.15.2.2. By Product 17.15.2.3. By Use 17.15.2.4. By Application 17.16. Nordic Countries 17.16.1. Pricing Analysis 17.16.2. Market Share Analysis, 2022 17.16.2.1. By Capacity 17.16.2.2. By Product 17.16.2.3. By Use 17.16.2.4. By Application 17.17. China 17.17.1. Pricing Analysis 17.17.2. Market Share Analysis, 2022 17.17.2.1. By Capacity 17.17.2.2. By Product 17.17.2.3. By Use 17.17.2.4. By Application 17.18. Japan 17.18.1. Pricing Analysis 17.18.2. Market Share Analysis, 2022 17.18.2.1. By Capacity 17.18.2.2. By Product 17.18.2.3. By Use 17.18.2.4. By Application 17.19. South Korea 17.19.1. Pricing Analysis 17.19.2. Market Share Analysis, 2022 17.19.2.1. By Capacity 17.19.2.2. By Product 17.19.2.3. By Use 17.19.2.4. By Application 17.20. India 17.20.1. Pricing Analysis 17.20.2. Market Share Analysis, 2022 17.20.2.1. By Capacity 17.20.2.2. By Product 17.20.2.3. By Use 17.20.2.4. By Application 17.21. Thailand 17.21.1. Pricing Analysis 17.21.2. Market Share Analysis, 2022 17.21.2.1. By Capacity 17.21.2.2. By Product 17.21.2.3. By Use 17.21.2.4. By Application 17.22. Indonesia 17.22.1. Pricing Analysis 17.22.2. Market Share Analysis, 2022 17.22.2.1. By Capacity 17.22.2.2. By Product 17.22.2.3. By Use 17.22.2.4. By Application 17.23. Malaysia 17.23.1. Pricing Analysis 17.23.2. Market Share Analysis, 2022 17.23.2.1. By Capacity 17.23.2.2. By Product 17.23.2.3. By Use 17.23.2.4. By Application 17.24. Singapore 17.24.1. Pricing Analysis 17.24.2. Market Share Analysis, 2022 17.24.2.1. By Capacity 17.24.2.2. By Product 17.24.2.3. By Use 17.24.2.4. By Application 17.25. GCC Countries 17.25.1. Pricing Analysis 17.25.2. Market Share Analysis, 2022 17.25.2.1. By Capacity 17.25.2.2. By Product 17.25.2.3. By Use 17.25.2.4. By Application 17.26. South Africa 17.26.1. Pricing Analysis 17.26.2. Market Share Analysis, 2022 17.26.2.1. By Capacity 17.26.2.2. By Product 17.26.2.3. By Use 17.26.2.4. By Application 17.27. Central Africa 17.27.1. Pricing Analysis 17.27.2. Market Share Analysis, 2022 17.27.2.1. By Capacity 17.27.2.2. By Product 17.27.2.3. By Use 17.27.2.4. By Application 17.28. North Africa 17.28.1. Pricing Analysis 17.28.2. Market Share Analysis, 2022 17.28.2.1. By Capacity 17.28.2.2. By Product 17.28.2.3. By Use 17.28.2.4. By Application 18. Market Structure Analysis 18.1. Competition Dashboard 18.2. Competition Benchmarking 18.3. Market Share Analysis of Top Players 18.3.1. By Regional 18.3.2. By Capacity 18.3.3. By Product 18.3.4. By Use 18.3.5. By Application 19. Competition Analysis 19.1. Competition Deep Dive 19.1.1. Emerson Electric Co. 19.1.1.1. Overview 19.1.1.2. Product Portfolio 19.1.1.3. Profitability by Market Segments 19.1.1.4. Sales Footprint 19.1.1.5. Strategy Overview 19.1.1.5.1. Marketing Strategy 19.1.1.5.2. Product Strategy 19.1.1.5.3. Channel Strategy 19.1.2. Oklin International 19.1.2.1. Overview 19.1.2.2. Product Portfolio 19.1.2.3. Profitability by Market Segments 19.1.2.4. Sales Footprint 19.1.2.5. Strategy Overview 19.1.2.5.1. Marketing Strategy 19.1.2.5.2. Product Strategy 19.1.2.5.3. Channel Strategy 19.1.3. Enic Co. Limited 19.1.3.1. Overview 19.1.3.2. Product Portfolio 19.1.3.3. Profitability by Market Segments 19.1.3.4. Sales Footprint 19.1.3.5. Strategy Overview 19.1.3.5.1. Marketing Strategy 19.1.3.5.2. Product Strategy 19.1.3.5.3. Channel Strategy 19.1.4. Hungry Giant Recycling 19.1.4.1. Overview 19.1.4.2. Product Portfolio 19.1.4.3. Profitability by Market Segments 19.1.4.4. Sales Footprint 19.1.4.5. Strategy Overview 19.1.4.5.1. Marketing Strategy 19.1.4.5.2. Product Strategy 19.1.4.5.3. Channel Strategy 19.1.5. Bhor Engineering Company 19.1.5.1. Overview 19.1.5.2. Product Portfolio 19.1.5.3. Profitability by Market Segments 19.1.5.4. Sales Footprint 19.1.5.5. Strategy Overview 19.1.5.5.1. Marketing Strategy 19.1.5.5.2. Product Strategy 19.1.5.5.3. Channel Strategy 19.1.6. Weimar Biotech 19.1.6.1. Overview 19.1.6.2. Product Portfolio 19.1.6.3. Profitability by Market Segments 19.1.6.4. Sales Footprint 19.1.6.5. Strategy Overview 19.1.6.5.1. Marketing Strategy 19.1.6.5.2. Product Strategy 19.1.6.5.3. Channel Strategy 19.1.7. IMC WasteStation 19.1.7.1. Overview 19.1.7.2. Product Portfolio 19.1.7.3. Profitability by Market Segments 19.1.7.4. Sales Footprint 19.1.7.5. Strategy Overview 19.1.7.5.1. Marketing Strategy 19.1.7.5.2. Product Strategy 19.1.7.5.3. Channel Strategy 19.1.8. Amey Engineers 19.1.8.1. Overview 19.1.8.2. Product Portfolio 19.1.8.3. Profitability by Market Segments 19.1.8.4. Sales Footprint 19.1.8.5. Strategy Overview 19.1.8.5.1. Marketing Strategy 19.1.8.5.2. Product Strategy 19.1.8.5.3. Channel Strategy 19.1.9. Bin Crusher 19.1.9.1. Overview 19.1.9.2. Product Portfolio 19.1.9.3. Profitability by Market Segments 19.1.9.4. Sales Footprint 19.1.9.5. Strategy Overview 19.1.9.5.1. Marketing Strategy 19.1.9.5.2. Product Strategy 19.1.9.5.3. Channel Strategy 19.1.10. Ridan Composting Ltd. 19.1.10.1. Overview 19.1.10.2. Product Portfolio 19.1.10.3. Profitability by Market Segments 19.1.10.4. Sales Footprint 19.1.10.5. Strategy Overview 19.1.10.5.1. Marketing Strategy 19.1.10.5.2. Product Strategy 19.1.10.5.3. Channel Strategy 19.1.11. Apollo Kitchen Equipment 19.1.11.1. Overview 19.1.11.2. Product Portfolio 19.1.11.3. Profitability by Market Segments 19.1.11.4. Sales Footprint 19.1.11.5. Strategy Overview 19.1.11.5.1. Marketing Strategy 19.1.11.5.2. Product Strategy 19.1.11.5.3. Channel Strategy 19.1.12. WasteCare Corporation 19.1.12.1. Overview 19.1.12.2. Product Portfolio 19.1.12.3. Profitability by Market Segments 19.1.12.4. Sales Footprint 19.1.12.5. Strategy Overview 19.1.12.5.1. Marketing Strategy 19.1.12.5.2. Product Strategy 19.1.12.5.3. Channel Strategy 19.1.13. MEIKO Clean Solutions (India) Pvt. Ltd. 19.1.13.1. Overview 19.1.13.2. Product Portfolio 19.1.13.3. Profitability by Market Segments 19.1.13.4. Sales Footprint 19.1.13.5. Strategy Overview 19.1.13.5.1. Marketing Strategy 19.1.13.5.2. Product Strategy 19.1.13.5.3. Channel Strategy 19.1.14. Komptech Americas, LLC 19.1.14.1. Overview 19.1.14.2. Product Portfolio 19.1.14.3. Profitability by Market Segments 19.1.14.4. Sales Footprint 19.1.14.5. Strategy Overview 19.1.14.5.1. Marketing Strategy 19.1.14.5.2. Product Strategy 19.1.14.5.3. Channel Strategy 19.1.15. Others (On Additional Request) 20. Assumptions & Acronyms Used 21. Research Methodology
Don't pay for what you don't need
Customize your report by selecting specific countries or regions and save 30%!
List of Tables
Table 1: Global Market Value (US$ Million) Forecast by Region, 2018 to 2033 Table 2: Global Market Volume (MT) Forecast by Region, 2018 to 2033 Table 3: Global Market Value (US$ Million) Forecast by Capacity, 2018 to 2033 Table 4: Global Market Volume (MT) Forecast by Capacity, 2018 to 2033 Table 5: Global Market Value (US$ Million) Forecast by Product, 2018 to 2033 Table 6: Global Market Volume (MT) Forecast by Product, 2018 to 2033 Table 7: Global Market Value (US$ Million) Forecast by Use, 2018 to 2033 Table 8: Global Market Volume (MT) Forecast by Use, 2018 to 2033 Table 9: Global Market Value (US$ Million) Forecast by Application, 2018 to 2033 Table 10: Global Market Volume (MT) Forecast by Application, 2018 to 2033 Table 11: North America Market Value (US$ Million) Forecast by Country, 2018 to 2033 Table 12: North America Market Volume (MT) Forecast by Country, 2018 to 2033 Table 13: North America Market Value (US$ Million) Forecast by Capacity, 2018 to 2033 Table 14: North America Market Volume (MT) Forecast by Capacity, 2018 to 2033 Table 15: North America Market Value (US$ Million) Forecast by Product, 2018 to 2033 Table 16: North America Market Volume (MT) Forecast by Product, 2018 to 2033 Table 17: North America Market Value (US$ Million) Forecast by Use, 2018 to 2033 Table 18: North America Market Volume (MT) Forecast by Use, 2018 to 2033 Table 19: North America Market Value (US$ Million) Forecast by Application, 2018 to 2033 Table 20: North America Market Volume (MT) Forecast by Application, 2018 to 2033 Table 21: Latin America Market Value (US$ Million) Forecast by Country, 2018 to 2033 Table 22: Latin America Market Volume (MT) Forecast by Country, 2018 to 2033 Table 23: Latin America Market Value (US$ Million) Forecast by Capacity, 2018 to 2033 Table 24: Latin America Market Volume (MT) Forecast by Capacity, 2018 to 2033 Table 25: Latin America Market Value (US$ Million) Forecast by Product, 2018 to 2033 Table 26: Latin America Market Volume (MT) Forecast by Product, 2018 to 2033 Table 27: Latin America Market Value (US$ Million) Forecast by Use, 2018 to 2033 Table 28: Latin America Market Volume (MT) Forecast by Use, 2018 to 2033 Table 29: Latin America Market Value (US$ Million) Forecast by Application, 2018 to 2033 Table 30: Latin America Market Volume (MT) Forecast by Application, 2018 to 2033 Table 31: Europe Market Value (US$ Million) Forecast by Country, 2018 to 2033 Table 32: Europe Market Volume (MT) Forecast by Country, 2018 to 2033 Table 33: Europe Market Value (US$ Million) Forecast by Capacity, 2018 to 2033 Table 34: Europe Market Volume (MT) Forecast by Capacity, 2018 to 2033 Table 35: Europe Market Value (US$ Million) Forecast by Product, 2018 to 2033 Table 36: Europe Market Volume (MT) Forecast by Product, 2018 to 2033 Table 37: Europe Market Value (US$ Million) Forecast by Use, 2018 to 2033 Table 38: Europe Market Volume (MT) Forecast by Use, 2018 to 2033 Table 39: Europe Market Value (US$ Million) Forecast by Application, 2018 to 2033 Table 40: Europe Market Volume (MT) Forecast by Application, 2018 to 2033 Table 41: East Asia Market Value (US$ Million) Forecast by Country, 2018 to 2033 Table 42: East Asia Market Volume (MT) Forecast by Country, 2018 to 2033 Table 43: East Asia Market Value (US$ Million) Forecast by Capacity, 2018 to 2033 Table 44: East Asia Market Volume (MT) Forecast by Capacity, 2018 to 2033 Table 45: East Asia Market Value (US$ Million) Forecast by Product, 2018 to 2033 Table 46: East Asia Market Volume (MT) Forecast by Product, 2018 to 2033 Table 47: East Asia Market Value (US$ Million) Forecast by Use, 2018 to 2033 Table 48: East Asia Market Volume (MT) Forecast by Use, 2018 to 2033 Table 49: East Asia Market Value (US$ Million) Forecast by Application, 2018 to 2033 Table 50: East Asia Market Volume (MT) Forecast by Application, 2018 to 2033 Table 51: South Asia Market Value (US$ Million) Forecast by Country, 2018 to 2033 Table 52: South Asia Market Volume (MT) Forecast by Country, 2018 to 2033 Table 53: South Asia Market Value (US$ Million) Forecast by Capacity, 2018 to 2033 Table 54: South Asia Market Volume (MT) Forecast by Capacity, 2018 to 2033 Table 55: South Asia Market Value (US$ Million) Forecast by Product, 2018 to 2033 Table 56: South Asia Market Volume (MT) Forecast by Product, 2018 to 2033 Table 57: South Asia Market Value (US$ Million) Forecast by Use, 2018 to 2033 Table 58: South Asia Market Volume (MT) Forecast by Use, 2018 to 2033 Table 59: South Asia Market Value (US$ Million) Forecast by Application, 2018 to 2033 Table 60: South Asia Market Volume (MT) Forecast by Application, 2018 to 2033 Table 61: Oceania Market Value (US$ Million) Forecast by Country, 2018 to 2033 Table 62: Oceania Market Volume (MT) Forecast by Country, 2018 to 2033 Table 63: Oceania Market Value (US$ Million) Forecast by Capacity, 2018 to 2033 Table 64: Oceania Market Volume (MT) Forecast by Capacity, 2018 to 2033 Table 65: Oceania Market Value (US$ Million) Forecast by Product, 2018 to 2033 Table 66: Oceania Market Volume (MT) Forecast by Product, 2018 to 2033 Table 67: Oceania Market Value (US$ Million) Forecast by Use, 2018 to 2033 Table 68: Oceania Market Volume (MT) Forecast by Use, 2018 to 2033 Table 69: Oceania Market Value (US$ Million) Forecast by Application, 2018 to 2033 Table 70: Oceania Market Volume (MT) Forecast by Application, 2018 to 2033 Table 71: MEA Market Value (US$ Million) Forecast by Country, 2018 to 2033 Table 72: MEA Market Volume (MT) Forecast by Country, 2018 to 2033 Table 73: MEA Market Value (US$ Million) Forecast by Capacity, 2018 to 2033 Table 74: MEA Market Volume (MT) Forecast by Capacity, 2018 to 2033 Table 75: MEA Market Value (US$ Million) Forecast by Product, 2018 to 2033 Table 76: MEA Market Volume (MT) Forecast by Product, 2018 to 2033 Table 77: MEA Market Value (US$ Million) Forecast by Use, 2018 to 2033 Table 78: MEA Market Volume (MT) Forecast by Use, 2018 to 2033 Table 79: MEA Market Value (US$ Million) Forecast by Application, 2018 to 2033 Table 80: MEA Market Volume (MT) Forecast by Application, 2018 to 2033
Find your sweet spots for generating winning opportunities in this market.
Talk to AnalystList of Charts
Figure 1: Global Market Value (US$ Million) by Capacity, 2023 to 2033 Figure 2: Global Market Value (US$ Million) by Product, 2023 to 2033 Figure 3: Global Market Value (US$ Million) by Use, 2023 to 2033 Figure 4: Global Market Value (US$ Million) by Application, 2023 to 2033 Figure 5: Global Market Value (US$ Million) by Region, 2023 to 2033 Figure 6: Global Market Value (US$ Million) Analysis by Region, 2018 to 2033 Figure 7: Global Market Volume (MT) Analysis by Region, 2018 to 2033 Figure 8: Global Market Value Share (%) and BPS Analysis by Region, 2023 to 2033 Figure 9: Global Market Y-o-Y Growth (%) Projections by Region, 2023 to 2033 Figure 10: Global Market Value (US$ Million) Analysis by Capacity, 2018 to 2033 Figure 11: Global Market Volume (MT) Analysis by Capacity, 2018 to 2033 Figure 12: Global Market Value Share (%) and BPS Analysis by Capacity, 2023 to 2033 Figure 13: Global Market Y-o-Y Growth (%) Projections by Capacity, 2023 to 2033 Figure 14: Global Market Value (US$ Million) Analysis by Product, 2018 to 2033 Figure 15: Global Market Volume (MT) Analysis by Product, 2018 to 2033 Figure 16: Global Market Value Share (%) and BPS Analysis by Product, 2023 to 2033 Figure 17: Global Market Y-o-Y Growth (%) Projections by Product, 2023 to 2033 Figure 18: Global Market Value (US$ Million) Analysis by Use, 2018 to 2033 Figure 19: Global Market Volume (MT) Analysis by Use, 2018 to 2033 Figure 20: Global Market Value Share (%) and BPS Analysis by Use, 2023 to 2033 Figure 21: Global Market Y-o-Y Growth (%) Projections by Use, 2023 to 2033 Figure 22: Global Market Value (US$ Million) Analysis by Application, 2018 to 2033 Figure 23: Global Market Volume (MT) Analysis by Application, 2018 to 2033 Figure 24: Global Market Value Share (%) and BPS Analysis by Application, 2023 to 2033 Figure 25: Global Market Y-o-Y Growth (%) Projections by Application, 2023 to 2033 Figure 26: Global Market Attractiveness by Capacity, 2023 to 2033 Figure 27: Global Market Attractiveness by Product, 2023 to 2033 Figure 28: Global Market Attractiveness by Use, 2023 to 2033 Figure 29: Global Market Attractiveness by Application, 2023 to 2033 Figure 30: Global Market Attractiveness by Region, 2023 to 2033 Figure 31: North America Market Value (US$ Million) by Capacity, 2023 to 2033 Figure 32: North America Market Value (US$ Million) by Product, 2023 to 2033 Figure 33: North America Market Value (US$ Million) by Use, 2023 to 2033 Figure 34: North America Market Value (US$ Million) by Application, 2023 to 2033 Figure 35: North America Market Value (US$ Million) by Country, 2023 to 2033 Figure 36: North America Market Value (US$ Million) Analysis by Country, 2018 to 2033 Figure 37: North America Market Volume (MT) Analysis by Country, 2018 to 2033 Figure 38: North America Market Value Share (%) and BPS Analysis by Country, 2023 to 2033 Figure 39: North America Market Y-o-Y Growth (%) Projections by Country, 2023 to 2033 Figure 40: North America Market Value (US$ Million) Analysis by Capacity, 2018 to 2033 Figure 41: North America Market Volume (MT) Analysis by Capacity, 2018 to 2033 Figure 42: North America Market Value Share (%) and BPS Analysis by Capacity, 2023 to 2033 Figure 43: North America Market Y-o-Y Growth (%) Projections by Capacity, 2023 to 2033 Figure 44: North America Market Value (US$ Million) Analysis by Product, 2018 to 2033 Figure 45: North America Market Volume (MT) Analysis by Product, 2018 to 2033 Figure 46: North America Market Value Share (%) and BPS Analysis by Product, 2023 to 2033 Figure 47: North America Market Y-o-Y Growth (%) Projections by Product, 2023 to 2033 Figure 48: North America Market Value (US$ Million) Analysis by Use, 2018 to 2033 Figure 49: North America Market Volume (MT) Analysis by Use, 2018 to 2033 Figure 50: North America Market Value Share (%) and BPS Analysis by Use, 2023 to 2033 Figure 51: North America Market Y-o-Y Growth (%) Projections by Use, 2023 to 2033 Figure 52: North America Market Value (US$ Million) Analysis by Application, 2018 to 2033 Figure 53: North America Market Volume (MT) Analysis by Application, 2018 to 2033 Figure 54: North America Market Value Share (%) and BPS Analysis by Application, 2023 to 2033 Figure 55: North America Market Y-o-Y Growth (%) Projections by Application, 2023 to 2033 Figure 56: North America Market Attractiveness by Capacity, 2023 to 2033 Figure 57: North America Market Attractiveness by Product, 2023 to 2033 Figure 58: North America Market Attractiveness by Use, 2023 to 2033 Figure 59: North America Market Attractiveness by Application, 2023 to 2033 Figure 60: North America Market Attractiveness by Country, 2023 to 2033 Figure 61: Latin America Market Value (US$ Million) by Capacity, 2023 to 2033 Figure 62: Latin America Market Value (US$ Million) by Product, 2023 to 2033 Figure 63: Latin America Market Value (US$ Million) by Use, 2023 to 2033 Figure 64: Latin America Market Value (US$ Million) by Application, 2023 to 2033 Figure 65: Latin America Market Value (US$ Million) by Country, 2023 to 2033 Figure 66: Latin America Market Value (US$ Million) Analysis by Country, 2018 to 2033 Figure 67: Latin America Market Volume (MT) Analysis by Country, 2018 to 2033 Figure 68: Latin America Market Value Share (%) and BPS Analysis by Country, 2023 to 2033 Figure 69: Latin America Market Y-o-Y Growth (%) Projections by Country, 2023 to 2033 Figure 70: Latin America Market Value (US$ Million) Analysis by Capacity, 2018 to 2033 Figure 71: Latin America Market Volume (MT) Analysis by Capacity, 2018 to 2033 Figure 72: Latin America Market Value Share (%) and BPS Analysis by Capacity, 2023 to 2033 Figure 73: Latin America Market Y-o-Y Growth (%) Projections by Capacity, 2023 to 2033 Figure 74: Latin America Market Value (US$ Million) Analysis by Product, 2018 to 2033 Figure 75: Latin America Market Volume (MT) Analysis by Product, 2018 to 2033 Figure 76: Latin America Market Value Share (%) and BPS Analysis by Product, 2023 to 2033 Figure 77: Latin America Market Y-o-Y Growth (%) Projections by Product, 2023 to 2033 Figure 78: Latin America Market Value (US$ Million) Analysis by Use, 2018 to 2033 Figure 79: Latin America Market Volume (MT) Analysis by Use, 2018 to 2033 Figure 80: Latin America Market Value Share (%) and BPS Analysis by Use, 2023 to 2033 Figure 81: Latin America Market Y-o-Y Growth (%) Projections by Use, 2023 to 2033 Figure 82: Latin America Market Value (US$ Million) Analysis by Application, 2018 to 2033 Figure 83: Latin America Market Volume (MT) Analysis by Application, 2018 to 2033 Figure 84: Latin America Market Value Share (%) and BPS Analysis by Application, 2023 to 2033 Figure 85: Latin America Market Y-o-Y Growth (%) Projections by Application, 2023 to 2033 Figure 86: Latin America Market Attractiveness by Capacity, 2023 to 2033 Figure 87: Latin America Market Attractiveness by Product, 2023 to 2033 Figure 88: Latin America Market Attractiveness by Use, 2023 to 2033 Figure 89: Latin America Market Attractiveness by Application, 2023 to 2033 Figure 90: Latin America Market Attractiveness by Country, 2023 to 2033 Figure 91: Europe Market Value (US$ Million) by Capacity, 2023 to 2033 Figure 92: Europe Market Value (US$ Million) by Product, 2023 to 2033 Figure 93: Europe Market Value (US$ Million) by Use, 2023 to 2033 Figure 94: Europe Market Value (US$ Million) by Application, 2023 to 2033 Figure 95: Europe Market Value (US$ Million) by Country, 2023 to 2033 Figure 96: Europe Market Value (US$ Million) Analysis by Country, 2018 to 2033 Figure 97: Europe Market Volume (MT) Analysis by Country, 2018 to 2033 Figure 98: Europe Market Value Share (%) and BPS Analysis by Country, 2023 to 2033 Figure 99: Europe Market Y-o-Y Growth (%) Projections by Country, 2023 to 2033 Figure 100: Europe Market Value (US$ Million) Analysis by Capacity, 2018 to 2033 Figure 101: Europe Market Volume (MT) Analysis by Capacity, 2018 to 2033 Figure 102: Europe Market Value Share (%) and BPS Analysis by Capacity, 2023 to 2033 Figure 103: Europe Market Y-o-Y Growth (%) Projections by Capacity, 2023 to 2033 Figure 104: Europe Market Value (US$ Million) Analysis by Product, 2018 to 2033 Figure 105: Europe Market Volume (MT) Analysis by Product, 2018 to 2033 Figure 106: Europe Market Value Share (%) and BPS Analysis by Product, 2023 to 2033 Figure 107: Europe Market Y-o-Y Growth (%) Projections by Product, 2023 to 2033 Figure 108: Europe Market Value (US$ Million) Analysis by Use, 2018 to 2033 Figure 109: Europe Market Volume (MT) Analysis by Use, 2018 to 2033 Figure 110: Europe Market Value Share (%) and BPS Analysis by Use, 2023 to 2033 Figure 111: Europe Market Y-o-Y Growth (%) Projections by Use, 2023 to 2033 Figure 112: Europe Market Value (US$ Million) Analysis by Application, 2018 to 2033 Figure 113: Europe Market Volume (MT) Analysis by Application, 2018 to 2033 Figure 114: Europe Market Value Share (%) and BPS Analysis by Application, 2023 to 2033 Figure 115: Europe Market Y-o-Y Growth (%) Projections by Application, 2023 to 2033 Figure 116: Europe Market Attractiveness by Capacity, 2023 to 2033 Figure 117: Europe Market Attractiveness by Product, 2023 to 2033 Figure 118: Europe Market Attractiveness by Use, 2023 to 2033 Figure 119: Europe Market Attractiveness by Application, 2023 to 2033 Figure 120: Europe Market Attractiveness by Country, 2023 to 2033 Figure 121: East Asia Market Value (US$ Million) by Capacity, 2023 to 2033 Figure 122: East Asia Market Value (US$ Million) by Product, 2023 to 2033 Figure 123: East Asia Market Value (US$ Million) by Use, 2023 to 2033 Figure 124: East Asia Market Value (US$ Million) by Application, 2023 to 2033 Figure 125: East Asia Market Value (US$ Million) by Country, 2023 to 2033 Figure 126: East Asia Market Value (US$ Million) Analysis by Country, 2018 to 2033 Figure 127: East Asia Market Volume (MT) Analysis by Country, 2018 to 2033 Figure 128: East Asia Market Value Share (%) and BPS Analysis by Country, 2023 to 2033 Figure 129: East Asia Market Y-o-Y Growth (%) Projections by Country, 2023 to 2033 Figure 130: East Asia Market Value (US$ Million) Analysis by Capacity, 2018 to 2033 Figure 131: East Asia Market Volume (MT) Analysis by Capacity, 2018 to 2033 Figure 132: East Asia Market Value Share (%) and BPS Analysis by Capacity, 2023 to 2033 Figure 133: East Asia Market Y-o-Y Growth (%) Projections by Capacity, 2023 to 2033 Figure 134: East Asia Market Value (US$ Million) Analysis by Product, 2018 to 2033 Figure 135: East Asia Market Volume (MT) Analysis by Product, 2018 to 2033 Figure 136: East Asia Market Value Share (%) and BPS Analysis by Product, 2023 to 2033 Figure 137: East Asia Market Y-o-Y Growth (%) Projections by Product, 2023 to 2033 Figure 138: East Asia Market Value (US$ Million) Analysis by Use, 2018 to 2033 Figure 139: East Asia Market Volume (MT) Analysis by Use, 2018 to 2033 Figure 140: East Asia Market Value Share (%) and BPS Analysis by Use, 2023 to 2033 Figure 141: East Asia Market Y-o-Y Growth (%) Projections by Use, 2023 to 2033 Figure 142: East Asia Market Value (US$ Million) Analysis by Application, 2018 to 2033 Figure 143: East Asia Market Volume (MT) Analysis by Application, 2018 to 2033 Figure 144: East Asia Market Value Share (%) and BPS Analysis by Application, 2023 to 2033 Figure 145: East Asia Market Y-o-Y Growth (%) Projections by Application, 2023 to 2033 Figure 146: East Asia Market Attractiveness by Capacity, 2023 to 2033 Figure 147: East Asia Market Attractiveness by Product, 2023 to 2033 Figure 148: East Asia Market Attractiveness by Use, 2023 to 2033 Figure 149: East Asia Market Attractiveness by Application, 2023 to 2033 Figure 150: East Asia Market Attractiveness by Country, 2023 to 2033 Figure 151: South Asia Market Value (US$ Million) by Capacity, 2023 to 2033 Figure 152: South Asia Market Value (US$ Million) by Product, 2023 to 2033 Figure 153: South Asia Market Value (US$ Million) by Use, 2023 to 2033 Figure 154: South Asia Market Value (US$ Million) by Application, 2023 to 2033 Figure 155: South Asia Market Value (US$ Million) by Country, 2023 to 2033 Figure 156: South Asia Market Value (US$ Million) Analysis by Country, 2018 to 2033 Figure 157: South Asia Market Volume (MT) Analysis by Country, 2018 to 2033 Figure 158: South Asia Market Value Share (%) and BPS Analysis by Country, 2023 to 2033 Figure 159: South Asia Market Y-o-Y Growth (%) Projections by Country, 2023 to 2033 Figure 160: South Asia Market Value (US$ Million) Analysis by Capacity, 2018 to 2033 Figure 161: South Asia Market Volume (MT) Analysis by Capacity, 2018 to 2033 Figure 162: South Asia Market Value Share (%) and BPS Analysis by Capacity, 2023 to 2033 Figure 163: South Asia Market Y-o-Y Growth (%) Projections by Capacity, 2023 to 2033 Figure 164: South Asia Market Value (US$ Million) Analysis by Product, 2018 to 2033 Figure 165: South Asia Market Volume (MT) Analysis by Product, 2018 to 2033 Figure 166: South Asia Market Value Share (%) and BPS Analysis by Product, 2023 to 2033 Figure 167: South Asia Market Y-o-Y Growth (%) Projections by Product, 2023 to 2033 Figure 168: South Asia Market Value (US$ Million) Analysis by Use, 2018 to 2033 Figure 169: South Asia Market Volume (MT) Analysis by Use, 2018 to 2033 Figure 170: South Asia Market Value Share (%) and BPS Analysis by Use, 2023 to 2033 Figure 171: South Asia Market Y-o-Y Growth (%) Projections by Use, 2023 to 2033 Figure 172: South Asia Market Value (US$ Million) Analysis by Application, 2018 to 2033 Figure 173: South Asia Market Volume (MT) Analysis by Application, 2018 to 2033 Figure 174: South Asia Market Value Share (%) and BPS Analysis by Application, 2023 to 2033 Figure 175: South Asia Market Y-o-Y Growth (%) Projections by Application, 2023 to 2033 Figure 176: South Asia Market Attractiveness by Capacity, 2023 to 2033 Figure 177: South Asia Market Attractiveness by Product, 2023 to 2033 Figure 178: South Asia Market Attractiveness by Use, 2023 to 2033 Figure 179: South Asia Market Attractiveness by Application, 2023 to 2033 Figure 180: South Asia Market Attractiveness by Country, 2023 to 2033 Figure 181: Oceania Market Value (US$ Million) by Capacity, 2023 to 2033 Figure 182: Oceania Market Value (US$ Million) by Product, 2023 to 2033 Figure 183: Oceania Market Value (US$ Million) by Use, 2023 to 2033 Figure 184: Oceania Market Value (US$ Million) by Application, 2023 to 2033 Figure 185: Oceania Market Value (US$ Million) by Country, 2023 to 2033 Figure 186: Oceania Market Value (US$ Million) Analysis by Country, 2018 to 2033 Figure 187: Oceania Market Volume (MT) Analysis by Country, 2018 to 2033 Figure 188: Oceania Market Value Share (%) and BPS Analysis by Country, 2023 to 2033 Figure 189: Oceania Market Y-o-Y Growth (%) Projections by Country, 2023 to 2033 Figure 190: Oceania Market Value (US$ Million) Analysis by Capacity, 2018 to 2033 Figure 191: Oceania Market Volume (MT) Analysis by Capacity, 2018 to 2033 Figure 192: Oceania Market Value Share (%) and BPS Analysis by Capacity, 2023 to 2033 Figure 193: Oceania Market Y-o-Y Growth (%) Projections by Capacity, 2023 to 2033 Figure 194: Oceania Market Value (US$ Million) Analysis by Product, 2018 to 2033 Figure 195: Oceania Market Volume (MT) Analysis by Product, 2018 to 2033 Figure 196: Oceania Market Value Share (%) and BPS Analysis by Product, 2023 to 2033 Figure 197: Oceania Market Y-o-Y Growth (%) Projections by Product, 2023 to 2033 Figure 198: Oceania Market Value (US$ Million) Analysis by Use, 2018 to 2033 Figure 199: Oceania Market Volume (MT) Analysis by Use, 2018 to 2033 Figure 200: Oceania Market Value Share (%) and BPS Analysis by Use, 2023 to 2033 Figure 201: Oceania Market Y-o-Y Growth (%) Projections by Use, 2023 to 2033 Figure 202: Oceania Market Value (US$ Million) Analysis by Application, 2018 to 2033 Figure 203: Oceania Market Volume (MT) Analysis by Application, 2018 to 2033 Figure 204: Oceania Market Value Share (%) and BPS Analysis by Application, 2023 to 2033 Figure 205: Oceania Market Y-o-Y Growth (%) Projections by Application, 2023 to 2033 Figure 206: Oceania Market Attractiveness by Capacity, 2023 to 2033 Figure 207: Oceania Market Attractiveness by Product, 2023 to 2033 Figure 208: Oceania Market Attractiveness by Use, 2023 to 2033 Figure 209: Oceania Market Attractiveness by Application, 2023 to 2033 Figure 210: Oceania Market Attractiveness by Country, 2023 to 2033 Figure 211: MEA Market Value (US$ Million) by Capacity, 2023 to 2033 Figure 212: MEA Market Value (US$ Million) by Product, 2023 to 2033 Figure 213: MEA Market Value (US$ Million) by Use, 2023 to 2033 Figure 214: MEA Market Value (US$ Million) by Application, 2023 to 2033 Figure 215: MEA Market Value (US$ Million) by Country, 2023 to 2033 Figure 216: MEA Market Value (US$ Million) Analysis by Country, 2018 to 2033 Figure 217: MEA Market Volume (MT) Analysis by Country, 2018 to 2033 Figure 218: MEA Market Value Share (%) and BPS Analysis by Country, 2023 to 2033 Figure 219: MEA Market Y-o-Y Growth (%) Projections by Country, 2023 to 2033 Figure 220: MEA Market Value (US$ Million) Analysis by Capacity, 2018 to 2033 Figure 221: MEA Market Volume (MT) Analysis by Capacity, 2018 to 2033 Figure 222: MEA Market Value Share (%) and BPS Analysis by Capacity, 2023 to 2033 Figure 223: MEA Market Y-o-Y Growth (%) Projections by Capacity, 2023 to 2033 Figure 224: MEA Market Value (US$ Million) Analysis by Product, 2018 to 2033 Figure 225: MEA Market Volume (MT) Analysis by Product, 2018 to 2033 Figure 226: MEA Market Value Share (%) and BPS Analysis by Product, 2023 to 2033 Figure 227: MEA Market Y-o-Y Growth (%) Projections by Product, 2023 to 2033 Figure 228: MEA Market Value (US$ Million) Analysis by Use, 2018 to 2033 Figure 229: MEA Market Volume (MT) Analysis by Use, 2018 to 2033 Figure 230: MEA Market Value Share (%) and BPS Analysis by Use, 2023 to 2033 Figure 231: MEA Market Y-o-Y Growth (%) Projections by Use, 2023 to 2033 Figure 232: MEA Market Value (US$ Million) Analysis by Application, 2018 to 2033 Figure 233: MEA Market Volume (MT) Analysis by Application, 2018 to 2033 Figure 234: MEA Market Value Share (%) and BPS Analysis by Application, 2023 to 2033 Figure 235: MEA Market Y-o-Y Growth (%) Projections by Application, 2023 to 2033 Figure 236: MEA Market Attractiveness by Capacity, 2023 to 2033 Figure 237: MEA Market Attractiveness by Product, 2023 to 2033 Figure 238: MEA Market Attractiveness by Use, 2023 to 2033 Figure 239: MEA Market Attractiveness by Application, 2023 to 2033 Figure 240: MEA Market Attractiveness by Country, 2023 to 2033
Explore Process Automation Insights
View Reports