Glass Container Market
Stylish Glass Container for Food Packaging Attract Consumers by its Luxury and Aesthetic Look. FMI Track More Trends with the United States, France, the United Kingdom, and 20+ More Countries
Glass Containers Market By Product Type (Glass Bottle, Glass Jar, Glass Vial, Candle Glass Container), By Color (Amber Glass Container, Blue Glass Container, Clear Glass Container, Frosted Glass Container, Other Colored Glass Container), By End-use Industry (Cosmetic & Perfumes, Pharmaceuticals, Food Packaging, Beverage Packaging, Other Products), Regional Forecast Till 2033
Glass Container Market Outlook
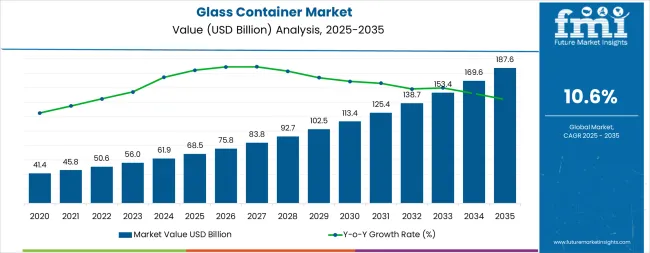
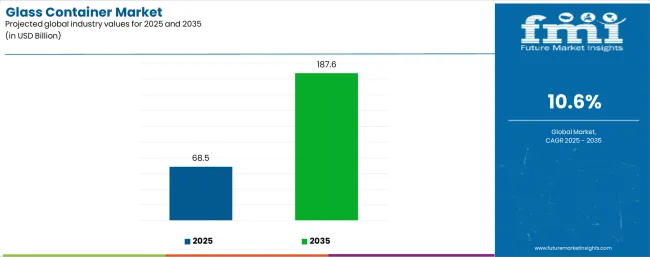
The glass container market is predicted to capture a valuation of US$ 61.5 billion in 2023 and is estimated to rise to US$ 102.5 billion by 2033. The market is anticipated at a CAGR of 5.2% during the forecast period.
Factors influencing the market are as follows:
- Rising disposable income, urbanization, and consumers' preference for aesthetics are accelerating the demand for glass containers.
- Increasing demand for home decor, luxury looks, and eye-catching surroundings is rising the adoption of glass containers.
- The demand for glass containers is significantly growing by end-users for light glittering bottles and candle jars, which in turn fueling the market growth.
- Consumers’ demand for a glass container to preserve food items such as pickles, sauces, and other ingredients to enhance their quality fuels the market growth further.
- Food & beverage manufacturers have increased the adoption of glass containers to provide transparency in packaging food items.
- Growing trends of several design containers and rising key marketers are propelling market opportunities.
- Dairy owners are increasing the adoption of glass container bottles to sell milk, and related products are advancing the market.
- The rising number of cheap labor, investment, and research & development activities are driving the market opportunities.
Let us know your requirement to get
100% FREE customization
Manufacturers Increase the Adoption of Glass Container for Premium Packaging
Manufacturers are increasing the adoption of several types of glass containers for the aesthetic look, which is propelling market expansion. Manufacturers in the packaging industry are also using glass containers for premium product quality, which is fueling the market expansion. For example, in September 2019, Ardagh Group S.A. announced its new product launch- a luxury wine bottle for the Allure Winery.
The United Kingdom-based company- Allied Glass Containers Ltd develops luxury glass bottles for the personal care, cosmetic, and food & beverages sectors. According to a report by FEVE.org, glass containers acquired more than half of the share in the luxury packaging market. The demand for glass container bottles in the liquor industry is driving market expansion. According to market vendors, glass containers and bottles are impossible to replace for luxury applications.
Attributes |
Details |
Market CAGR (2023 to 2033) |
5.2% |
Market Valuation (2023) |
US$ 61.5 billion |
Market Valuation (2033) |
US$ 102.5 billion |
Glass Container Market, 2017 to 2022 Historical Sales, Compared to 2023 to 2033 Future Outlook
According to Future Market Insights, the global glass container market is predicted at a healthy 5.2% CAGR during the forecast period. Historically, the market registered a CAGR of 4.1% between 2017 and 2022.
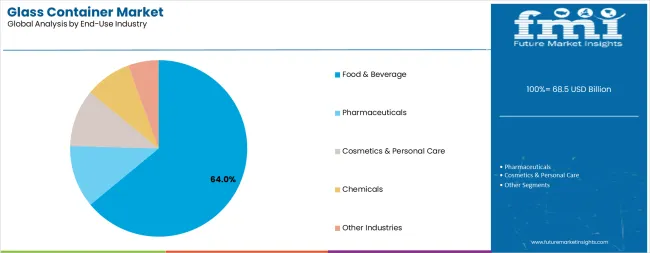
The rising production of glass container and bottles are growing in the food & beverages sector and the alcoholic industry to sell several drinks and food items. The beverages industry dominates the global market by securing a maximum share during the forecast period. The adoption of glass containers and bottles to serve beverages, including juice, beer, and alcohol, in restaurants and hotels is further bolstering the market size.
Innovation of lightweight and attractive design products at low production costs by manufacturers is driving market growth. With the adoption of advanced technology, consumers' demand for customized and highly standardized glass containers is surging the glass container market opportunities.
The market is estimated to reach US$ 102.5 billion during the forecast period. Historically, the market stood at US$ 59.1 billion from 2017 to 2022.
Find your sweet spots for generating winning opportunities in this market.
Talk to AnalystComparative Analysis of Adjacent Markets
Glass Container Market:
Attributes |
Glass Container Market |
CAGR (2023 to 2033) |
5.2% |
Value (2023) |
US$ 61.5 billion |
Value (2033) |
US$ 102.5 billion |
Trends |
Rising demand for home decor, aesthetic look, and changing lifestyle. |
Opportunities |
Growing demand for advanced technology and preserved food items to maintain their quality. |
Glass Pasteur Pipettes Market:
Attributes |
Glass Pasteur Pipettes Market |
CAGR (2023 to 2033) |
3.3% |
Value (2023) |
US$ 0.98 billion |
Value (2033) |
US$ 1.36 billion |
Trends |
Growing awareness related to sustainable and scientific instruments. |
Opportunities |
Rapidly growing the healthcare sector and government initiatives. |
Container Liner Market:
Attributes |
Container Liner Market |
CAGR (2023 to 2033) |
4.7% |
Value (2023) |
US$ 0.92 billion |
Value (2033) |
US$ 1.45 billion |
Trends |
Rising transportation, urbanization, and disposable income. |
Opportunities |
Growing international trade, recyclable practice, and several prominent players. |
Top Segments in the Market
Segments | Color |
Top Categories | Amber Glass Container |
Historic CAGR | 4.0% |
Forecast CAGR | 5.2% |
Segments | End Use |
Top Categories | Beverage Packaging |
Historic CAGR | 3.8% |
Forecast CAGR | 4.7% |
Segments | Product Type |
Top Categories | Glass Bottles |
Historic CAGR | 3.2% |
Forecast CAGR | 8.4% |
The glass Bottles Category is Trending in the Product Type Segment
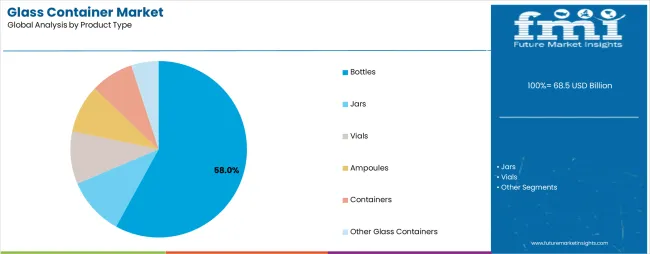
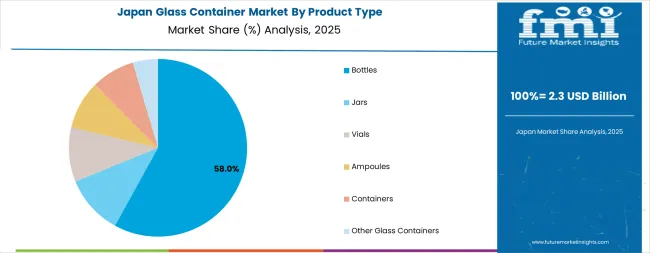
Based on product type, glass bottles dominate the global market by securing a CAGR of 8.4% during the forecast period. In 2021, around 69% of glass bottles were sold, driving the huge market growth. The end-user industries, including pharmaceuticals and beverages, prefer using glass bottles for packaging. It is one of the eco-friendly and cost-effective solutions likely to fuel global market expansion.
Other categories, such as glass jars, vials, and candle glass containers, also capture a significant share of the global market. Square bottles and sauce bottles collect around 1/3 of the global market share due to their extensive use in the food & beverage sector. In the historic period, glass bottles secured a CAGR of 3.2% between 2017 and 2022.
Beverage Packaging Drives the End-use Industry
Based on the end-use segment, beverage packaging leads the global market by securing a CAGR of 4.7% during the forecast period. Consumption of beverages, including beer, vodka, and cold drinks, is rising the demand for beverage packaging. Growing consumer demand for sustainable; premium packaging is further increasing the adoption of beverage packaging.
Alcoholic beverages still acquire a significant share of the global market. Countries including China, India, and the United Kingdom are rising consumption of alcohol. In the historical period, beverage packaging captured a CAGR of 3.8% between 2017 and 2022.
Which Color Segment Dominates the Global Market?
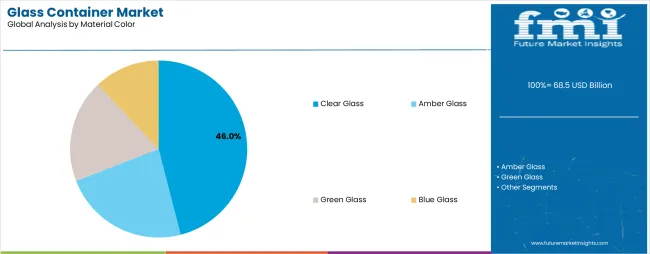
Based on the color segment, amber glass container dominates the global market by registering a CAGR of 5.2% during the forecast period. End-users are in rising demand for amber glass containers as they protect against light wavelengths and UV radiations and protect the product inside the glass container. The adoption of the amber glass container is to grow significantly in the coming years.
The pharmaceuticals and beverages sector is highly increasing the adoption of amber glass containers that upsurge the market growth further. In the historic period, the amber glass container secured a CAGR of 4.0% between 2017 and 2022.

A unified Market Research Subscription Platform, built for today's disparate research needs.
Top Countries Influencing the Global Market
Countries | United States |
Historic CAGR (2017 to 2022) | 4.7% |
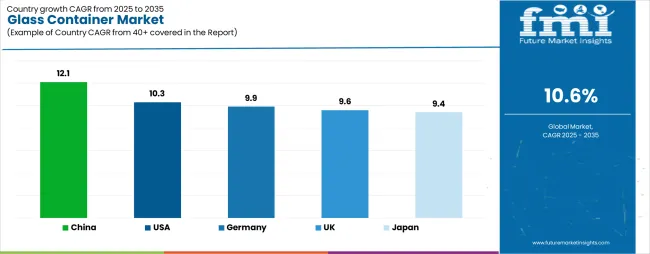
Forecast CAGR (2023 to 2033) | 5% |
Forecast Valuation (2033) | US$ 150 billion |
Countries | United Kingdom |
Historic CAGR (2017 to 2022) | 4.1% |
Forecast CAGR (2023 to 2033) | 4.8% |
Forecast Valuation (2033) | US$ 11.2 billion |
Countries | Germany |
Historic CAGR (2017 to 2022) | 4.6% |
Forecast CAGR (2023 to 2033) | 4.5% |
Forecast Valuation (2033) | US$ 6.2 billion |
Rising Consumption of Alcohol Drives the United States Market
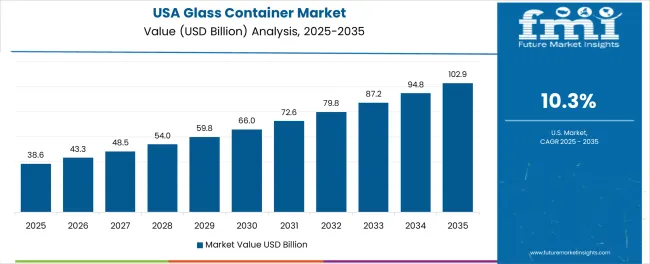
The United States secures a CAGR of 5% with a valuation of US$ 150 billion during the forecast period. The United States holds a maximum share due to several existing prominent vendors. According to National Survey on Drug Use and Health, around 86% of 18 years old population in the United States consume alcohol occasionally.
The manufacturers are developing different shapes and sizes of glass containers and are estimated to upsurge the market expansion in the United States. The leading companies investing huge amounts in the United States market are Nestle, SABMiller, Carlsberg, PepsiCo, Diageo, MillerCoors, and Saxco International. In the historic period, the United States glass container market secured a CAGR of 4.7% between 2017 and 2022.
Increasing Production of Glass Containers Surges the United Kingdom Market
The United Kingdom is capturing a CAGR of 4.8% with a valuation of US$ 11.2 billion during the forecast period. Manufacturers are growing the production of glass containers fueling the food & beverages sector in the United Kingdom. Increasing the consumption of alcoholic beverages in the country propels the market growth. In history, the United Kingdom glass container market captured a CAGR of 4.1% between 2017 and 2022.
Germany is another nation in Europe that accounts for a maximum share after the United Kingdom. According to American Addiction Centers, an average German citizen consumes around 11.3 liters of alcoholic beverages yearly. According to Organization for Economic Development and Cooperation, the distribution of alcohol is relatively high in the country.
Growing Investment in Beverage Sector Propelsl China Market
China is a prominently growing country registering a significant share during the forecast period globally. The rising demand for beer and other beverages is expanding China's hotel and restaurant sector. China contributes to nearly 20% of beer consumption in the global market.
Increasing healthcare, pharmaceuticals, and alcohol industries are creating lucrative market opportunities in China. As per a report by the World Bank, in 2018, China captured 5.35% of the GDP through the healthcare sector. According to WHO (World Health Organization), China is a significant nation that is significantly growing healthcare expenditure in the global market. Therefore, the demand for glass containers is propelling the market in China.
Rising Demand for Cosmetic Products Fueling France Market
France is one of the significant nations that secures a relevant share of the global market during the forecast period. The increasing demand for luxury items such as cosmetics, perfume, and other beauty items is rising in the France glass container market. France is a prominent nation in cosmetic and perfume leader.
According to a report by International Fragrance Associations, the nation contributed a share of 25% on cosmetic products in 2019. The leading international brands in France include Yves Rocher, Paco Rabanne, Kering S.A., and L'Oréal. Therefore, the nation is continuously driving global market expansion.
The rising demand for the packaging of beverages and soft drinks is accelerating the demand for glass containers in France. These factors are surging the alcoholic sector in France.
Competitive Landscape
The prominent players are focusing on consumer demand and developing innovative products. These players are developing environment-friendly, sustainable premium products that desire consumers' expectations. The top multinational companies and vendors are investing a maximum amount in research & development activities to expand the global market.
Key players are adopting various marketing strategies to upsurge the global market. Through their distribution channels, they acquire maximum profits and enhance brand value. Moreover, the marketing methodologies adopted by these players are acquisitions, mergers, partnerships, agreements, product launches, and collaborations.
Other Players working in the Market are
- Ardagh Group S.A
- Amcor Plc
- Consol Glass (Pty) Ltd
- Owens-Illinois, Inc.
- Saverglass Group
- BA Glass
- Hindusthan National Glass & Industries Limited
- Nampak Ltd
- Wiegand-Glas
- Vidrala S.A.
Recent Developments in the Glass Container Market
- In Jan 2020, a significant producer of wine glass bottles- Ardagh Group S.A., launched its new products in the United States. The company announced its latest six-wine bottle design.
- In Nov 2019, Owens-Illinois announced its new glass collection center. The glass specialty was gathered by O-I and shipped for further processing at the Rumpke recycling plant.
Scope of Report
Attribute |
Details |
Forecast Period |
2023 to 2033 |
Historical Data Available for |
2017 to 2022 |
Market Analysis |
US$ billion for Value |
Key Countries Covered |
United States, Canada, Germany, United Kingdom., France, Italy, Spain, Russia, China, Japan, South Korea, India, Thailand, Malaysia, Indonesia, Australia, New Zealand, GCC Countries, Northern Africa, South Africa, and Türkiye |
Key Segments Covered |
|
Key Companies Profiled |
|
Report Coverage |
Market Forecast, Company Share Analysis, Competition Intelligence, DROT Analysis, Market Dynamics and Challenges, and Strategic Growth Initiatives |
Customization & Pricing |
Available upon Request |
Glass Container Market Segmentation by Category:
By Product Type:
- Glass Bottle
- Glass Jar
- Glass Vial
- Candle Glass Container
By Color:
- Amber Glass Container
- Blue Glass Container
- Clear Glass Container
- Frosted Glass Container
- Other Colored Glass Container
By End-use Industry:
- Cosmetic & Perfumes
- Pharmaceuticals
- Food Packaging
- Beverage Packaging
- Other Products
By Region:
- North America
- Latin America
- Europe
- South Asia & Pacific
- East Asia
- The Middle East & Africa (MEA)
Frequently Asked Questions
The glass container market is predicted to expand at 5.2% CAGR through 2033.
The beverage packaging sector drives the glass container market.
The glass container market is expected to surpass US$ 102.5 billion by 2033.
The glass container market is anticipated to be US$ 61.5 billion in 2023.
The United States leads the glass container market.
Table of Content
1. Executive Summary | Glass Container Market
1.1. Global Market Outlook
1.2. Demand-side Trends
1.3. Supply-side Trends
1.4. Technology Roadmap Analysis
1.5. Analysis and Recommendations
2. Market Overview
2.1. Market Coverage / Taxonomy
2.2. Market Definition / Scope / Limitations
3. Market Background
3.1. Market Dynamics
3.1.1. Drivers
3.1.2. Restraints
3.1.3. Opportunity
3.1.4. Trends
3.2. Scenario Forecast
3.2.1. Demand in Optimistic Scenario
3.2.2. Demand in Likely Scenario
3.2.3. Demand in Conservative Scenario
3.3. Opportunity Map Analysis
3.4. Product Life Cycle Analysis
3.5. Supply Chain Analysis
3.5.1. Supply Side Participants and their Roles
3.5.1.1. Producers
3.5.1.2. Mid-Level Participants (Traders/ Agents/ Brokers)
3.5.1.3. Wholesalers and Distributors
3.5.2. Value Added and Value Created at Node in the Supply Chain
3.5.3. List of Raw Material Suppliers
3.5.4. List of Existing and Potential Buyer’s
3.6. Investment Feasibility Matrix
3.7. Value Chain Analysis
3.7.1. Profit Margin Analysis
3.7.2. Wholesalers and Distributors
3.7.3. Retailers
3.8. PESTLE and Porter’s Analysis
3.9. Regulatory Landscape
3.9.1. By Key Regions
3.9.2. By Key Countries
3.10. Regional Parent Market Outlook
3.11. Production and Consumption Statistics
3.12. Import and Export Statistics
4. Global Market Analysis 2017 to 2022 and Forecast, 2023 to 2033
4.1. Historical Market Size Value (US$ Million) & Volume (Units) Analysis, 2017 to 2022
4.2. Current and Future Market Size Value (US$ Million) & Volume (Units) Projections, 2023 to 2033
4.2.1. Y-o-Y Growth Trend Analysis
4.2.2. Absolute $ Opportunity Analysis
5. Global Market Analysis 2017 to 2022 and Forecast 2023 to 2033, By Grade
5.1. Introduction / Key Findings
5.2. Historical Market Size Value (US$ Million) & Volume (Units) Analysis By Grade, 2017 to 2022
5.3. Current and Future Market Size Value (US$ Million) & Volume (Units) Analysis and Forecast By Grade, 2023 to 2033
5.3.1. Type I
5.3.2. Type II
5.3.3. Type III
5.4. Y-o-Y Growth Trend Analysis By Grade, 2017 to 2022
5.5. Absolute $ Opportunity Analysis By Grade, 2023 to 2033
6. Global Market Analysis 2017 to 2022 and Forecast 2023 to 2033, By Manufacturing Process
6.1. Introduction / Key Findings
6.2. Historical Market Size Value (US$ Million) & Volume (Units) Analysis By Manufacturing Process, 2017 to 2022
6.3. Current and Future Market Size Value (US$ Million) & Volume (Units) Analysis and Forecast By Manufacturing Process, 2023 to 2033
6.3.1. Blown
6.3.2. Tubing
6.4. Y-o-Y Growth Trend Analysis By Manufacturing Process, 2017 to 2022
6.5. Absolute $ Opportunity Analysis By Manufacturing Process, 2023 to 2033
7. Global Market Analysis 2017 to 2022 and Forecast 2023 to 2033, By Capacity
7.1. Introduction / Key Findings
7.2. Historical Market Size Value (US$ Million) & Volume (Units) Analysis By Capacity, 2017 to 2022
7.3. Current and Future Market Size Value (US$ Million) & Volume (Units) Analysis and Forecast By Capacity, 2023 to 2033
7.3.1. Up to 50 ml
7.3.2. 51 - 200 ml
7.3.3. 201 - 500 ml
7.3.4. 501 - 1000 ml
7.3.5. 1001 ml & Above
7.4. Y-o-Y Growth Trend Analysis By Capacity, 2017 to 2022
7.5. Absolute $ Opportunity Analysis By Capacity, 2023 to 2033
8. Global Market Analysis 2017 to 2022 and Forecast 2023 to 2033, By End User
8.1. Introduction / Key Findings
8.2. Historical Market Size Value (US$ Million) & Volume (Units) Analysis By End User, 2017 to 2022
8.3. Current and Future Market Size Value (US$ Million) & Volume (Units) Analysis and Forecast By End User, 2023 to 2033
8.3.1. Food
8.3.2. Beverages
8.3.3. Pharmaceuticals
8.3.4. Personal Care & Cosmetics
8.3.5. Perfume & Fragrances
8.3.6. Chemicals
8.3.7. Others
8.4. Y-o-Y Growth Trend Analysis By End User, 2017 to 2022
8.5. Absolute $ Opportunity Analysis By End User, 2023 to 2033
9. Global Market Analysis 2017 to 2022 and Forecast 2023 to 2033, By Region
9.1. Introduction
9.2. Historical Market Size Value (US$ Million) & Volume (Units) Analysis By Region, 2017 to 2022
9.3. Current Market Size Value (US$ Million) & Volume (Units) Analysis and Forecast By Region, 2023 to 2033
9.3.1. North America
9.3.2. Latin America
9.3.3. Europe
9.3.4. East Asia
9.3.5. South Asia
9.3.6. Oceania
9.3.7. MEA
9.4. Market Attractiveness Analysis By Region
10. North America Market Analysis 2017 to 2022 and Forecast 2023 to 2033, By Country
10.1. Historical Market Size Value (US$ Million) & Volume (Units) Trend Analysis By Market Taxonomy, 2017 to 2022
10.2. Market Size Value (US$ Million) & Volume (Units) Forecast By Market Taxonomy, 2023 to 2033
10.2.1. By Country
10.2.1.1. The USA
10.2.1.2. Canada
10.2.2. By Grade
10.2.3. By Manufacturing Process
10.2.4. By Capacity
10.2.5. By End User
10.3. Market Attractiveness Analysis
10.3.1. By Country
10.3.2. By Grade
10.3.3. By Manufacturing Process
10.3.4. By Capacity
10.3.5. By End User
10.4. Key Takeaways
11. Latin America Market Analysis 2017 to 2022 and Forecast 2023 to 2033, By Country
11.1. Historical Market Size Value (US$ Million) & Volume (Units) Trend Analysis By Market Taxonomy, 2017 to 2022
11.2. Market Size Value (US$ Million) & Volume (Units) Forecast By Market Taxonomy, 2023 to 2033
11.2.1. By Country
11.2.1.1. Brazil
11.2.1.2. Mexico
11.2.1.3. Argentina
11.2.1.4. Rest of Latin America
11.2.2. By Grade
11.2.3. By Manufacturing Process
11.2.4. By Capacity
11.2.5. By End User
11.3. Market Attractiveness Analysis
11.3.1. By Country
11.3.2. By Grade
11.3.3. By Manufacturing Process
11.3.4. By Capacity
11.3.5. By End User
11.4. Key Takeaways
12. Europe Market Analysis 2017 to 2022 and Forecast 2023 to 2033, By Country
12.1. Historical Market Size Value (US$ Million) & Volume (Units) Trend Analysis By Market Taxonomy, 2017 to 2022
12.2. Market Size Value (US$ Million) & Volume (Units) Forecast By Market Taxonomy, 2023 to 2033
12.2.1. By Country
12.2.1.1. Germany
12.2.1.2. Italy
12.2.1.3. France
12.2.1.4. United Kingdom
12.2.1.5. Spain
12.2.1.6. BENELUX
12.2.1.7. Nordic
12.2.1.8. Russia
12.2.1.9. Poland
12.2.1.10. Rest of Europe
12.2.2. By Grade
12.2.3. By Manufacturing Process
12.2.4. By Capacity
12.2.5. By End User
12.3. Market Attractiveness Analysis
12.3.1. By Country
12.3.2. By Grade
12.3.3. By Manufacturing Process
12.3.4. By Capacity
12.3.5. By End User
12.4. Key Takeaways
13. East Asia Market Analysis 2017 to 2022 and Forecast 2023 to 2033, By Country
13.1. Historical Market Size Value (US$ Million) & Volume (Units) Trend Analysis By Market Taxonomy, 2017 to 2022
13.2. Market Size Value (US$ Million) & Volume (Units) Forecast By Market Taxonomy, 2023 to 2033
13.2.1. By Country
13.2.1.1. China
13.2.1.2. Japan
13.2.1.3. South Korea
13.2.2. By Grade
13.2.3. By Manufacturing Process
13.2.4. By Capacity
13.2.5. By End User
13.3. Market Attractiveness Analysis
13.3.1. By Country
13.3.2. By Grade
13.3.3. By Manufacturing Process
13.3.4. By Capacity
13.3.5. By End User
13.4. Key Takeaways
14. South Asia Market Analysis 2017 to 2022 and Forecast 2023 to 2033, By Country
14.1. Historical Market Size Value (US$ Million) & Volume (Units) Trend Analysis By Market Taxonomy, 2017 to 2022
14.2. Market Size Value (US$ Million) & Volume (Units) Forecast By Market Taxonomy, 2023 to 2033
14.2.1. By Country
14.2.1.1. India
14.2.1.2. Thailand
14.2.1.3. Indonesia
14.2.1.4. Malaysia
14.2.1.5. Rest of South Asia
14.2.2. By Grade
14.2.3. By Manufacturing Process
14.2.4. By Capacity
14.2.5. By End User
14.3. Market Attractiveness Analysis
14.3.1. By Country
14.3.2. By Grade
14.3.3. By Manufacturing Process
14.3.4. By Capacity
14.3.5. By End User
14.4. Key Takeaways
15. Oceania Market Analysis 2017 to 2022 and Forecast 2023 to 2033, By Country
15.1. Historical Market Size Value (US$ Million) & Volume (Units) Trend Analysis By Market Taxonomy, 2017 to 2022
15.2. Market Size Value (US$ Million) & Volume (Units) Forecast By Market Taxonomy, 2023 to 2033
15.2.1. By Country
15.2.1.1. Australia
15.2.1.2. New Zealand
15.2.2. By Grade
15.2.3. By Manufacturing Process
15.2.4. By Capacity
15.2.5. By End User
15.3. Market Attractiveness Analysis
15.3.1. By Country
15.3.2. By Grade
15.3.3. By Manufacturing Process
15.3.4. By Capacity
15.3.5. By End User
15.4. Key Takeaways
16. MEA Market Analysis 2017 to 2022 and Forecast 2023 to 2033, By Country
16.1. Historical Market Size Value (US$ Million) & Volume (Units) Trend Analysis By Market Taxonomy, 2017 to 2022
16.2. Market Size Value (US$ Million) & Volume (Units) Forecast By Market Taxonomy, 2023 to 2033
16.2.1. By Country
16.2.1.1. GCC Countries
16.2.1.2. Turkey
16.2.1.3. Northern Africa
16.2.1.4. South Africa
16.2.1.5. Rest of MEA
16.2.2. By Grade
16.2.3. By Manufacturing Process
16.2.4. By Capacity
16.2.5. By End User
16.3. Market Attractiveness Analysis
16.3.1. By Country
16.3.2. By Grade
16.3.3. By Manufacturing Process
16.3.4. By Capacity
16.3.5. By End User
16.4. Key Takeaways
17. Key Countries Market Analysis
17.1. USA
17.1.1. Pricing Analysis
17.1.2. Market Share Analysis, 2022
17.1.2.1. By Grade
17.1.2.2. By Manufacturing Process
17.1.2.3. By Capacity
17.1.2.4. By End User
17.2. Canada
17.2.1. Pricing Analysis
17.2.2. Market Share Analysis, 2022
17.2.2.1. By Grade
17.2.2.2. By Manufacturing Process
17.2.2.3. By Capacity
17.2.2.4. By End User
17.3. Brazil
17.3.1. Pricing Analysis
17.3.2. Market Share Analysis, 2022
17.3.2.1. By Grade
17.3.2.2. By Manufacturing Process
17.3.2.3. By Capacity
17.3.2.4. By End User
17.4. Mexico
17.4.1. Pricing Analysis
17.4.2. Market Share Analysis, 2022
17.4.2.1. By Grade
17.4.2.2. By Manufacturing Process
17.4.2.3. By Capacity
17.4.2.4. By End User
17.5. Argentina
17.5.1. Pricing Analysis
17.5.2. Market Share Analysis, 2022
17.5.2.1. By Grade
17.5.2.2. By Manufacturing Process
17.5.2.3. By Capacity
17.5.2.4. By End User
17.6. Germany
17.6.1. Pricing Analysis
17.6.2. Market Share Analysis, 2022
17.6.2.1. By Grade
17.6.2.2. By Manufacturing Process
17.6.2.3. By Capacity
17.6.2.4. By End User
17.7. Italy
17.7.1. Pricing Analysis
17.7.2. Market Share Analysis, 2022
17.7.2.1. By Grade
17.7.2.2. By Manufacturing Process
17.7.2.3. By Capacity
17.7.2.4. By End User
17.8. France
17.8.1. Pricing Analysis
17.8.2. Market Share Analysis, 2022
17.8.2.1. By Grade
17.8.2.2. By Manufacturing Process
17.8.2.3. By Capacity
17.8.2.4. By End User
17.9. United Kingdom
17.9.1. Pricing Analysis
17.9.2. Market Share Analysis, 2022
17.9.2.1. By Grade
17.9.2.2. By Manufacturing Process
17.9.2.3. By Capacity
17.9.2.4. By End User
17.10. Spain
17.10.1. Pricing Analysis
17.10.2. Market Share Analysis, 2022
17.10.2.1. By Grade
17.10.2.2. By Manufacturing Process
17.10.2.3. By Capacity
17.10.2.4. By End User
17.11. BENELUX
17.11.1. Pricing Analysis
17.11.2. Market Share Analysis, 2022
17.11.2.1. By Grade
17.11.2.2. By Manufacturing Process
17.11.2.3. By Capacity
17.11.2.4. By End User
17.12. Nordic
17.12.1. Pricing Analysis
17.12.2. Market Share Analysis, 2022
17.12.2.1. By Grade
17.12.2.2. By Manufacturing Process
17.12.2.3. By Capacity
17.12.2.4. By End User
17.13. Russia
17.13.1. Pricing Analysis
17.13.2. Market Share Analysis, 2022
17.13.2.1. By Grade
17.13.2.2. By Manufacturing Process
17.13.2.3. By Capacity
17.13.2.4. By End User
17.14. Poland
17.14.1. Pricing Analysis
17.14.2. Market Share Analysis, 2022
17.14.2.1. By Grade
17.14.2.2. By Manufacturing Process
17.14.2.3. By Capacity
17.14.2.4. By End User
17.15. China
17.15.1. Pricing Analysis
17.15.2. Market Share Analysis, 2022
17.15.2.1. By Grade
17.15.2.2. By Manufacturing Process
17.15.2.3. By Capacity
17.15.2.4. By End User
17.16. Japan
17.16.1. Pricing Analysis
17.16.2. Market Share Analysis, 2022
17.16.2.1. By Grade
17.16.2.2. By Manufacturing Process
17.16.2.3. By Capacity
17.16.2.4. By End User
17.17. South Korea
17.17.1. Pricing Analysis
17.17.2. Market Share Analysis, 2022
17.17.2.1. By Grade
17.17.2.2. By Manufacturing Process
17.17.2.3. By Capacity
17.17.2.4. By End User
17.18. India
17.18.1. Pricing Analysis
17.18.2. Market Share Analysis, 2022
17.18.2.1. By Grade
17.18.2.2. By Manufacturing Process
17.18.2.3. By Capacity
17.18.2.4. By End User
17.19. Thailand
17.19.1. Pricing Analysis
17.19.2. Market Share Analysis, 2022
17.19.2.1. By Grade
17.19.2.2. By Manufacturing Process
17.19.2.3. By Capacity
17.19.2.4. By End User
17.20. Indonesia
17.20.1. Pricing Analysis
17.20.2. Market Share Analysis, 2022
17.20.2.1. By Grade
17.20.2.2. By Manufacturing Process
17.20.2.3. By Capacity
17.20.2.4. By End User
17.21. Malaysia
17.21.1. Pricing Analysis
17.21.2. Market Share Analysis, 2022
17.21.2.1. By Grade
17.21.2.2. By Manufacturing Process
17.21.2.3. By Capacity
17.21.2.4. By End User
17.22. Australia
17.22.1. Pricing Analysis
17.22.2. Market Share Analysis, 2022
17.22.2.1. By Grade
17.22.2.2. By Manufacturing Process
17.22.2.3. By Capacity
17.22.2.4. By End User
17.23. New Zealand
17.23.1. Pricing Analysis
17.23.2. Market Share Analysis, 2022
17.23.2.1. By Grade
17.23.2.2. By Manufacturing Process
17.23.2.3. By Capacity
17.23.2.4. By End User
17.24. GCC Countries
17.24.1. Pricing Analysis
17.24.2. Market Share Analysis, 2022
17.24.2.1. By Grade
17.24.2.2. By Manufacturing Process
17.24.2.3. By Capacity
17.24.2.4. By End User
17.25. Turkey
17.25.1. Pricing Analysis
17.25.2. Market Share Analysis, 2022
17.25.2.1. By Grade
17.25.2.2. By Manufacturing Process
17.25.2.3. By Capacity
17.25.2.4. By End User
17.26. Northern Africa
17.26.1. Pricing Analysis
17.26.2. Market Share Analysis, 2022
17.26.2.1. By Grade
17.26.2.2. By Manufacturing Process
17.26.2.3. By Capacity
17.26.2.4. By End User
17.27. South Africa
17.27.1. Pricing Analysis
17.27.2. Market Share Analysis, 2022
17.27.2.1. By Grade
17.27.2.2. By Manufacturing Process
17.27.2.3. By Capacity
17.27.2.4. By End User
18. Market Structure Analysis
18.1. Competition Dashboard
18.2. Competition Benchmarking
18.3. Market Share Analysis of Top Players
18.3.1. By Regional
18.3.2. By Grade
18.3.3. By Manufacturing Process
18.3.4. By Capacity
18.3.5. By End User
19. Competition Analysis
19.1. Competition Deep Dive
19.1.1. Owen Illinois, Inc.
19.1.1.1. Overview
19.1.1.2. Product Portfolio
19.1.1.3. Profitability by Market Segments
19.1.1.4. Sales Footprint
19.1.1.5. Strategy Overview
19.1.1.5.1. Marketing Strategy
19.1.1.5.2. Product Strategy
19.1.1.5.3. Channel Strategy
19.1.2. Ardagh Group, SA
19.1.2.1. Overview
19.1.2.2. Product Portfolio
19.1.2.3. Profitability by Market Segments
19.1.2.4. Sales Footprint
19.1.2.5. Strategy Overview
19.1.2.5.1. Marketing Strategy
19.1.2.5.2. Product Strategy
19.1.2.5.3. Channel Strategy
19.1.3. Vitro, S. A. B. de C. V.
19.1.3.1. Overview
19.1.3.2. Product Portfolio
19.1.3.3. Profitability by Market Segments
19.1.3.4. Sales Footprint
19.1.3.5. Strategy Overview
19.1.3.5.1. Marketing Strategy
19.1.3.5.2. Product Strategy
19.1.3.5.3. Channel Strategy
19.1.4. Vidrala, S.A
19.1.4.1. Overview
19.1.4.2. Product Portfolio
19.1.4.3. Profitability by Market Segments
19.1.4.4. Sales Footprint
19.1.4.5. Strategy Overview
19.1.4.5.1. Marketing Strategy
19.1.4.5.2. Product Strategy
19.1.4.5.3. Channel Strategy
19.1.5. BA Glass B.V.
19.1.5.1. Overview
19.1.5.2. Product Portfolio
19.1.5.3. Profitability by Market Segments
19.1.5.4. Sales Footprint
19.1.5.5. Strategy Overview
19.1.5.5.1. Marketing Strategy
19.1.5.5.2. Product Strategy
19.1.5.5.3. Channel Strategy
19.1.6. AGI Glasspack Limited.
19.1.6.1. Overview
19.1.6.2. Product Portfolio
19.1.6.3. Profitability by Market Segments
19.1.6.4. Sales Footprint
19.1.6.5. Strategy Overview
19.1.6.5.1. Marketing Strategy
19.1.6.5.2. Product Strategy
19.1.6.5.3. Channel Strategy
19.1.7. Frigoglass Jebel Ali FZCO
19.1.7.1. Overview
19.1.7.2. Product Portfolio
19.1.7.3. Profitability by Market Segments
19.1.7.4. Sales Footprint
19.1.7.5. Strategy Overview
19.1.7.5.1. Marketing Strategy
19.1.7.5.2. Product Strategy
19.1.7.5.3. Channel Strategy
19.1.8. Consol Glass (Pty) Ltd.
19.1.8.1. Overview
19.1.8.2. Product Portfolio
19.1.8.3. Profitability by Market Segments
19.1.8.4. Sales Footprint
19.1.8.5. Strategy Overview
19.1.8.5.1. Marketing Strategy
19.1.8.5.2. Product Strategy
19.1.8.5.3. Channel Strategy
19.1.9. Toyo Glass Co., Ltd.
19.1.9.1. Overview
19.1.9.2. Product Portfolio
19.1.9.3. Profitability by Market Segments
19.1.9.4. Sales Footprint
19.1.9.5. Strategy Overview
19.1.9.5.1. Marketing Strategy
19.1.9.5.2. Product Strategy
19.1.9.5.3. Channel Strategy
19.1.10. Gerresheimer AG
19.1.10.1. Overview
19.1.10.2. Product Portfolio
19.1.10.3. Profitability by Market Segments
19.1.10.4. Sales Footprint
19.1.10.5. Strategy Overview
19.1.10.5.1. Marketing Strategy
19.1.10.5.2. Product Strategy
19.1.10.5.3. Channel Strategy
19.1.11. Vetropack Holding AG
19.1.11.1. Overview
19.1.11.2. Product Portfolio
19.1.11.3. Profitability by Market Segments
19.1.11.4. Sales Footprint
19.1.11.5. Strategy Overview
19.1.11.5.1. Marketing Strategy
19.1.11.5.2. Product Strategy
19.1.11.5.3. Channel Strategy
19.1.12. Borosil Glass Works Ltd.
19.1.12.1. Overview
19.1.12.2. Product Portfolio
19.1.12.3. Profitability by Market Segments
19.1.12.4. Sales Footprint
19.1.12.5. Strategy Overview
19.1.12.5.1. Marketing Strategy
19.1.12.5.2. Product Strategy
19.1.12.5.3. Channel Strategy
19.1.13. Carib Glassworks Limited (CGL)
19.1.13.1. Overview
19.1.13.2. Product Portfolio
19.1.13.3. Profitability by Market Segments
19.1.13.4. Sales Footprint
19.1.13.5. Strategy Overview
19.1.13.5.1. Marketing Strategy
19.1.13.5.2. Product Strategy
19.1.13.5.3. Channel Strategy
19.1.14. Piramal Glass Private Limited
19.1.14.1. Overview
19.1.14.2. Product Portfolio
19.1.14.3. Profitability by Market Segments
19.1.14.4. Sales Footprint
19.1.14.5. Strategy Overview
19.1.14.5.1. Marketing Strategy
19.1.14.5.2. Product Strategy
19.1.14.5.3. Channel Strategy
19.1.15. Albéa S.A.
19.1.15.1. Overview
19.1.15.2. Product Portfolio
19.1.15.3. Profitability by Market Segments
19.1.15.4. Sales Footprint
19.1.15.5. Strategy Overview
19.1.15.5.1. Marketing Strategy
19.1.15.5.2. Product Strategy
19.1.15.5.3. Channel Strategy
19.1.16. Verallia SA
19.1.16.1. Overview
19.1.16.2. Product Portfolio
19.1.16.3. Profitability by Market Segments
19.1.16.4. Sales Footprint
19.1.16.5. Strategy Overview
19.1.16.5.1. Marketing Strategy
19.1.16.5.2. Product Strategy
19.1.16.5.3. Channel Strategy
19.1.17. Stölzle-Oberglas GmbH
19.1.17.1. Overview
19.1.17.2. Product Portfolio
19.1.17.3. Profitability by Market Segments
19.1.17.4. Sales Footprint
19.1.17.5. Strategy Overview
19.1.17.5.1. Marketing Strategy
19.1.17.5.2. Product Strategy
19.1.17.5.3. Channel Strategy
19.1.18. Gallo Glass Company
19.1.18.1. Overview
19.1.18.2. Product Portfolio
19.1.18.3. Profitability by Market Segments
19.1.18.4. Sales Footprint
19.1.18.5. Strategy Overview
19.1.18.5.1. Marketing Strategy
19.1.18.5.2. Product Strategy
19.1.18.5.3. Channel Strategy
19.1.19. Allied Glass Containers Ltd
19.1.19.1. Overview
19.1.19.2. Product Portfolio
19.1.19.3. Profitability by Market Segments
19.1.19.4. Sales Footprint
19.1.19.5. Strategy Overview
19.1.19.5.1. Marketing Strategy
19.1.19.5.2. Product Strategy
19.1.19.5.3. Channel Strategy
19.1.20. SGA S.A.
19.1.20.1. Overview
19.1.20.2. Product Portfolio
19.1.20.3. Profitability by Market Segments
19.1.20.4. Sales Footprint
19.1.20.5. Strategy Overview
19.1.20.5.1. Marketing Strategy
19.1.20.5.2. Product Strategy
19.1.20.5.3. Channel Strategy
20. Assumptions & Acronyms Used
21. Research Methodology
Let us know your requirement to get
100% FREE customization
List of Tables
Table 1: Global Market Value (US$ Million) Forecast by Region, 2017 to 2033
Table 2: Global Market Volume (Units) Forecast by Region, 2017 to 2033
Table 3: Global Market Value (US$ Million) Forecast by Grade, 2017 to 2033
Table 4: Global Market Volume (Units) Forecast by Grade, 2017 to 2033
Table 5: Global Market Value (US$ Million) Forecast by Manufacturing Process, 2017 to 2033
Table 6: Global Market Volume (Units) Forecast by Manufacturing Process, 2017 to 2033
Table 7: Global Market Value (US$ Million) Forecast by Capacity, 2017 to 2033
Table 8: Global Market Volume (Units) Forecast by Capacity, 2017 to 2033
Table 9: Global Market Value (US$ Million) Forecast by End User, 2017 to 2033
Table 10: Global Market Volume (Units) Forecast by End User, 2017 to 2033
Table 11: North America Market Value (US$ Million) Forecast by Country, 2017 to 2033
Table 12: North America Market Volume (Units) Forecast by Country, 2017 to 2033
Table 13: North America Market Value (US$ Million) Forecast by Grade, 2017 to 2033
Table 14: North America Market Volume (Units) Forecast by Grade, 2017 to 2033
Table 15: North America Market Value (US$ Million) Forecast by Manufacturing Process, 2017 to 2033
Table 16: North America Market Volume (Units) Forecast by Manufacturing Process, 2017 to 2033
Table 17: North America Market Value (US$ Million) Forecast by Capacity, 2017 to 2033
Table 18: North America Market Volume (Units) Forecast by Capacity, 2017 to 2033
Table 19: North America Market Value (US$ Million) Forecast by End User, 2017 to 2033
Table 20: North America Market Volume (Units) Forecast by End User, 2017 to 2033
Table 21: Latin America Market Value (US$ Million) Forecast by Country, 2017 to 2033
Table 22: Latin America Market Volume (Units) Forecast by Country, 2017 to 2033
Table 23: Latin America Market Value (US$ Million) Forecast by Grade, 2017 to 2033
Table 24: Latin America Market Volume (Units) Forecast by Grade, 2017 to 2033
Table 25: Latin America Market Value (US$ Million) Forecast by Manufacturing Process, 2017 to 2033
Table 26: Latin America Market Volume (Units) Forecast by Manufacturing Process, 2017 to 2033
Table 27: Latin America Market Value (US$ Million) Forecast by Capacity, 2017 to 2033
Table 28: Latin America Market Volume (Units) Forecast by Capacity, 2017 to 2033
Table 29: Latin America Market Value (US$ Million) Forecast by End User, 2017 to 2033
Table 30: Latin America Market Volume (Units) Forecast by End User, 2017 to 2033
Table 31: Europe Market Value (US$ Million) Forecast by Country, 2017 to 2033
Table 32: Europe Market Volume (Units) Forecast by Country, 2017 to 2033
Table 33: Europe Market Value (US$ Million) Forecast by Grade, 2017 to 2033
Table 34: Europe Market Volume (Units) Forecast by Grade, 2017 to 2033
Table 35: Europe Market Value (US$ Million) Forecast by Manufacturing Process, 2017 to 2033
Table 36: Europe Market Volume (Units) Forecast by Manufacturing Process, 2017 to 2033
Table 37: Europe Market Value (US$ Million) Forecast by Capacity, 2017 to 2033
Table 38: Europe Market Volume (Units) Forecast by Capacity, 2017 to 2033
Table 39: Europe Market Value (US$ Million) Forecast by End User, 2017 to 2033
Table 40: Europe Market Volume (Units) Forecast by End User, 2017 to 2033
Table 41: East Asia Market Value (US$ Million) Forecast by Country, 2017 to 2033
Table 42: East Asia Market Volume (Units) Forecast by Country, 2017 to 2033
Table 43: East Asia Market Value (US$ Million) Forecast by Grade, 2017 to 2033
Table 44: East Asia Market Volume (Units) Forecast by Grade, 2017 to 2033
Table 45: East Asia Market Value (US$ Million) Forecast by Manufacturing Process, 2017 to 2033
Table 46: East Asia Market Volume (Units) Forecast by Manufacturing Process, 2017 to 2033
Table 47: East Asia Market Value (US$ Million) Forecast by Capacity, 2017 to 2033
Table 48: East Asia Market Volume (Units) Forecast by Capacity, 2017 to 2033
Table 49: East Asia Market Value (US$ Million) Forecast by End User, 2017 to 2033
Table 50: East Asia Market Volume (Units) Forecast by End User, 2017 to 2033
Table 51: South Asia Market Value (US$ Million) Forecast by Country, 2017 to 2033
Table 52: South Asia Market Volume (Units) Forecast by Country, 2017 to 2033
Table 53: South Asia Market Value (US$ Million) Forecast by Grade, 2017 to 2033
Table 54: South Asia Market Volume (Units) Forecast by Grade, 2017 to 2033
Table 55: South Asia Market Value (US$ Million) Forecast by Manufacturing Process, 2017 to 2033
Table 56: South Asia Market Volume (Units) Forecast by Manufacturing Process, 2017 to 2033
Table 57: South Asia Market Value (US$ Million) Forecast by Capacity, 2017 to 2033
Table 58: South Asia Market Volume (Units) Forecast by Capacity, 2017 to 2033
Table 59: South Asia Market Value (US$ Million) Forecast by End User, 2017 to 2033
Table 60: South Asia Market Volume (Units) Forecast by End User, 2017 to 2033
Table 61: Oceania Market Value (US$ Million) Forecast by Country, 2017 to 2033
Table 62: Oceania Market Volume (Units) Forecast by Country, 2017 to 2033
Table 63: Oceania Market Value (US$ Million) Forecast by Grade, 2017 to 2033
Table 64: Oceania Market Volume (Units) Forecast by Grade, 2017 to 2033
Table 65: Oceania Market Value (US$ Million) Forecast by Manufacturing Process, 2017 to 2033
Table 66: Oceania Market Volume (Units) Forecast by Manufacturing Process, 2017 to 2033
Table 67: Oceania Market Value (US$ Million) Forecast by Capacity, 2017 to 2033
Table 68: Oceania Market Volume (Units) Forecast by Capacity, 2017 to 2033
Table 69: Oceania Market Value (US$ Million) Forecast by End User, 2017 to 2033
Table 70: Oceania Market Volume (Units) Forecast by End User, 2017 to 2033
Table 71: MEA Market Value (US$ Million) Forecast by Country, 2017 to 2033
Table 72: MEA Market Volume (Units) Forecast by Country, 2017 to 2033
Table 73: MEA Market Value (US$ Million) Forecast by Grade, 2017 to 2033
Table 74: MEA Market Volume (Units) Forecast by Grade, 2017 to 2033
Table 75: MEA Market Value (US$ Million) Forecast by Manufacturing Process, 2017 to 2033
Table 76: MEA Market Volume (Units) Forecast by Manufacturing Process, 2017 to 2033
Table 77: MEA Market Value (US$ Million) Forecast by Capacity, 2017 to 2033
Table 78: MEA Market Volume (Units) Forecast by Capacity, 2017 to 2033
Table 79: MEA Market Value (US$ Million) Forecast by End User, 2017 to 2033
Table 80: MEA Market Volume (Units) Forecast by End User, 2017 to 2033
Find your sweet spots for generating winning opportunities in this market.
Talk to AnalystList of Charts
Figure 1: Global Market Value (US$ Million) by Grade, 2023 to 2033
Figure 2: Global Market Value (US$ Million) by Manufacturing Process, 2023 to 2033
Figure 3: Global Market Value (US$ Million) by Capacity, 2023 to 2033
Figure 4: Global Market Value (US$ Million) by End User, 2023 to 2033
Figure 5: Global Market Value (US$ Million) by Region, 2023 to 2033
Figure 6: Global Market Value (US$ Million) Analysis by Region, 2017 to 2033
Figure 7: Global Market Volume (Units) Analysis by Region, 2017 to 2033
Figure 8: Global Market Value Share (%) and BPS Analysis by Region, 2023 to 2033
Figure 9: Global Market Y-o-Y Growth (%) Projections by Region, 2023 to 2033
Figure 10: Global Market Value (US$ Million) Analysis by Grade, 2017 to 2033
Figure 11: Global Market Volume (Units) Analysis by Grade, 2017 to 2033
Figure 12: Global Market Value Share (%) and BPS Analysis by Grade, 2023 to 2033
Figure 13: Global Market Y-o-Y Growth (%) Projections by Grade, 2023 to 2033
Figure 14: Global Market Value (US$ Million) Analysis by Manufacturing Process, 2017 to 2033
Figure 15: Global Market Volume (Units) Analysis by Manufacturing Process, 2017 to 2033
Figure 16: Global Market Value Share (%) and BPS Analysis by Manufacturing Process, 2023 to 2033
Figure 17: Global Market Y-o-Y Growth (%) Projections by Manufacturing Process, 2023 to 2033
Figure 18: Global Market Value (US$ Million) Analysis by Capacity, 2017 to 2033
Figure 19: Global Market Volume (Units) Analysis by Capacity, 2017 to 2033
Figure 20: Global Market Value Share (%) and BPS Analysis by Capacity, 2023 to 2033
Figure 21: Global Market Y-o-Y Growth (%) Projections by Capacity, 2023 to 2033
Figure 22: Global Market Value (US$ Million) Analysis by End User, 2017 to 2033
Figure 23: Global Market Volume (Units) Analysis by End User, 2017 to 2033
Figure 24: Global Market Value Share (%) and BPS Analysis by End User, 2023 to 2033
Figure 25: Global Market Y-o-Y Growth (%) Projections by End User, 2023 to 2033
Figure 26: Global Market Attractiveness by Grade, 2023 to 2033
Figure 27: Global Market Attractiveness by Manufacturing Process, 2023 to 2033
Figure 28: Global Market Attractiveness by Capacity, 2023 to 2033
Figure 29: Global Market Attractiveness by End User, 2023 to 2033
Figure 30: Global Market Attractiveness by Region, 2023 to 2033
Figure 31: North America Market Value (US$ Million) by Grade, 2023 to 2033
Figure 32: North America Market Value (US$ Million) by Manufacturing Process, 2023 to 2033
Figure 33: North America Market Value (US$ Million) by Capacity, 2023 to 2033
Figure 34: North America Market Value (US$ Million) by End User, 2023 to 2033
Figure 35: North America Market Value (US$ Million) by Country, 2023 to 2033
Figure 36: North America Market Value (US$ Million) Analysis by Country, 2017 to 2033
Figure 37: North America Market Volume (Units) Analysis by Country, 2017 to 2033
Figure 38: North America Market Value Share (%) and BPS Analysis by Country, 2023 to 2033
Figure 39: North America Market Y-o-Y Growth (%) Projections by Country, 2023 to 2033
Figure 40: North America Market Value (US$ Million) Analysis by Grade, 2017 to 2033
Figure 41: North America Market Volume (Units) Analysis by Grade, 2017 to 2033
Figure 42: North America Market Value Share (%) and BPS Analysis by Grade, 2023 to 2033
Figure 43: North America Market Y-o-Y Growth (%) Projections by Grade, 2023 to 2033
Figure 44: North America Market Value (US$ Million) Analysis by Manufacturing Process, 2017 to 2033
Figure 45: North America Market Volume (Units) Analysis by Manufacturing Process, 2017 to 2033
Figure 46: North America Market Value Share (%) and BPS Analysis by Manufacturing Process, 2023 to 2033
Figure 47: North America Market Y-o-Y Growth (%) Projections by Manufacturing Process, 2023 to 2033
Figure 48: North America Market Value (US$ Million) Analysis by Capacity, 2017 to 2033
Figure 49: North America Market Volume (Units) Analysis by Capacity, 2017 to 2033
Figure 50: North America Market Value Share (%) and BPS Analysis by Capacity, 2023 to 2033
Figure 51: North America Market Y-o-Y Growth (%) Projections by Capacity, 2023 to 2033
Figure 52: North America Market Value (US$ Million) Analysis by End User, 2017 to 2033
Figure 53: North America Market Volume (Units) Analysis by End User, 2017 to 2033
Figure 54: North America Market Value Share (%) and BPS Analysis by End User, 2023 to 2033
Figure 55: North America Market Y-o-Y Growth (%) Projections by End User, 2023 to 2033
Figure 56: North America Market Attractiveness by Grade, 2023 to 2033
Figure 57: North America Market Attractiveness by Manufacturing Process, 2023 to 2033
Figure 58: North America Market Attractiveness by Capacity, 2023 to 2033
Figure 59: North America Market Attractiveness by End User, 2023 to 2033
Figure 60: North America Market Attractiveness by Country, 2023 to 2033
Figure 61: Latin America Market Value (US$ Million) by Grade, 2023 to 2033
Figure 62: Latin America Market Value (US$ Million) by Manufacturing Process, 2023 to 2033
Figure 63: Latin America Market Value (US$ Million) by Capacity, 2023 to 2033
Figure 64: Latin America Market Value (US$ Million) by End User, 2023 to 2033
Figure 65: Latin America Market Value (US$ Million) by Country, 2023 to 2033
Figure 66: Latin America Market Value (US$ Million) Analysis by Country, 2017 to 2033
Figure 67: Latin America Market Volume (Units) Analysis by Country, 2017 to 2033
Figure 68: Latin America Market Value Share (%) and BPS Analysis by Country, 2023 to 2033
Figure 69: Latin America Market Y-o-Y Growth (%) Projections by Country, 2023 to 2033
Figure 70: Latin America Market Value (US$ Million) Analysis by Grade, 2017 to 2033
Figure 71: Latin America Market Volume (Units) Analysis by Grade, 2017 to 2033
Figure 72: Latin America Market Value Share (%) and BPS Analysis by Grade, 2023 to 2033
Figure 73: Latin America Market Y-o-Y Growth (%) Projections by Grade, 2023 to 2033
Figure 74: Latin America Market Value (US$ Million) Analysis by Manufacturing Process, 2017 to 2033
Figure 75: Latin America Market Volume (Units) Analysis by Manufacturing Process, 2017 to 2033
Figure 76: Latin America Market Value Share (%) and BPS Analysis by Manufacturing Process, 2023 to 2033
Figure 77: Latin America Market Y-o-Y Growth (%) Projections by Manufacturing Process, 2023 to 2033
Figure 78: Latin America Market Value (US$ Million) Analysis by Capacity, 2017 to 2033
Figure 79: Latin America Market Volume (Units) Analysis by Capacity, 2017 to 2033
Figure 80: Latin America Market Value Share (%) and BPS Analysis by Capacity, 2023 to 2033
Figure 81: Latin America Market Y-o-Y Growth (%) Projections by Capacity, 2023 to 2033
Figure 82: Latin America Market Value (US$ Million) Analysis by End User, 2017 to 2033
Figure 83: Latin America Market Volume (Units) Analysis by End User, 2017 to 2033
Figure 84: Latin America Market Value Share (%) and BPS Analysis by End User, 2023 to 2033
Figure 85: Latin America Market Y-o-Y Growth (%) Projections by End User, 2023 to 2033
Figure 86: Latin America Market Attractiveness by Grade, 2023 to 2033
Figure 87: Latin America Market Attractiveness by Manufacturing Process, 2023 to 2033
Figure 88: Latin America Market Attractiveness by Capacity, 2023 to 2033
Figure 89: Latin America Market Attractiveness by End User, 2023 to 2033
Figure 90: Latin America Market Attractiveness by Country, 2023 to 2033
Figure 91: Europe Market Value (US$ Million) by Grade, 2023 to 2033
Figure 92: Europe Market Value (US$ Million) by Manufacturing Process, 2023 to 2033
Figure 93: Europe Market Value (US$ Million) by Capacity, 2023 to 2033
Figure 94: Europe Market Value (US$ Million) by End User, 2023 to 2033
Figure 95: Europe Market Value (US$ Million) by Country, 2023 to 2033
Figure 96: Europe Market Value (US$ Million) Analysis by Country, 2017 to 2033
Figure 97: Europe Market Volume (Units) Analysis by Country, 2017 to 2033
Figure 98: Europe Market Value Share (%) and BPS Analysis by Country, 2023 to 2033
Figure 99: Europe Market Y-o-Y Growth (%) Projections by Country, 2023 to 2033
Figure 100: Europe Market Value (US$ Million) Analysis by Grade, 2017 to 2033
Figure 101: Europe Market Volume (Units) Analysis by Grade, 2017 to 2033
Figure 102: Europe Market Value Share (%) and BPS Analysis by Grade, 2023 to 2033
Figure 103: Europe Market Y-o-Y Growth (%) Projections by Grade, 2023 to 2033
Figure 104: Europe Market Value (US$ Million) Analysis by Manufacturing Process, 2017 to 2033
Figure 105: Europe Market Volume (Units) Analysis by Manufacturing Process, 2017 to 2033
Figure 106: Europe Market Value Share (%) and BPS Analysis by Manufacturing Process, 2023 to 2033
Figure 107: Europe Market Y-o-Y Growth (%) Projections by Manufacturing Process, 2023 to 2033
Figure 108: Europe Market Value (US$ Million) Analysis by Capacity, 2017 to 2033
Figure 109: Europe Market Volume (Units) Analysis by Capacity, 2017 to 2033
Figure 110: Europe Market Value Share (%) and BPS Analysis by Capacity, 2023 to 2033
Figure 111: Europe Market Y-o-Y Growth (%) Projections by Capacity, 2023 to 2033
Figure 112: Europe Market Value (US$ Million) Analysis by End User, 2017 to 2033
Figure 113: Europe Market Volume (Units) Analysis by End User, 2017 to 2033
Figure 114: Europe Market Value Share (%) and BPS Analysis by End User, 2023 to 2033
Figure 115: Europe Market Y-o-Y Growth (%) Projections by End User, 2023 to 2033
Figure 116: Europe Market Attractiveness by Grade, 2023 to 2033
Figure 117: Europe Market Attractiveness by Manufacturing Process, 2023 to 2033
Figure 118: Europe Market Attractiveness by Capacity, 2023 to 2033
Figure 119: Europe Market Attractiveness by End User, 2023 to 2033
Figure 120: Europe Market Attractiveness by Country, 2023 to 2033
Figure 121: East Asia Market Value (US$ Million) by Grade, 2023 to 2033
Figure 122: East Asia Market Value (US$ Million) by Manufacturing Process, 2023 to 2033
Figure 123: East Asia Market Value (US$ Million) by Capacity, 2023 to 2033
Figure 124: East Asia Market Value (US$ Million) by End User, 2023 to 2033
Figure 125: East Asia Market Value (US$ Million) by Country, 2023 to 2033
Figure 126: East Asia Market Value (US$ Million) Analysis by Country, 2017 to 2033
Figure 127: East Asia Market Volume (Units) Analysis by Country, 2017 to 2033
Figure 128: East Asia Market Value Share (%) and BPS Analysis by Country, 2023 to 2033
Figure 129: East Asia Market Y-o-Y Growth (%) Projections by Country, 2023 to 2033
Figure 130: East Asia Market Value (US$ Million) Analysis by Grade, 2017 to 2033
Figure 131: East Asia Market Volume (Units) Analysis by Grade, 2017 to 2033
Figure 132: East Asia Market Value Share (%) and BPS Analysis by Grade, 2023 to 2033
Figure 133: East Asia Market Y-o-Y Growth (%) Projections by Grade, 2023 to 2033
Figure 134: East Asia Market Value (US$ Million) Analysis by Manufacturing Process, 2017 to 2033
Figure 135: East Asia Market Volume (Units) Analysis by Manufacturing Process, 2017 to 2033
Figure 136: East Asia Market Value Share (%) and BPS Analysis by Manufacturing Process, 2023 to 2033
Figure 137: East Asia Market Y-o-Y Growth (%) Projections by Manufacturing Process, 2023 to 2033
Figure 138: East Asia Market Value (US$ Million) Analysis by Capacity, 2017 to 2033
Figure 139: East Asia Market Volume (Units) Analysis by Capacity, 2017 to 2033
Figure 140: East Asia Market Value Share (%) and BPS Analysis by Capacity, 2023 to 2033
Figure 141: East Asia Market Y-o-Y Growth (%) Projections by Capacity, 2023 to 2033
Figure 142: East Asia Market Value (US$ Million) Analysis by End User, 2017 to 2033
Figure 143: East Asia Market Volume (Units) Analysis by End User, 2017 to 2033
Figure 144: East Asia Market Value Share (%) and BPS Analysis by End User, 2023 to 2033
Figure 145: East Asia Market Y-o-Y Growth (%) Projections by End User, 2023 to 2033
Figure 146: East Asia Market Attractiveness by Grade, 2023 to 2033
Figure 147: East Asia Market Attractiveness by Manufacturing Process, 2023 to 2033
Figure 148: East Asia Market Attractiveness by Capacity, 2023 to 2033
Figure 149: East Asia Market Attractiveness by End User, 2023 to 2033
Figure 150: East Asia Market Attractiveness by Country, 2023 to 2033
Figure 151: South Asia Market Value (US$ Million) by Grade, 2023 to 2033
Figure 152: South Asia Market Value (US$ Million) by Manufacturing Process, 2023 to 2033
Figure 153: South Asia Market Value (US$ Million) by Capacity, 2023 to 2033
Figure 154: South Asia Market Value (US$ Million) by End User, 2023 to 2033
Figure 155: South Asia Market Value (US$ Million) by Country, 2023 to 2033
Figure 156: South Asia Market Value (US$ Million) Analysis by Country, 2017 to 2033
Figure 157: South Asia Market Volume (Units) Analysis by Country, 2017 to 2033
Figure 158: South Asia Market Value Share (%) and BPS Analysis by Country, 2023 to 2033
Figure 159: South Asia Market Y-o-Y Growth (%) Projections by Country, 2023 to 2033
Figure 160: South Asia Market Value (US$ Million) Analysis by Grade, 2017 to 2033
Figure 161: South Asia Market Volume (Units) Analysis by Grade, 2017 to 2033
Figure 162: South Asia Market Value Share (%) and BPS Analysis by Grade, 2023 to 2033
Figure 163: South Asia Market Y-o-Y Growth (%) Projections by Grade, 2023 to 2033
Figure 164: South Asia Market Value (US$ Million) Analysis by Manufacturing Process, 2017 to 2033
Figure 165: South Asia Market Volume (Units) Analysis by Manufacturing Process, 2017 to 2033
Figure 166: South Asia Market Value Share (%) and BPS Analysis by Manufacturing Process, 2023 to 2033
Figure 167: South Asia Market Y-o-Y Growth (%) Projections by Manufacturing Process, 2023 to 2033
Figure 168: South Asia Market Value (US$ Million) Analysis by Capacity, 2017 to 2033
Figure 169: South Asia Market Volume (Units) Analysis by Capacity, 2017 to 2033
Figure 170: South Asia Market Value Share (%) and BPS Analysis by Capacity, 2023 to 2033
Figure 171: South Asia Market Y-o-Y Growth (%) Projections by Capacity, 2023 to 2033
Figure 172: South Asia Market Value (US$ Million) Analysis by End User, 2017 to 2033
Figure 173: South Asia Market Volume (Units) Analysis by End User, 2017 to 2033
Figure 174: South Asia Market Value Share (%) and BPS Analysis by End User, 2023 to 2033
Figure 175: South Asia Market Y-o-Y Growth (%) Projections by End User, 2023 to 2033
Figure 176: South Asia Market Attractiveness by Grade, 2023 to 2033
Figure 177: South Asia Market Attractiveness by Manufacturing Process, 2023 to 2033
Figure 178: South Asia Market Attractiveness by Capacity, 2023 to 2033
Figure 179: South Asia Market Attractiveness by End User, 2023 to 2033
Figure 180: South Asia Market Attractiveness by Country, 2023 to 2033
Figure 181: Oceania Market Value (US$ Million) by Grade, 2023 to 2033
Figure 182: Oceania Market Value (US$ Million) by Manufacturing Process, 2023 to 2033
Figure 183: Oceania Market Value (US$ Million) by Capacity, 2023 to 2033
Figure 184: Oceania Market Value (US$ Million) by End User, 2023 to 2033
Figure 185: Oceania Market Value (US$ Million) by Country, 2023 to 2033
Figure 186: Oceania Market Value (US$ Million) Analysis by Country, 2017 to 2033
Figure 187: Oceania Market Volume (Units) Analysis by Country, 2017 to 2033
Figure 188: Oceania Market Value Share (%) and BPS Analysis by Country, 2023 to 2033
Figure 189: Oceania Market Y-o-Y Growth (%) Projections by Country, 2023 to 2033
Figure 190: Oceania Market Value (US$ Million) Analysis by Grade, 2017 to 2033
Figure 191: Oceania Market Volume (Units) Analysis by Grade, 2017 to 2033
Figure 192: Oceania Market Value Share (%) and BPS Analysis by Grade, 2023 to 2033
Figure 193: Oceania Market Y-o-Y Growth (%) Projections by Grade, 2023 to 2033
Figure 194: Oceania Market Value (US$ Million) Analysis by Manufacturing Process, 2017 to 2033
Figure 195: Oceania Market Volume (Units) Analysis by Manufacturing Process, 2017 to 2033
Figure 196: Oceania Market Value Share (%) and BPS Analysis by Manufacturing Process, 2023 to 2033
Figure 197: Oceania Market Y-o-Y Growth (%) Projections by Manufacturing Process, 2023 to 2033
Figure 198: Oceania Market Value (US$ Million) Analysis by Capacity, 2017 to 2033
Figure 199: Oceania Market Volume (Units) Analysis by Capacity, 2017 to 2033
Figure 200: Oceania Market Value Share (%) and BPS Analysis by Capacity, 2023 to 2033
Figure 201: Oceania Market Y-o-Y Growth (%) Projections by Capacity, 2023 to 2033
Figure 202: Oceania Market Value (US$ Million) Analysis by End User, 2017 to 2033
Figure 203: Oceania Market Volume (Units) Analysis by End User, 2017 to 2033
Figure 204: Oceania Market Value Share (%) and BPS Analysis by End User, 2023 to 2033
Figure 205: Oceania Market Y-o-Y Growth (%) Projections by End User, 2023 to 2033
Figure 206: Oceania Market Attractiveness by Grade, 2023 to 2033
Figure 207: Oceania Market Attractiveness by Manufacturing Process, 2023 to 2033
Figure 208: Oceania Market Attractiveness by Capacity, 2023 to 2033
Figure 209: Oceania Market Attractiveness by End User, 2023 to 2033
Figure 210: Oceania Market Attractiveness by Country, 2023 to 2033
Figure 211: MEA Market Value (US$ Million) by Grade, 2023 to 2033
Figure 212: MEA Market Value (US$ Million) by Manufacturing Process, 2023 to 2033
Figure 213: MEA Market Value (US$ Million) by Capacity, 2023 to 2033
Figure 214: MEA Market Value (US$ Million) by End User, 2023 to 2033
Figure 215: MEA Market Value (US$ Million) by Country, 2023 to 2033
Figure 216: MEA Market Value (US$ Million) Analysis by Country, 2017 to 2033
Figure 217: MEA Market Volume (Units) Analysis by Country, 2017 to 2033
Figure 218: MEA Market Value Share (%) and BPS Analysis by Country, 2023 to 2033
Figure 219: MEA Market Y-o-Y Growth (%) Projections by Country, 2023 to 2033
Figure 220: MEA Market Value (US$ Million) Analysis by Grade, 2017 to 2033
Figure 221: MEA Market Volume (Units) Analysis by Grade, 2017 to 2033
Figure 222: MEA Market Value Share (%) and BPS Analysis by Grade, 2023 to 2033
Figure 223: MEA Market Y-o-Y Growth (%) Projections by Grade, 2023 to 2033
Figure 224: MEA Market Value (US$ Million) Analysis by Manufacturing Process, 2017 to 2033
Figure 225: MEA Market Volume (Units) Analysis by Manufacturing Process, 2017 to 2033
Figure 226: MEA Market Value Share (%) and BPS Analysis by Manufacturing Process, 2023 to 2033
Figure 227: MEA Market Y-o-Y Growth (%) Projections by Manufacturing Process, 2023 to 2033
Figure 228: MEA Market Value (US$ Million) Analysis by Capacity, 2017 to 2033
Figure 229: MEA Market Volume (Units) Analysis by Capacity, 2017 to 2033
Figure 230: MEA Market Value Share (%) and BPS Analysis by Capacity, 2023 to 2033
Figure 231: MEA Market Y-o-Y Growth (%) Projections by Capacity, 2023 to 2033
Figure 232: MEA Market Value (US$ Million) Analysis by End User, 2017 to 2033
Figure 233: MEA Market Volume (Units) Analysis by End User, 2017 to 2033
Figure 234: MEA Market Value Share (%) and BPS Analysis by End User, 2023 to 2033
Figure 235: MEA Market Y-o-Y Growth (%) Projections by End User, 2023 to 2033
Figure 236: MEA Market Attractiveness by Grade, 2023 to 2033
Figure 237: MEA Market Attractiveness by Manufacturing Process, 2023 to 2033
Figure 238: MEA Market Attractiveness by Capacity, 2023 to 2033
Figure 239: MEA Market Attractiveness by End User, 2023 to 2033
Figure 240: MEA Market Attractiveness by Country, 2023 to 2033
Need specific information?
Request CustomizationExplore Packaging Insights
View Reports