Glass Skin Market Size and Share Forecast Outlook 2025 to 2035

The Glass Skin Market is expected to record a valuation of USD 15,435.2 million in 2025 and USD 42,020.7 million in 2035, with an increase of USD 26,585.5 million, which equals a growth of 172% over the decade. The overall expansion represents a CAGR of 10.5% and a 2.7X increase in market size.
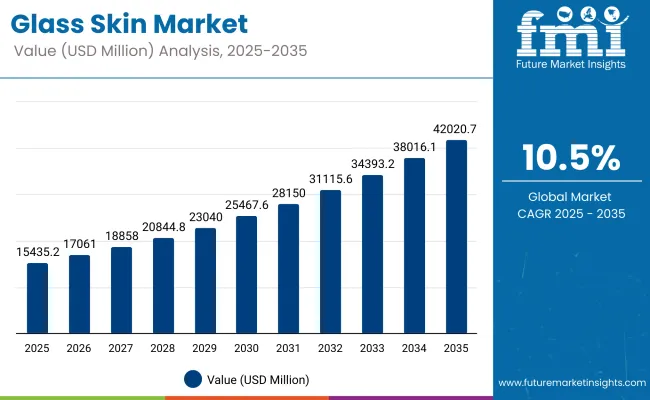
Quick Stats for Glass Skin Market

  • Glass Skin Market Value (2025): USD 15,435.2 million
  • Glass Skin Market Forecast Value (2035): USD 42,020.7 million
  • Glass Skin Market Forecast CAGR: 10.5%
  • Leading Segment in Glass Skin Market in 2025: Skincare (78.3%)
  • Key Growth Regions in the Glass Skin Market: Asia-Pacific, North America, Europe
  • Top Key Players in Glass Skin Market:Laneige, Sulwhasoo, Innisfree, Etude House, Dr. Jart+, Tatcha, Missha, COSRX, Belif, Klairs

Glass Skin Market

Glass Skin Market Key Takeaways

Metric Value
Market Estimated Value in (2025E) USD 15,435.2 million
Market Forecast Value in (2035F) USD 42,020.7 million
Forecast CAGR (2025 to 2035) 10.5%

During the first five-year period from 2025 to 2030, the market increases from USD 15,435.2 million to USD 25,467.6 million, adding USD 10,032.4 million, which accounts for 37.7% of the total decade growth. This phase records steady adoption of premium skincare routines and K-beauty-inspired regimens, driven by consumer demand for hydration & moisture retention products. Skincare dominates this period with a 78.3% share, reflecting its strong position in the glass skin concept.

The second half from 2030 to 2035 contributes USD 16,553.1 million, equal to 62.3% of total growth, as the market jumps from USD 25,467.6 million to USD 42,020.7 million. This acceleration is powered by widespread global adoption, the rise of AI-driven personalized skincare recommendations, and expansion into emerging economies such as India and China. Online distribution channels capture a dominant 64.7% share by 2025 and continue to lead, supported by e-commerce marketplaces, social commerce, and DTC brand strategies. Leading players such as Laneige, Sulwhasoo, and Innisfree leverage digital-first campaigns to strengthen their market position.

From 2020 to 2024, the Glass Skin Market expanded steadily, driven primarily by skincare-centric adoption rooted in the K-beauty trend. During this period, the competitive landscape was dominated by established beauty brands controlling nearly 80% of revenue in the skincare category, with leaders such as Laneige, Sulwhasoo, and Innisfree focusing on hydration, moisture retention, and brightening formulations.

Competitive differentiation relied on product efficacy, ingredient innovation, and brand storytelling, while beauty tools and devices contributed a much smaller share to overall revenues. Service-based professional skincare solutions (e.g., dermatology clinics) had minimal traction, contributing less than 10% of the total market value.

Demand for glass skin products will grow to USD 15,435.2 million in 2025, with the revenue mix increasingly influenced by online distribution channels holding 64.7% share. Traditional beauty leaders face rising competition from niche digital-first brands leveraging social commerce, influencer-led campaigns, and direct-to-consumer strategies.

Major incumbents are pivoting toward AI-driven personalization and hybrid retail models to maintain relevance. Emerging entrants specializing in functional skincare (e.g., barrier repair, tone correction) and clean-label formulations are gaining share. Competitive advantage is shifting from brand heritage alone to ecosystem strength, digital scalability, and recurring consumer engagement.

Why the Glass Skin Market is growing?

The glass skin market is expanding rapidly as cities push for buildings that double as landmarks. Developers in regions like the UAE, Singapore, and Shanghai are using double-curved and fritted glass to create unique geometries that steel or concrete can’t match. Demand is also rising for blast-resistant and cyclone-rated facades in high-risk zones, turning glass skin into a safety as well as a style choice. This shift is fuelled by high-profile projects airports, sports arenas, and corporate headquarters that treat facades as brand statements visible from miles away.

Growth is further driven by the integration of advanced technologies into facades themselves. Photovoltaic glass panels now generate energy without altering aesthetics, while electrochromic glazing adjusts tint in real time to manage solar heat gain. These features allow developers to meet strict carbon-reduction targets while reducing operational costs. The convergence of performance, safety, and visual impact is pushing glass skin adoption far beyond luxury builds into public infrastructure and large-scale mixed-use projects cementing its role in the next wave of urban architecture.

Segmental Analysis

The glass skin-inspired beauty market can be divided into three main product categories: skincare, color cosmetics, and beauty tools & devices. The skincare segment includes cleansers in multiple formats (gel, foam, oil-based, balm), hydrating and exfoliating toners, active-rich essences and serums (hyaluronic acid, niacinamide, peptides, vitamin C), high-potency ampoules and concentrates, moisturizers (gel creams, emulsions, lotions), sheet and overnight masks, chemical and enzyme exfoliators, and sunscreens with hydrating, dewy-finish formulations.

Color cosmetics focus on achieving a luminous, natural finish, with products like skin tints and lightweight foundations, illuminating primers, dewy finish setting sprays, and liquid or cream highlighters. Beauty tools & devices encompass facial rollers and GuaSha tools, LED light masks, ultrasonic infusion devices, microcurrent devices, and skin analyzers, targeting both home-spa experiences and professional-level results.

These segments address functional benefits such as hydration and moisture retention, skin brightening and tone correction, barrier repair and strengthening, gentle exfoliation and smoothing, and delivering a radiant, luminous finish. Distribution channels are split into onlineincluding DTC brand websites, e-commerce marketplaces, and social commerce platformsand offline, which spans beauty retail chains, department stores, specialty boutiques, and dermatology clinics or medical spas.

Regionally, the scope spans North America, Latin America, Western and Eastern Europe, Balkan and Baltic countries, Russia and Belarus, Central Asia, East Asia, South Asia and Pacific, and the Middle East and Africa.
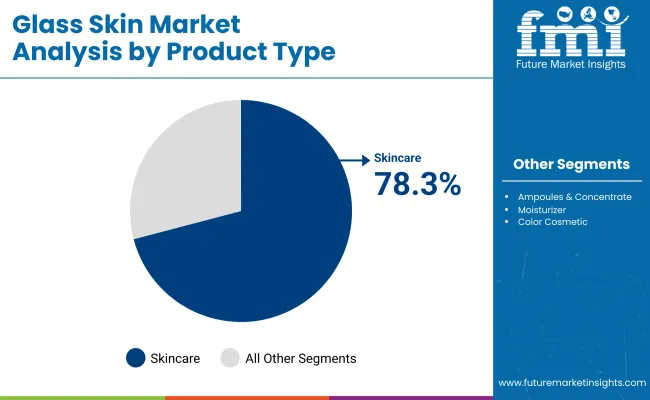
Insights into the Product Category Segment with Skincare Leading in Market Share

Glass Skin Market By Product

Product Category Value Share% 2025
Skincare 78.3%
Others 21.7%

The skincare segment is projected to contribute 78.3% of the glass skin-inspired beauty market revenue in 2025, maintaining its lead as the dominant product category. This is driven by sustained consumer preference for multi-step routines incorporating cleansers, toners, serums, moisturizers, and sunscreens formulated for hydration, brightening, and barrier repair.

The segment’s strength is further supported by innovation in active ingredients, texture formats, and hybrid skincare-makeup solutions that deliver both immediate radiance and long-term skin health benefits. Rising adoption of targeted treatments such as ampoules and sheet masks also fuels growth. Skincare is expected to remain the foundation of the glass skin trend globally.
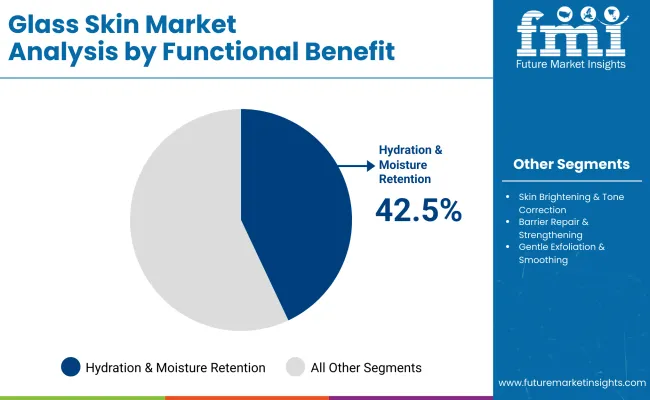
Insights into the Functional Benefit Segment with Hydration & Moisture Retention Dominating the Demand

Glass Skin Market By Functional

Functional Benefit Value Share% 2025
Hydration & Moisture Retention 42.5%
Others 57.5%

The hydration and moisture retention segment is projected to contribute 42.5% of the glass skin-inspired beauty market revenue in 2025, retaining its position as the leading functional benefit. This dominance is driven by strong consumer demand for products that deliver deep, long-lasting hydration essential for achieving the smooth, dewy complexion associated with the glass skin aesthetic.

Advances in formulations featuring hyaluronic acid, ceramides, and botanical humectants are enhancing product efficacy and appeal. Seasonal climate variations, increased screen exposure, and urban pollution are further boosting the need for moisture-locking solutions. Hydration-focused products are expected to remain a core driver of category growth worldwide.

Insights into the Distribution Channel Segment with Focus on Online Retailers

Distribution Channel Value Share% 2025
Online 64.7%
Others 35.3%

The online retail segment is projected to contribute 64.7% of the glass skin-inspired beauty market revenue in 2025, solidifying its position as the primary distribution channel. Growth is fueled by the dominance of e-commerce marketplaces, direct-to-consumer brand websites, and social commerce platforms, which offer consumers convenience, product variety, and access to global brands. Influencer-driven marketing, livestream shopping, and personalized recommendations are further accelerating digital sales.

Mobile-first shopping behaviors, particularly in Asia-Pacific, are enhancing platform engagement and conversion rates. As virtual try-on tools and AI-powered skin analysis become mainstream, online retail is expected to remain the leading driver of market accessibility and expansion.

What are the Drivers, Restraints, and Key Trends of the Glass Skin Market?

Shift Toward Layer-Friendly Formulations

A growing number of skincare brands are engineering products with ultra-light textures and low pH balance, specifically designed to layer without pilling. This is crucial for glass skin enthusiasts, who may apply six to eight products in one routine. By focusing on molecular compatibility and absorption rates, brands are enabling consumers to stack multiple actives without irritationsomething that was far harder with older, heavier formulations. This “layer-ability” is becoming a unique selling point and a key growth driver, as it addresses a functional need at the core of the glass skin ritual.

Rise of Dew-Enhancing SPF HybridsSPF is no longer seen as a final, matte stepit’s becoming an integral part of the glow. Formulations that combine high UVA/UVB protection with humectants, light-reflecting particles, and skin-tone blurring technology are gaining rapid traction. These SPF hybrids allow consumers to skip a makeup step while still achieving the luminous finish, especially appealing in hot and humid climates where heavy cosmetics don’t last. The dual function also improves compliance, making daily SPF use more appealing to younger demographics who are focused on prevention over correction.

Incompatibility of Certain Actives in Multi-Step RoutinesWhile layering is core to the glass skin approach, it comes with the challenge of active ingredient incompatibility. For example, using strong exfoliating acids alongside high concentrations of retinoids or vitamin C can cause irritation or reduce efficacy. This not only risks adverse skin reactions but also creates consumer confusion about “what goes with what.” Such concerns can deter new users from adopting full routines and push them toward simplified skincare, slowing down the expansion of multi-step product sales.

Skin Barrier-First Glass SkinA notable shift is the redefinition of glass skin from being purely about surface radiance to representing a healthy, resilient skin barrier. Post-pandemic, many consumers experienced skin sensitivity from over-exfoliation, mask use, or aggressive actives. This has fueled demand for barrier-supporting productsceramide-rich essences, probiotic-infused serums, and pH-restoring tonersthat still deliver a luminous finish. The trend blends the glow aesthetic with long-term dermal health, and brands are now marketing “barrier glass skin” as a safer, more sustainable interpretation of the look.
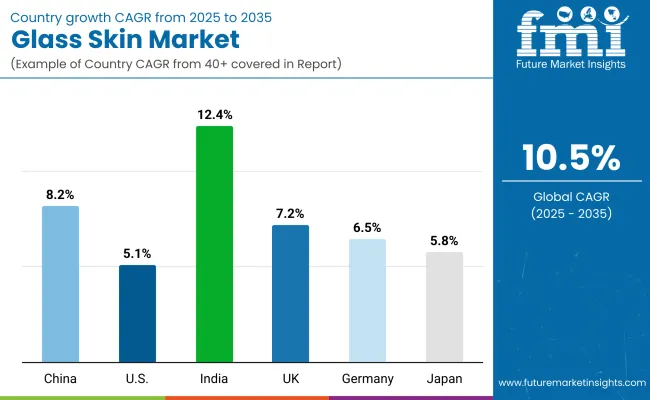
Analysis of Glass Skin Market By Key Countries

Glass Skin Market By Country

Countries Estimated CAGR (2025 to 2035)
China 8.2%
USA 5.1%
India 12.4%
UK 7.2%
Germany 6.5%
Japan 5.8%

The glass skin market shows varied growth potential across key countries, with India emerging as the fastest-growing market at an estimated 12.4% CAGR between 2025 and 2035, driven by a rapidly expanding beauty-conscious consumer base, rising disposable incomes, and the growing influence of K-beauty-inspired skincare. China, with a projected 8.2% CAGR, remains a powerhouse due to its strong e-commerce infrastructure, domestic brand innovation, and high adoption of multi-step skincare regimens.

The UK and Germany are set to grow at 7.2% and 6.5% respectively, supported by premium beauty demand and clean formulation trends. Japan is expected to see steady growth at 5.8%, benefiting from its reputation for high-quality skincare innovation and product safety. Meanwhile, the USA market, growing at 5.1%, will be driven by hybrid skincare-makeup innovations and the increasing popularity of influencer-led product launches. Overall, Asia-Pacific leads in both growth rate and cultural influence, while Western markets focus on premium positioning and multifunctional product formats.

Sales Outlook for Glass Skin in the United States

Year USA Glass Skin Market (USD Million)
2025 4028.59
2026 4383.43
2027 4769.53
2028 5189.64
2029 5646.75
2030 6144.13
2031 6685.32
2032 7274.17
2033 7914.89
2034 8612.05
2035 9370.62

The USA glass skin market is projected to experience steady growth from USD 4,028.59 million in 2025 to USD 9,370.62 million by 2035, reflecting a consistent upward trajectory. This growth is underpinned by rising consumer interest in hybrid skincare-makeup products, the influence of social media-driven beauty trends, and the adoption of advanced formulations targeting hydration, radiance, and skin barrier health.

The market is set to cross the USD 6 billion mark by 2030, supported by strong e-commerce expansion, celebrity brand endorsements, and technological integration in beauty devices. Post-2030, growth will be fueled by premium product adoption and the continued mainstreaming of multi-step skincare routines. The CAGR over this period indicates sustained demand across both mass and prestige segments, with online retail remaining a dominant channel for sales.

Growth and Expansion Outlook for Glass Skin Market in the United Kingdom

The Glass Skin Market in the United States is expected to grow from USD 4,028.59 million in 2025 to USD 9,370.62 million by 2035, registering sustained growth driven by innovation in hybrid skincare-makeup products, increased adoption of multi-step routines, and advancements in beauty device integration. Influencer-led marketing campaigns, coupled with the rise of SPF hybrids and barrier-repair-focused formulations, are fueling consumer interest.

Premium skincare brands are capitalizing on clean beauty positioning, while mass-market players leverage affordable yet high-performance formulations to expand reach. Online retail continues to dominate, supported by AI-based skin analysis tools and virtual try-on experiences that enhance digital purchasing confidence.

  • Premium and mass brands are introducing SPF-infused luminous finish products tailored to USA skin tones and climate.
  • Beauty-tech devices such as LED masks and microcurrent tools are being paired with skincare products for enhanced results.
  • E-commerce platforms are integrating personalized skincare quizzes and AR try-on tools to boost conversion rates.

Growth and Expansion Outlook for Glass Skin Market in India

India is experiencing the fastest growth in the Glass Skin Market, with a forecast CAGR of 12.4% through 2035, driven by a surge in beauty-conscious consumers across both metro and tier-2 cities. Expanding access to global beauty brands via e-commerce platforms, coupled with rising influence of K-beauty-inspired multi-step routines, is fueling demand.

Domestic and international brands are launching cost-effective yet high-performance formulations tailored to Indian skin types and climates, particularly focusing on hydration and brightening benefits. Social media platforms, influencer-driven tutorials, and regional language content are accelerating awareness and adoption, while dermatology clinics and beauty tech devices are making advanced skincare more accessible.

  • Affordable, high-efficacy skincare lines are penetrating tier-2 and tier-3 city markets.
  • Domestic brands are blending Ayurvedic ingredients with glass skin formulations to appeal to local preferences.
  • Online marketplaces and social commerce platforms are expanding regional reach through vernacular marketing campaigns.

Sales Outlook for Glass Skin in China

The Glass Skin Market in China is expected to grow at a CAGR of 8.2%, one of the strongest among leading economies, supported by high consumer adoption of multi-step skincare regimens and continuous innovation from domestic beauty brands. The market is benefiting from the rapid expansion of e-commerce platforms like Tmall and JD.com, livestream selling, and influencer-led marketing campaigns that drive immediate purchase decisions.

Local companies are introducing competitively priced yet premium-quality formulations enriched with actives such as niacinamide, hyaluronic acid, and ginseng, catering to the demand for hydration, brightening, and anti-aging benefits. Cross-category expansion into SPF hybrids, skin tints, and beauty-tech devices is further boosting market momentum.

  • Livestream e-commerce is accelerating direct consumer engagement and sales conversion.
  • Domestic brands are innovating with traditional Chinese ingredients to differentiate products.
  • Competitive pricing and rapid product launch cycles are enabling mass adoption across both urban and tier-2 cities.

In-depth Analysis of Glass Skin in Germany

Countries 2025 Share (%)
USA 25.1%
China 10.5%
Japan 7.2%
Germany 9.3%
UK 8.6%
India 5.5%
Countries 2035 Share (%)
USA 22.3%
China 13.5%
Japan 8.4%
Germany 14.2%
UK 9.5%
India 6.8%

Germany’s share of the global glass skin market is poised to climb from 9.3% in 2025 to 14.2% by 2035, reflecting a pronounced shift from niche trend to mainstream daily regimen within a highly regulated, quality-driven market. Growth is being driven less by fast-fashion influencer cycles and more by product credibilitydermatologically tested actives, clinically-backed hydration systems (multi-molecular hyaluronic complexes, ceramide blends), and multifunctional formulations that meet EU safety and labeling standards.

German consumers favour evidence over hype, so brands that offer transparent testing data, microbiome-friendly claims, and recyclable packaging gain disproportionate traction. The country’s strong pharmacy (Apotheke) channel and drugstore innovation pipeline (masstige launches with clinical claims) create reliable distribution for both prestige and mass players. Meanwhile, demand from aging but skin-conscious cohortsplus rising male grooming adoptionsupports premiumization of hydration and barrier-repair SKUs, while indie brands leverage regional botanicals and clean-certifications to capture urban millennial shoppers.

  • Pharmacy and clinical channels are key trust gateways for new product launches.
  • Barrier-first, clinically validated hydration lines outperform purely aesthetic glow products.
  • Sustainability credentials and ingredient transparency materially influence purchase intent.

Growth Outlook for Glass Skin Market in USA

USA By Product Category Value Share% 2025
Skincare 75.2%
Others 24.8%

The Glass Skin Market in the United States is projected to be valued at USD 4,028.59 million in 2025, with skincare dominating at 75.2% of category share and “others” accounting for 24.8%. This clear segment dominance reflects the deep-rooted consumer preference for targeted skincare solutionshydration serums, barrier-repair creams, SPF hybrids, and brightening treatmentsthat deliver both functional results and the luminous aesthetic associated with the glass skin trend.

The market is also seeing accelerated adoption of hybrid formats such as serum foundations and moisturizer-primers, appealing to time-conscious consumers seeking efficiency without compromising skin health. Growth is further supported by the integration of beauty-tech devices and AI-driven skin analysis tools into retail and online shopping journeys, enabling personalized product recommendations. Premium skincare continues to gain momentum, while mass-market brands leverage affordable, active-rich products to capture younger demographics.

  • Skincare commands 75.2% market share in 2025, solidifying its leadership.
  • Hybrid skincare-makeup formats are expanding rapidly in both prestige and mass segments.
  • AI-powered personalization tools are enhancing consumer engagement and driving sales conversions.

Opportunity Analysis of China Glass Skin Market

China By Functional Benefit Value Share% 2025
Hydration & Moisture Retention 42.5%
Others 57.5%

The Glass Skin Market in China is projected to hold a 42.5% share for the hydration and moisture retention functional benefit segment in 2025, reflecting the country’s strong alignment between consumer needs and the core glass skin aesthetic. This dominance stems from China’s climate diversityranging from dry northern winters to humid southern summerswhich drives year-round demand for moisture-locking products that deliver a dewy, plump complexion.

Domestic and international brands are leveraging advanced humectants, fermented extracts, and botanical actives to create high-performance hydrating serums, essences, and ampoules specifically formulated for Chinese skin types. E-commerce livestreaming and social commerce platforms like Taobao Live and Douyin are amplifying awareness and encouraging impulse purchases of hydration-focused routines. As consumer education on skin barrier health deepens, brands combining hydration benefits with secondary claims such as brightening and anti-aging are expected to see accelerated growth.
  • Hydration & moisture retention accounts for 42.5% of China’s functional benefit segment in 2025.
  • Climate-driven year-round demand supports consistent product adoption.
  • Social commerce and livestreaming are major drivers for hydration-focused product sales.

Competitive Landscape of Glass Skin Market

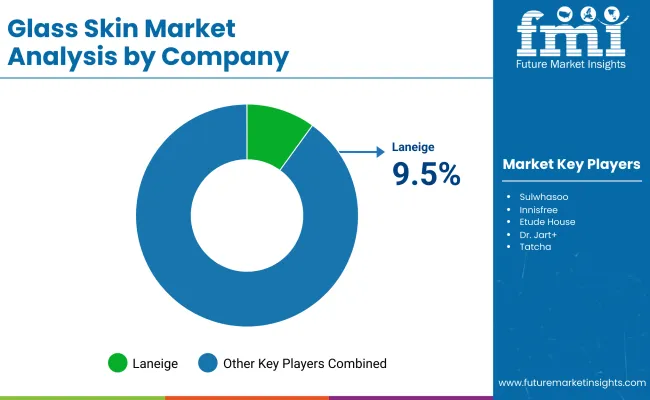
Glass Skin Market By Company

The Glass Skin Market in 2025 is led by Laneige, holding a 9.5% global value share, with the remaining 90.5% distributed among a highly fragmented set of competitors. Laneige’s leadership is anchored by its hero products, particularly its Water Bank line and Sleeping Masks, which directly address the hydration and moisture retention needs central to the glass skin aesthetic. The brand’s strong presence in Asia-Pacific, combined with strategic expansion into North America and Europe via Sephora and other premium retailers, has reinforced its global visibility.

Heavy investment in social media campaigns, K-beauty storytelling, and influencer partnerships has helped Laneige maintain a premium yet approachable positioning. The rest of the market consists of both established multinational skincare brands and emerging indie labels leveraging niche formulations, localized ingredients, and competitive pricing to capture market share. As consumer interest in multi-step routines grows, competition is expected to intensify, particularly in the hydration and barrier-repair subcategories.

  • Laneige leads with 9.5% global value share in 2025.
  • Core products align with glass skin’s hydration-focused foundation.
  • Market remains highly fragmented, offering growth opportunities for niche and emerging players.

Key Developments in GLASS SKIN Market

  • 2024 - Launch of SPF-Infused Dewy Primers - Several premium and mid-tier brands introduced SPF-infused illuminating primers, combining sun protection with a radiant finish, aligning perfectly with the glass skin aesthetic while simplifying daily routines.
  • 2025 - AI Skin Analysis Integration in E-Commerce - Leading beauty e-commerce platforms in Asia-Pacific and North America implemented AI-powered skin analysis tools, enabling personalized product recommendations for glass skin routines and driving higher online sales conversions.

Scope of the Report

Item Value
Quantitative Units USD 15,435.2 Million
Product Category Skincare - Cleansers (gel, foam, oil-based, balm), Toners & Mists (hydrating, exfoliating), Essences & Serums (hyaluronic acid, niacinamide, peptides, vitamin C), Ampoules & Concentrates, Moisturizers (gel creams, emulsions, lotions), Sheet Masks & Overnight Masks, Exfoliators (chemical peels, enzyme scrubs), Sunscreens (hydrating, dewy-finish formulations). Color Cosmetics - Skin Tints & Lightweight Foundations, Illuminating Primers, Dewy Finish Setting Sprays, Liquid & Cream Highlighters. Beauty Tools & Devices - Facial Rollers & Gua Sha Tools, LED Light Masks, Ultrasonic Infusion Devices, Microcurrent Devices, Skin Analyzers.
Functional Benefit Hydration & Moisture Retention, Skin Brightening & Tone Correction, Barrier Repair & Strengthening, Gentle Exfoliation & Smoothing, Radiance & Luminous Finish.
Distribution Channel DTC Brand Websites, E-commerce Marketplaces (Amazon, YesStyle, StyleKorean), Social Commerce (Instagram, TikTok shops, WeChat mini-programs). Offline: Beauty Retail Chains (Sephora, Ulta, Olive Young), Department Stores, Specialty Beauty Boutiques, Dermatology Clinics & Medical Spas.
Regions Covered North America, Europe, Asia-Pacific, Latin America, Middle East & Africa
Country Covered United States, Canada, Germany, France, United Kingdom, China, Japan, India, Brazil, South Africa
Key Companies Profiled Laneige, Sulwhasoo, Innisfree, Etude House, Dr. Jart +, Tatcha, Missha, COSRX, Belif, Klairs.
Additional Attributes Additional Attributes: dollar sales by product category and SKU, reven ue split by functional benefit, channel mix and conversion rates across DTC, marketplaces, and social commerce, influencer and livestream ROI metrics, adoption ra tes and ASPs for beauty devices, ingredient-le vel penetration, SKU churn and new-product launch velocity, private-label and pharmacy-brand share, price-tier segmentation, seasonal and climate-driven demand patterns, sustainability and recyclability adoption in packaging, regulatory & clean-label certification impact, re gional assortment localization, returns and trial-to-repeat purchase ratios, retail planogram depth and omni -channel attribution, R&D spend on stable active delivery systems and hybrid formulations, patent filings and ingredient exclusivity deals, and integration with AR/AI skin-analysis tools for personalization.

Key Segments

By Product Category:

  • Skincare
    • Cleansers (gel, foam, oil-based, balm)
    • Toners & Mists (hydrating, exfoliating)
    • Essences & Serums (hyaluronic acid, niacinamide, peptides, vitamin C)
    • Ampoules & Concentrates
    • Moisturizers (gel creams, emulsions, lotions)
    • Sheet Masks & Overnight Masks
    • Exfoliators (chemical peels, enzyme scrubs)
    • Sunscreens (hydrating, dewy-finish formulations)
  • Color Cosmetics
    • Skin Tints & Lightweight Foundations
    • Illuminating Primers
    • Dewy Finish Setting Sprays
    • Liquid & Cream Highlighters
  • Beauty Tools & Devices
    • Facial Rollers & Gua Sha Tools
    • LED Light Masks
    • Ultrasonic Infusion Devices
    • Microcurrent Devices
    • Skin Analyzers

By Functional Benefit:

  • Hydration & Moisture Retention
  • Skin Brightening & Tone Correction
  • Barrier Repair & Strengthening
  • Gentle Exfoliation & Smoothing
  • Radiance & Luminous Finish

By Distribution Channel:

  • Online
    • DTC Brand Websites
    • E-commerce Marketplaces (Amazon, YesStyle, StyleKorean)
    • Social Commerce (Instagram, TikTok shops, WeChat mini-programs)
  • Offline
    • Beauty Retail Chains (Sephora, Ulta, Olive Young)
    • Department Stores
    • Specialty Beauty Boutiques
    • Dermatology Clinics & Medical Spas

By Region:

  • North America
  • Latin America
  • Europe
  • East Asia
  • South Asia & Pacific
  • Middle East and Africa

Table of Content

  1. Executive Summary
    • Global Market Outlook
    • Demand-side Trends
    • Supply-side Trends
    • Technology Roadmap Analysis
    • Analysis and Recommendations
  2. Market Overview
    • Market Coverage / Taxonomy
    • Market Definition / Scope / Limitations
  3. Market Background
    • Market Dynamics
      • Drivers
      • Restraints
      • Opportunity
      • Trends
    • Scenario Forecast
      • Demand in Optimistic Scenario
      • Demand in Likely Scenario
      • Demand in Conservative Scenario
    • Opportunity Map Analysis
    • Product Life Cycle Analysis
    • Supply Chain Analysis
      • Supply Side Participants and their Roles
        • Producers
        • Mid-Level Participants (Traders/ Agents/ Brokers)
        • Wholesalers and Distributors
      • Value Added and Value Created at Node in the Supply Chain
      • List of Raw Material Suppliers
      • List of Existing and Potential Buyer’s
    • Investment Feasibility Matrix
    • Value Chain Analysis
      • Profit Margin Analysis
      • Wholesalers and Distributors
      • Retailers
    • PESTLE and Porter’s Analysis
    • Regulatory Landscape
      • By Key Regions
      • By Key Countries
    • Regional Parent Market Outlook
    • Production and Consumption Statistics
    • Import and Export Statistics
  4. Global Market Analysis 2020 to 2024 and Forecast, 2025 to 2035
    • Historical Market Size Value (USD Million) & Volume (Units) Analysis, 2020 to 2024
    • Current and Future Market Size Value (USD Million) & Volume (Units) Projections, 2025 to 2035
      • Y-o-Y Growth Trend Analysis
      • Absolute $ Opportunity Analysis
  5. Global Market Analysis 2020 to 2024 and Forecast 2025 to 2035, By Product Category
    • Introduction / Key Findings
    • Historical Market Size Value (USD Million) & Volume (Units) Analysis By Product Category, 2020 to 2024
    • Current and Future Market Size Value (USD Million) & Volume (Units) Analysis and Forecast By Product Category, 2025 to 2035
      • Skincare
        • Cleansers (gel, foam, oil-based, balm)
        • Toners & Mists (hydrating, exfoliating)
        • Essences & Serums (hyaluronic acid, niacinamide, peptides, vitamin C)
        • Ampoules & Concentrates
        • Moisturizers (gel creams, emulsions, lotions)
        • Sheet Masks & Overnight Masks
        • Exfoliators (chemical peels, enzyme scrubs)
        • Sunscreens (hydrating, dewy-finish formulations)
      • Color Cosmetics
        • Skin Tints & Lightweight Foundations
        • Illuminating Primers
        • Dewy Finish Setting Sprays
        • Liquid & Cream Highlighters
      • Beauty Tools & Devices
        • Facial Rollers & Gua Sha Tools
        • LED Light Masks
        • Ultrasonic Infusion Devices
        • Microcurrent Devices
        • Skin Analyzers
    • Y-o-Y Growth Trend Analysis By Product Category, 2020 to 2024
    • Absolute $ Opportunity Analysis By Product Category, 2025 to 2035
  6. Global Market Analysis 2020 to 2024 and Forecast 2025 to 2035, By Functional Benefit
    • Introduction / Key Findings
    • Historical Market Size Value (USD Million) & Volume (Units) Analysis By Functional Benefit, 2020 to 2024
    • Current and Future Market Size Value (USD Million) & Volume (Units) Analysis and Forecast By Functional Benefit, 2025 to 2035
      • Hydration & Moisture Retention
      • Skin Brightening & Tone Correction
      • Barrier Repair & Strengthening
      • Gentle Exfoliation & Smoothing
      • Radiance & Luminous Finish
    • Y-o-Y Growth Trend Analysis By Functional Benefit, 2020 to 2024
    • Absolute $ Opportunity Analysis By Functional Benefit, 2025 to 2035
  7. Global Market Analysis 2020 to 2024 and Forecast 2025 to 2035, By Distribution Channel
    • Introduction / Key Findings
    • Historical Market Size Value (USD Million) & Volume (Units) Analysis By Distribution Channel, 2020 to 2024
    • Current and Future Market Size Value (USD Million) & Volume (Units) Analysis and Forecast By Distribution Channel, 2025 to 2035
      • Online
        • DTC Brand Websites
        • E-commerce Marketplaces (Amazon, YesStyle, StyleKorean)
        • Social Commerce (Instagram, TikTok shops, WeChat mini-programs)
      • Offline
        • Beauty Retail Chains (Sephora, Ulta, Olive Young)
        • Department Stores
        • Specialty Beauty Boutiques
        • Dermatology Clinics & Medical Spas
    • Y-o-Y Growth Trend Analysis By Distribution Channel, 2020 to 2024
    • Absolute $ Opportunity Analysis By Distribution Channel, 2025 to 2035
  8. Global Market Analysis 2020 to 2024 and Forecast 2025 to 2035, By Region
    • Introduction
    • Historical Market Size Value (USD Million) & Volume (Units) Analysis By Region, 2020 to 2024
    • Current Market Size Value (USD Million) & Volume (Units) Analysis and Forecast By Region, 2025 to 2035
      • North America
      • Latin America
      • Europe
      • East Asia
      • South Asia & Pacific
      • Middle East and Africa
    • Market Attractiveness Analysis By Region
  9. North America Market Analysis 2020 to 2024 and Forecast 2025 to 2035, By Country
    • Historical Market Size Value (USD Million) & Volume (Units) Trend Analysis By Market Taxonomy, 2020 to 2024
    • Market Size Value (USD Million) & Volume (Units) Forecast By Market Taxonomy, 2025 to 2035
      • By Country
        • USA
        • Canada
      • By Product Category
      • By Functional Benefit
      • By Distribution Channel
    • Market Attractiveness Analysis
      • By Country
      • By Product Category
      • By Functional Benefit
      • By Distribution Channel
    • Key Takeaways
  10. Latin America Market Analysis 2020 to 2024 and Forecast 2025 to 2035, By Country
    • Historical Market Size Value (USD Million) & Volume (Units) Trend Analysis By Market Taxonomy, 2020 to 2024
    • Market Size Value (USD Million) & Volume (Units) Forecast By Market Taxonomy, 2025 to 2035
      • By Country
        • Brazil
        • Mexico
        • Colombia
        • Rest of Latin America
      • By Product Category
      • By Functional Benefit
      • By Distribution Channel
    • Market Attractiveness Analysis
      • By Country
      • By Product Category
      • By Functional Benefit
      • By Distribution Channel
    • Key Takeaways
  11. Europe Market Analysis 2020 to 2024 and Forecast 2025 to 2035, By Country
    • Historical Market Size Value (USD Million) & Volume (Units) Trend Analysis By Market Taxonomy, 2020 to 2024
    • Market Size Value (USD Million) & Volume (Units) Forecast By Market Taxonomy, 2025 to 2035
      • By Country
        • Germany
        • UK
        • France
        • Italy
        • Spain
        • Belgium
        • Netherlands
        • Nordic
        • Switzerland
        • Russia
        • Poland
        • Rest of Europe
      • By Product Category
      • By Functional Benefit
      • By Distribution Channel
    • Market Attractiveness Analysis
      • By Country
      • By Product Category
      • By Functional Benefit
      • By Distribution Channel
    • Key Takeaways
  12. East Asia Market Analysis 2020 to 2024 and Forecast 2025 to 2035, By Country
    • Historical Market Size Value (USD Million) & Volume (Units) Trend Analysis By Market Taxonomy, 2020 to 2024
    • Market Size Value (USD Million) & Volume (Units) Forecast By Market Taxonomy, 2025 to 2035
      • By Country
        • China
        • Japan
        • South Korea
      • By Product Category
      • By Functional Benefit
      • By Distribution Channel
    • Market Attractiveness Analysis
      • By Country
      • By Product Category
      • By Functional Benefit
      • By Distribution Channel
    • Key Takeaways
  13. South Asia & Pacific Market Analysis 2020 to 2024 and Forecast 2025 to 2035, By Country
    • Historical Market Size Value (USD Million) & Volume (Units) Trend Analysis By Market Taxonomy, 2020 to 2024
    • Market Size Value (USD Million) & Volume (Units) Forecast By Market Taxonomy, 2025 to 2035
      • By Country
        • India
        • Thailand
        • Malaysia
        • Indonesia
        • Singapore
        • Vietnam
        • Australia
        • New Zealand
        • Rest of South Asia
      • By Product Category
      • By Functional Benefit
      • By Distribution Channel
    • Market Attractiveness Analysis
      • By Country
      • By Product Category
      • By Functional Benefit
      • By Distribution Channel
    • Key Takeaways
  14. Middle East and Africa Market Analysis 2020 to 2024 and Forecast 2025 to 2035, By Country
    • Historical Market Size Value (USD Million) & Volume (Units) Trend Analysis By Market Taxonomy, 2020 to 2024
    • Market Size Value (USD Million) & Volume (Units) Forecast By Market Taxonomy, 2025 to 2035
      • By Country
        • Turkey
        • UAE
        • Saudi Arabia
        • Israel
        • Other GCC Countries
        • North Africa
        • South Africa
      • By Product Category
      • By Functional Benefit
      • By Distribution Channel
    • Market Attractiveness Analysis
      • By Country
      • By Product Category
      • By Functional Benefit
      • By Distribution Channel
    • Key Takeaways
  15. Key Countries Market Analysis
    • USA
      • Pricing Analysis
      • Market Share Analysis, 2024
        • By Product Category
        • By Functional Benefit
        • By Distribution Channel
    • Canada
      • Pricing Analysis
      • Market Share Analysis, 2024
        • By Product Category
        • By Functional Benefit
        • By Distribution Channel
    • Brazil
      • Pricing Analysis
      • Market Share Analysis, 2024
        • By Product Category
        • By Functional Benefit
        • By Distribution Channel
    • Mexico
      • Pricing Analysis
      • Market Share Analysis, 2024
        • By Product Category
        • By Functional Benefit
        • By Distribution Channel
    • Colombia
      • Pricing Analysis
      • Market Share Analysis, 2024
        • By Product Category
        • By Functional Benefit
        • By Distribution Channel
    • Germany
      • Pricing Analysis
      • Market Share Analysis, 2024
        • By Product Category
        • By Functional Benefit
        • By Distribution Channel
    • UK
      • Pricing Analysis
      • Market Share Analysis, 2024
        • By Product Category
        • By Functional Benefit
        • By Distribution Channel
    • France
      • Pricing Analysis
      • Market Share Analysis, 2024
        • By Product Category
        • By Functional Benefit
        • By Distribution Channel
    • Italy
      • Pricing Analysis
      • Market Share Analysis, 2024
        • By Product Category
        • By Functional Benefit
        • By Distribution Channel
    • Spain
      • Pricing Analysis
      • Market Share Analysis, 2024
        • By Product Category
        • By Functional Benefit
        • By Distribution Channel
    • Belgium
      • Pricing Analysis
      • Market Share Analysis, 2024
        • By Product Category
        • By Functional Benefit
        • By Distribution Channel
    • Netherlands
      • Pricing Analysis
      • Market Share Analysis, 2024
        • By Product Category
        • By Functional Benefit
        • By Distribution Channel
    • Nordic
      • Pricing Analysis
      • Market Share Analysis, 2024
        • By Product Category
        • By Functional Benefit
        • By Distribution Channel
    • Switzerland
      • Pricing Analysis
      • Market Share Analysis, 2024
        • By Product Category
        • By Functional Benefit
        • By Distribution Channel
    • Russia
      • Pricing Analysis
      • Market Share Analysis, 2024
        • By Product Category
        • By Functional Benefit
        • By Distribution Channel
    • Poland
      • Pricing Analysis
      • Market Share Analysis, 2024
        • By Product Category
        • By Functional Benefit
        • By Distribution Channel
    • China
      • Pricing Analysis
      • Market Share Analysis, 2024
        • By Product Category
        • By Functional Benefit
        • By Distribution Channel
    • Japan
      • Pricing Analysis
      • Market Share Analysis, 2024
        • By Product Category
        • By Functional Benefit
        • By Distribution Channel
    • South Korea
      • Pricing Analysis
      • Market Share Analysis, 2024
        • By Product Category
        • By Functional Benefit
        • By Distribution Channel
    • India
      • Pricing Analysis
      • Market Share Analysis, 2024
        • By Product Category
        • By Functional Benefit
        • By Distribution Channel
    • Thailand
      • Pricing Analysis
      • Market Share Analysis, 2024
        • By Product Category
        • By Functional Benefit
        • By Distribution Channel
    • Indonesia
      • Pricing Analysis
      • Market Share Analysis, 2024
        • By Product Category
        • By Functional Benefit
        • By Distribution Channel
    • Australia
      • Pricing Analysis
      • Market Share Analysis, 2024
        • By Product Category
        • By Functional Benefit
        • By Distribution Channel
    • New Zealand
      • Pricing Analysis
      • Market Share Analysis, 2024
        • By Product Category
        • By Functional Benefit
        • By Distribution Channel
    • Turkey
      • Pricing Analysis
      • Market Share Analysis, 2024
        • By Product Category
        • By Functional Benefit
        • By Distribution Channel
    • UAE
      • Pricing Analysis
      • Market Share Analysis, 2024
        • By Product Category
        • By Functional Benefit
        • By Distribution Channel
    • Saudi Arabia
      • Pricing Analysis
      • Market Share Analysis, 2024
        • By Product Category
        • By Functional Benefit
        • By Distribution Channel
    • Israel
      • Pricing Analysis
      • Market Share Analysis, 2024
        • By Product Category
        • By Functional Benefit
        • By Distribution Channel
    • North Africa
      • Pricing Analysis
      • Market Share Analysis, 2024
        • By Product Category
        • By Functional Benefit
        • By Distribution Channel
    • South Africa
      • Pricing Analysis
      • Market Share Analysis, 2024
        • By Product Category
        • By Functional Benefit
        • By Distribution Channel
  16. Market Structure Analysis
    • Competition Dashboard
    • Competition Benchmarking
    • Market Share Analysis of Top Players
      • By Regional
      • By Product Category
      • By Functional Benefit
      • By Distribution Channel
  17. Competition Analysis
    • Competition Deep Dive
      • Laneige
        • Overview
        • Product Portfolio
        • Profitability by Market Segments (Product/Age /Sales Channel/Region)
        • Sales Footprint
        • Strategy Overview
          • Marketing Strategy
          • Product Strategy
          • Channel Strategy
      • Sulwhasoo
        • Overview
        • Product Portfolio
        • Profitability by Market Segments (Product/Age /Sales Channel/Region)
        • Sales Footprint
        • Strategy Overview
          • Marketing Strategy
          • Product Strategy
          • Channel Strategy
      • Innisfree
        • Overview
        • Product Portfolio
        • Profitability by Market Segments (Product/Age /Sales Channel/Region)
        • Sales Footprint
        • Strategy Overview
          • Marketing Strategy
          • Product Strategy
          • Channel Strategy
      • Etude House
        • Overview
        • Product Portfolio
        • Profitability by Market Segments (Product/Age /Sales Channel/Region)
        • Sales Footprint
        • Strategy Overview
          • Marketing Strategy
          • Product Strategy
          • Channel Strategy
      • Dr. Jart+
        • Overview
        • Product Portfolio
        • Profitability by Market Segments (Product/Age /Sales Channel/Region)
        • Sales Footprint
        • Strategy Overview
          • Marketing Strategy
          • Product Strategy
          • Channel Strategy
      • Tatcha
        • Overview
        • Product Portfolio
        • Profitability by Market Segments (Product/Age /Sales Channel/Region)
        • Sales Footprint
        • Strategy Overview
          • Marketing Strategy
          • Product Strategy
          • Channel Strategy
      • Missha
        • Overview
        • Product Portfolio
        • Profitability by Market Segments (Product/Age /Sales Channel/Region)
        • Sales Footprint
        • Strategy Overview
          • Marketing Strategy
          • Product Strategy
          • Channel Strategy
      • COSRX
        • Overview
        • Product Portfolio
        • Profitability by Market Segments (Product/Age /Sales Channel/Region)
        • Sales Footprint
        • Strategy Overview
          • Marketing Strategy
          • Product Strategy
          • Channel Strategy
      • Belif
        • Overview
        • Product Portfolio
        • Profitability by Market Segments (Product/Age /Sales Channel/Region)
        • Sales Footprint
        • Strategy Overview
          • Marketing Strategy
          • Product Strategy
          • Channel Strategy
      • Klairs
        • Overview
        • Product Portfolio
        • Profitability by Market Segments (Product/Age /Sales Channel/Region)
        • Sales Footprint
        • Strategy Overview
          • Marketing Strategy
          • Product Strategy
          • Channel Strategy
      • Others
        • Overview
        • Product Portfolio
        • Profitability by Market Segments (Product/Age /Sales Channel/Region)
        • Sales Footprint
        • Strategy Overview
          • Marketing Strategy
          • Product Strategy
          • Channel Strategy
  18. Assumptions & Acronyms Used
  19. Research Methodology

List of Tables

  • Table 1: Global Market Value (USD Million) Forecast by Region, 2020-2035
  • Table 2: Global Market Volume (Units) Forecast by Region, 2020-2035
  • Table 3: Global Market Value (USD Million) Forecast by Product Category, 2020-2035
  • Table 4: Global Market Volume (Units) Forecast by Product Category, 2020-2035
  • Table 5: Global Market Value (USD Million) Forecast by Functional Benefit, 2020-2035
  • Table 6: Global Market Volume (Units) Forecast by Functional Benefit, 2020-2035
  • Table 7: Global Market Value (USD Million) Forecast by Distribution Channel, 2020-2035
  • Table 8: Global Market Volume (Units) Forecast by Distribution Channel, 2020-2035
  • Table 9: North America Market Value (USD Million) Forecast by Country, 2020-2035
  • Table 10: North America Market Volume (Units) Forecast by Country, 2020-2035
  • Table 11: North America Market Value (USD Million) Forecast by Product Category, 2020-2035
  • Table 12: North America Market Volume (Units) Forecast by Product Category, 2020-2035
  • Table 13: North America Market Value (USD Million) Forecast by Functional Benefit, 2020-2035
  • Table 14: North America Market Volume (Units) Forecast by Functional Benefit, 2020-2035
  • Table 15: North America Market Value (USD Million) Forecast by Distribution Channel, 2020-2035
  • Table 16: North America Market Volume (Units) Forecast by Distribution Channel, 2020-2035
  • Table 17: Latin America Market Value (USD Million) Forecast by Country, 2020-2035
  • Table 18: Latin America Market Volume (Units) Forecast by Country, 2020-2035
  • Table 19: Latin America Market Value (USD Million) Forecast by Product Category, 2020-2035
  • Table 20: Latin America Market Volume (Units) Forecast by Product Category, 2020-2035
  • Table 21: Latin America Market Value (USD Million) Forecast by Functional Benefit, 2020-2035
  • Table 22: Latin America Market Volume (Units) Forecast by Functional Benefit, 2020-2035
  • Table 23: Latin America Market Value (USD Million) Forecast by Distribution Channel, 2020-2035
  • Table 24: Latin America Market Volume (Units) Forecast by Distribution Channel, 2020-2035
  • Table 25: Europe Market Value (USD Million) Forecast by Country, 2020-2035
  • Table 26: Europe Market Volume (Units) Forecast by Country, 2020-2035
  • Table 27: Europe Market Value (USD Million) Forecast by Product Category, 2020-2035
  • Table 28: Europe Market Volume (Units) Forecast by Product Category, 2020-2035
  • Table 29: Europe Market Value (USD Million) Forecast by Functional Benefit, 2020-2035
  • Table 30: Europe Market Volume (Units) Forecast by Functional Benefit, 2020-2035
  • Table 31: Europe Market Value (USD Million) Forecast by Distribution Channel, 2020-2035
  • Table 32: Europe Market Volume (Units) Forecast by Distribution Channel, 2020-2035
  • Table 33: East Asia Market Value (USD Million) Forecast by Country, 2020-2035
  • Table 34: East Asia Market Volume (Units) Forecast by Country, 2020-2035
  • Table 35: East Asia Market Value (USD Million) Forecast by Product Category, 2020-2035
  • Table 36: East Asia Market Volume (Units) Forecast by Product Category, 2020-2035
  • Table 37: East Asia Market Value (USD Million) Forecast by Functional Benefit, 2020-2035
  • Table 38: East Asia Market Volume (Units) Forecast by Functional Benefit, 2020-2035
  • Table 39: East Asia Market Value (USD Million) Forecast by Distribution Channel, 2020-2035
  • Table 40: East Asia Market Volume (Units) Forecast by Distribution Channel, 2020-2035
  • Table 41: South Asia & Pacific Market Value (USD Million) Forecast by Country, 2020-2035
  • Table 42: South Asia & Pacific Market Volume (Units) Forecast by Country, 2020-2035
  • Table 43: South Asia & Pacific Market Value (USD Million) Forecast by Product Category, 2020-2035
  • Table 44: South Asia & Pacific Market Volume (Units) Forecast by Product Category, 2020-2035
  • Table 45: South Asia & Pacific Market Value (USD Million) Forecast by Functional Benefit, 2020-2035
  • Table 46: South Asia & Pacific Market Volume (Units) Forecast by Functional Benefit, 2020-2035
  • Table 47: South Asia & Pacific Market Value (USD Million) Forecast by Distribution Channel, 2020-2035
  • Table 48: South Asia & Pacific Market Volume (Units) Forecast by Distribution Channel, 2020-2035
  • Table 49: Middle East and Africa Market Value (USD Million) Forecast by Country, 2020-2035
  • Table 50: Middle East and Africa Market Volume (Units) Forecast by Country, 2020-2035
  • Table 51: Middle East and Africa Market Value (USD Million) Forecast by Product Category, 2020-2035
  • Table 52: Middle East and Africa Market Volume (Units) Forecast by Product Category, 2020-2035
  • Table 53: Middle East and Africa Market Value (USD Million) Forecast by Functional Benefit, 2020-2035
  • Table 54: Middle East and Africa Market Volume (Units) Forecast by Functional Benefit, 2020-2035
  • Table 55: Middle East and Africa Market Value (USD Million) Forecast by Distribution Channel, 2020-2035
  • Table 56: Middle East and Africa Market Volume (Units) Forecast by Distribution Channel, 2020-2035

List of Figures

  • Figure 1: Global Market Value (USD Million) by Product Category, 2025-2035
  • Figure 2: Global Market Value (USD Million) by Functional Benefit, 2025-2035
  • Figure 3: Global Market Value (USD Million) by Distribution Channel, 2025-2035
  • Figure 4: Global Market Value (USD Million) by Region, 2025-2035
  • Figure 5: Global Market Value (USD Million) Analysis by Region, 2020-2035
  • Figure 6: Global Market Volume (Units) Analysis by Region, 2020-2035
  • Figure 7: Global Market Value Share (%) and BPS Analysis by Region, 2025-2035
  • Figure 8: Global Market Y-o-Y Growth (%) Projections by Region, 2025-2035
  • Figure 9: Global Market Value (USD Million) Analysis by Product Category, 2020-2035
  • Figure 10: Global Market Volume (Units) Analysis by Product Category, 2020-2035
  • Figure 11: Global Market Value Share (%) and BPS Analysis by Product Category, 2025-2035
  • Figure 12: Global Market Y-o-Y Growth (%) Projections by Product Category, 2025-2035
  • Figure 13: Global Market Value (USD Million) Analysis by Functional Benefit, 2020-2035
  • Figure 14: Global Market Volume (Units) Analysis by Functional Benefit, 2020-2035
  • Figure 15: Global Market Value Share (%) and BPS Analysis by Functional Benefit, 2025-2035
  • Figure 16: Global Market Y-o-Y Growth (%) Projections by Functional Benefit, 2025-2035
  • Figure 17: Global Market Value (USD Million) Analysis by Distribution Channel, 2020-2035
  • Figure 18: Global Market Volume (Units) Analysis by Distribution Channel, 2020-2035
  • Figure 19: Global Market Value Share (%) and BPS Analysis by Distribution Channel, 2025-2035
  • Figure 20: Global Market Y-o-Y Growth (%) Projections by Distribution Channel, 2025-2035
  • Figure 21: Global Market Attractiveness by Product Category, 2025-2035
  • Figure 22: Global Market Attractiveness by Functional Benefit, 2025-2035
  • Figure 23: Global Market Attractiveness by Distribution Channel, 2025-2035
  • Figure 24: Global Market Attractiveness by Region, 2025-2035
  • Figure 25: North America Market Value (USD Million) by Product Category, 2025-2035
  • Figure 26: North America Market Value (USD Million) by Functional Benefit, 2025-2035
  • Figure 27: North America Market Value (USD Million) by Distribution Channel, 2025-2035
  • Figure 28: North America Market Value (USD Million) by Country, 2025-2035
  • Figure 29: North America Market Value (USD Million) Analysis by Country, 2020-2035
  • Figure 30: North America Market Volume (Units) Analysis by Country, 2020-2035
  • Figure 31: North America Market Value Share (%) and BPS Analysis by Country, 2025-2035
  • Figure 32: North America Market Y-o-Y Growth (%) Projections by Country, 2025-2035
  • Figure 33: North America Market Value (USD Million) Analysis by Product Category, 2020-2035
  • Figure 34: North America Market Volume (Units) Analysis by Product Category, 2020-2035
  • Figure 35: North America Market Value Share (%) and BPS Analysis by Product Category, 2025-2035
  • Figure 36: North America Market Y-o-Y Growth (%) Projections by Product Category, 2025-2035
  • Figure 37: North America Market Value (USD Million) Analysis by Functional Benefit, 2020-2035
  • Figure 38: North America Market Volume (Units) Analysis by Functional Benefit, 2020-2035
  • Figure 39: North America Market Value Share (%) and BPS Analysis by Functional Benefit, 2025-2035
  • Figure 40: North America Market Y-o-Y Growth (%) Projections by Functional Benefit, 2025-2035
  • Figure 41: North America Market Value (USD Million) Analysis by Distribution Channel, 2020-2035
  • Figure 42: North America Market Volume (Units) Analysis by Distribution Channel, 2020-2035
  • Figure 43: North America Market Value Share (%) and BPS Analysis by Distribution Channel, 2025-2035
  • Figure 44: North America Market Y-o-Y Growth (%) Projections by Distribution Channel, 2025-2035
  • Figure 45: North America Market Attractiveness by Product Category, 2025-2035
  • Figure 46: North America Market Attractiveness by Functional Benefit, 2025-2035
  • Figure 47: North America Market Attractiveness by Distribution Channel, 2025-2035
  • Figure 48: North America Market Attractiveness by Country, 2025-2035
  • Figure 49: Latin America Market Value (USD Million) by Product Category, 2025-2035
  • Figure 50: Latin America Market Value (USD Million) by Functional Benefit, 2025-2035
  • Figure 51: Latin America Market Value (USD Million) by Distribution Channel, 2025-2035
  • Figure 52: Latin America Market Value (USD Million) by Country, 2025-2035
  • Figure 53: Latin America Market Value (USD Million) Analysis by Country, 2020-2035
  • Figure 54: Latin America Market Volume (Units) Analysis by Country, 2020-2035
  • Figure 55: Latin America Market Value Share (%) and BPS Analysis by Country, 2025-2035
  • Figure 56: Latin America Market Y-o-Y Growth (%) Projections by Country, 2025-2035
  • Figure 57: Latin America Market Value (USD Million) Analysis by Product Category, 2020-2035
  • Figure 58: Latin America Market Volume (Units) Analysis by Product Category, 2020-2035
  • Figure 59: Latin America Market Value Share (%) and BPS Analysis by Product Category, 2025-2035
  • Figure 60: Latin America Market Y-o-Y Growth (%) Projections by Product Category, 2025-2035
  • Figure 61: Latin America Market Value (USD Million) Analysis by Functional Benefit, 2020-2035
  • Figure 62: Latin America Market Volume (Units) Analysis by Functional Benefit, 2020-2035
  • Figure 63: Latin America Market Value Share (%) and BPS Analysis by Functional Benefit, 2025-2035
  • Figure 64: Latin America Market Y-o-Y Growth (%) Projections by Functional Benefit, 2025-2035
  • Figure 65: Latin America Market Value (USD Million) Analysis by Distribution Channel, 2020-2035
  • Figure 66: Latin America Market Volume (Units) Analysis by Distribution Channel, 2020-2035
  • Figure 67: Latin America Market Value Share (%) and BPS Analysis by Distribution Channel, 2025-2035
  • Figure 68: Latin America Market Y-o-Y Growth (%) Projections by Distribution Channel, 2025-2035
  • Figure 69: Latin America Market Attractiveness by Product Category, 2025-2035
  • Figure 70: Latin America Market Attractiveness by Functional Benefit, 2025-2035
  • Figure 71: Latin America Market Attractiveness by Distribution Channel, 2025-2035
  • Figure 72: Latin America Market Attractiveness by Country, 2025-2035
  • Figure 73: Europe Market Value (USD Million) by Product Category, 2025-2035
  • Figure 74: Europe Market Value (USD Million) by Functional Benefit, 2025-2035
  • Figure 75: Europe Market Value (USD Million) by Distribution Channel, 2025-2035
  • Figure 76: Europe Market Value (USD Million) by Country, 2025-2035
  • Figure 77: Europe Market Value (USD Million) Analysis by Country, 2020-2035
  • Figure 78: Europe Market Volume (Units) Analysis by Country, 2020-2035
  • Figure 79: Europe Market Value Share (%) and BPS Analysis by Country, 2025-2035
  • Figure 80: Europe Market Y-o-Y Growth (%) Projections by Country, 2025-2035
  • Figure 81: Europe Market Value (USD Million) Analysis by Product Category, 2020-2035
  • Figure 82: Europe Market Volume (Units) Analysis by Product Category, 2020-2035
  • Figure 83: Europe Market Value Share (%) and BPS Analysis by Product Category, 2025-2035
  • Figure 84: Europe Market Y-o-Y Growth (%) Projections by Product Category, 2025-2035
  • Figure 85: Europe Market Value (USD Million) Analysis by Functional Benefit, 2020-2035
  • Figure 86: Europe Market Volume (Units) Analysis by Functional Benefit, 2020-2035
  • Figure 87: Europe Market Value Share (%) and BPS Analysis by Functional Benefit, 2025-2035
  • Figure 88: Europe Market Y-o-Y Growth (%) Projections by Functional Benefit, 2025-2035
  • Figure 89: Europe Market Value (USD Million) Analysis by Distribution Channel, 2020-2035
  • Figure 90: Europe Market Volume (Units) Analysis by Distribution Channel, 2020-2035
  • Figure 91: Europe Market Value Share (%) and BPS Analysis by Distribution Channel, 2025-2035
  • Figure 92: Europe Market Y-o-Y Growth (%) Projections by Distribution Channel, 2025-2035
  • Figure 93: Europe Market Attractiveness by Product Category, 2025-2035
  • Figure 94: Europe Market Attractiveness by Functional Benefit, 2025-2035
  • Figure 95: Europe Market Attractiveness by Distribution Channel, 2025-2035
  • Figure 96: Europe Market Attractiveness by Country, 2025-2035
  • Figure 97: East Asia Market Value (USD Million) by Product Category, 2025-2035
  • Figure 98: East Asia Market Value (USD Million) by Functional Benefit, 2025-2035
  • Figure 99: East Asia Market Value (USD Million) by Distribution Channel, 2025-2035
  • Figure 100: East Asia Market Value (USD Million) by Country, 2025-2035
  • Figure 101: East Asia Market Value (USD Million) Analysis by Country, 2020-2035
  • Figure 102: East Asia Market Volume (Units) Analysis by Country, 2020-2035
  • Figure 103: East Asia Market Value Share (%) and BPS Analysis by Country, 2025-2035
  • Figure 104: East Asia Market Y-o-Y Growth (%) Projections by Country, 2025-2035
  • Figure 105: East Asia Market Value (USD Million) Analysis by Product Category, 2020-2035
  • Figure 106: East Asia Market Volume (Units) Analysis by Product Category, 2020-2035
  • Figure 107: East Asia Market Value Share (%) and BPS Analysis by Product Category, 2025-2035
  • Figure 108: East Asia Market Y-o-Y Growth (%) Projections by Product Category, 2025-2035
  • Figure 109: East Asia Market Value (USD Million) Analysis by Functional Benefit, 2020-2035
  • Figure 110: East Asia Market Volume (Units) Analysis by Functional Benefit, 2020-2035
  • Figure 111: East Asia Market Value Share (%) and BPS Analysis by Functional Benefit, 2025-2035
  • Figure 112: East Asia Market Y-o-Y Growth (%) Projections by Functional Benefit, 2025-2035
  • Figure 113: East Asia Market Value (USD Million) Analysis by Distribution Channel, 2020-2035
  • Figure 114: East Asia Market Volume (Units) Analysis by Distribution Channel, 2020-2035
  • Figure 115: East Asia Market Value Share (%) and BPS Analysis by Distribution Channel, 2025-2035
  • Figure 116: East Asia Market Y-o-Y Growth (%) Projections by Distribution Channel, 2025-2035
  • Figure 117: East Asia Market Attractiveness by Product Category, 2025-2035
  • Figure 118: East Asia Market Attractiveness by Functional Benefit, 2025-2035
  • Figure 119: East Asia Market Attractiveness by Distribution Channel, 2025-2035
  • Figure 120: East Asia Market Attractiveness by Country, 2025-2035
  • Figure 121: South Asia & Pacific Market Value (USD Million) by Product Category, 2025-2035
  • Figure 122: South Asia & Pacific Market Value (USD Million) by Functional Benefit, 2025-2035
  • Figure 123: South Asia & Pacific Market Value (USD Million) by Distribution Channel, 2025-2035
  • Figure 124: South Asia & Pacific Market Value (USD Million) by Country, 2025-2035
  • Figure 125: South Asia & Pacific Market Value (USD Million) Analysis by Country, 2020-2035
  • Figure 126: South Asia & Pacific Market Volume (Units) Analysis by Country, 2020-2035
  • Figure 127: South Asia & Pacific Market Value Share (%) and BPS Analysis by Country, 2025-2035
  • Figure 128: South Asia & Pacific Market Y-o-Y Growth (%) Projections by Country, 2025-2035
  • Figure 129: South Asia & Pacific Market Value (USD Million) Analysis by Product Category, 2020-2035
  • Figure 130: South Asia & Pacific Market Volume (Units) Analysis by Product Category, 2020-2035
  • Figure 131: South Asia & Pacific Market Value Share (%) and BPS Analysis by Product Category, 2025-2035
  • Figure 132: South Asia & Pacific Market Y-o-Y Growth (%) Projections by Product Category, 2025-2035
  • Figure 133: South Asia & Pacific Market Value (USD Million) Analysis by Functional Benefit, 2020-2035
  • Figure 134: South Asia & Pacific Market Volume (Units) Analysis by Functional Benefit, 2020-2035
  • Figure 135: South Asia & Pacific Market Value Share (%) and BPS Analysis by Functional Benefit, 2025-2035
  • Figure 136: South Asia & Pacific Market Y-o-Y Growth (%) Projections by Functional Benefit, 2025-2035
  • Figure 137: South Asia & Pacific Market Value (USD Million) Analysis by Distribution Channel, 2020-2035
  • Figure 138: South Asia & Pacific Market Volume (Units) Analysis by Distribution Channel, 2020-2035
  • Figure 139: South Asia & Pacific Market Value Share (%) and BPS Analysis by Distribution Channel, 2025-2035
  • Figure 140: South Asia & Pacific Market Y-o-Y Growth (%) Projections by Distribution Channel, 2025-2035
  • Figure 141: South Asia & Pacific Market Attractiveness by Product Category, 2025-2035
  • Figure 142: South Asia & Pacific Market Attractiveness by Functional Benefit, 2025-2035
  • Figure 143: South Asia & Pacific Market Attractiveness by Distribution Channel, 2025-2035
  • Figure 144: South Asia & Pacific Market Attractiveness by Country, 2025-2035
  • Figure 145: Middle East and Africa Market Value (USD Million) by Product Category, 2025-2035
  • Figure 146: Middle East and Africa Market Value (USD Million) by Functional Benefit, 2025-2035
  • Figure 147: Middle East and Africa Market Value (USD Million) by Distribution Channel, 2025-2035
  • Figure 148: Middle East and Africa Market Value (USD Million) by Country, 2025-2035
  • Figure 149: Middle East and Africa Market Value (USD Million) Analysis by Country, 2020-2035
  • Figure 150: Middle East and Africa Market Volume (Units) Analysis by Country, 2020-2035
  • Figure 151: Middle East and Africa Market Value Share (%) and BPS Analysis by Country, 2025-2035
  • Figure 152: Middle East and Africa Market Y-o-Y Growth (%) Projections by Country, 2025-2035
  • Figure 153: Middle East and Africa Market Value (USD Million) Analysis by Product Category, 2020-2035
  • Figure 154: Middle East and Africa Market Volume (Units) Analysis by Product Category, 2020-2035
  • Figure 155: Middle East and Africa Market Value Share (%) and BPS Analysis by Product Category, 2025-2035
  • Figure 156: Middle East and Africa Market Y-o-Y Growth (%) Projections by Product Category, 2025-2035
  • Figure 157: Middle East and Africa Market Value (USD Million) Analysis by Functional Benefit, 2020-2035
  • Figure 158: Middle East and Africa Market Volume (Units) Analysis by Functional Benefit, 2020-2035
  • Figure 159: Middle East and Africa Market Value Share (%) and BPS Analysis by Functional Benefit, 2025-2035
  • Figure 160: Middle East and Africa Market Y-o-Y Growth (%) Projections by Functional Benefit, 2025-2035
  • Figure 161: Middle East and Africa Market Value (USD Million) Analysis by Distribution Channel, 2020-2035
  • Figure 162: Middle East and Africa Market Volume (Units) Analysis by Distribution Channel, 2020-2035
  • Figure 163: Middle East and Africa Market Value Share (%) and BPS Analysis by Distribution Channel, 2025-2035
  • Figure 164: Middle East and Africa Market Y-o-Y Growth (%) Projections by Distribution Channel, 2025-2035
  • Figure 165: Middle East and Africa Market Attractiveness by Product Category, 2025-2035
  • Figure 166: Middle East and Africa Market Attractiveness by Functional Benefit, 2025-2035
  • Figure 167: Middle East and Africa Market Attractiveness by Distribution Channel, 2025-2035
  • Figure 168: Middle East and Africa Market Attractiveness by Country, 2025-2035

Frequently Asked Questions

How big is the Glass Skin Market in 2025?

The global GLASS SKIN Market is estimated to be valued at USD 15,435.2 million in 2025.

What will be the size of Glass Skin Market in 2035?

The market size for the GLASS SKIN Market is projected to reach USD 42,020.7 million by 2035.

How much will be the Glass Skin Market growth between 2025 and 2035?

The GLASS SKIN Market is expected to grow at a 10.5% CAGR between 2025 and 2035.

What are the key product types in the Glass Skin Market?

The key product types include skincare (such as cleansers, toners, essences, serums, moisturizers, masks, exfoliators, and sunscreens), color cosmetics (like skin tints, illuminating primers, dewy finish setting sprays, and liquid/cream highlighters), and beauty tools & devices (including facial rollers, LED light masks, ultrasonic infusion devices, microcurrent devices, and skin analyzers).

Which segment has contributed significantly to the Glass Skin Market in 2025?

The hydration & moisture retention segment has the majority of functional benefit value share, estimated at 42.5% in 2025.

Explore Similar Insights

Future Market Insights

Glass Skin Market